KX Dashboards
Create a dashboard
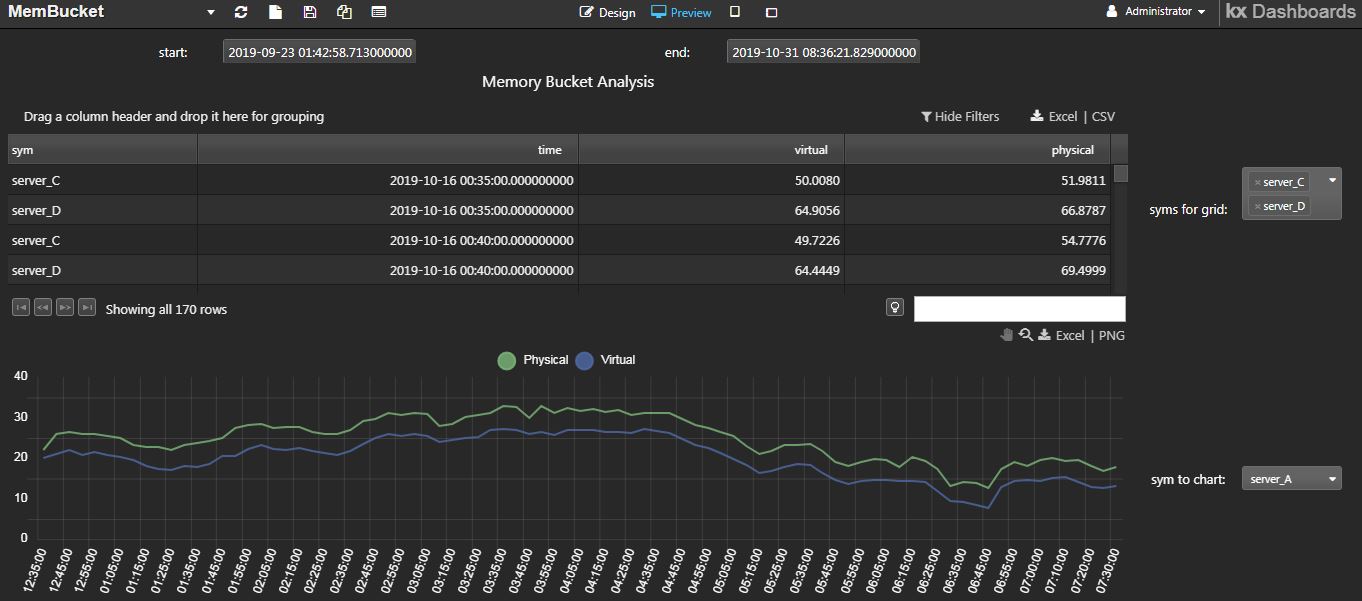
KX Dashboards is an interactive data visualization tool that enables users to query and present data. In this example, a sample dashboard will be created using the extraction APIs written in the last section.
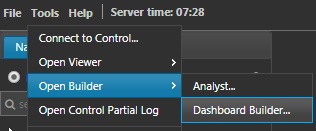
- To create one, select Tools > Open Builder > Dashboard Builder from KX Control.
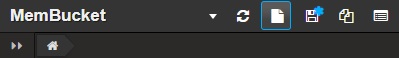
- Create a new dashboard by clicking the highlighted icon.
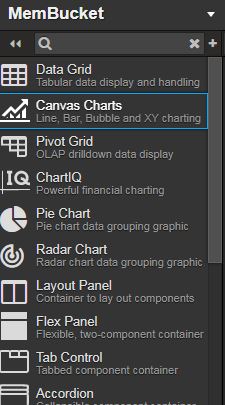
- You can click on the >> button to expand the menu to see what the icons entail.
- Click Preview to study the interactions of the dashboard.

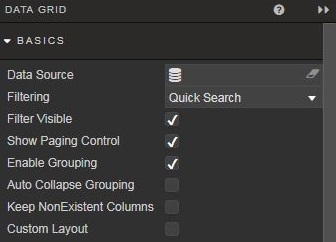
Data grid
- Drag a
data gridfrom the icon on the left-hand side, and adjust the size.
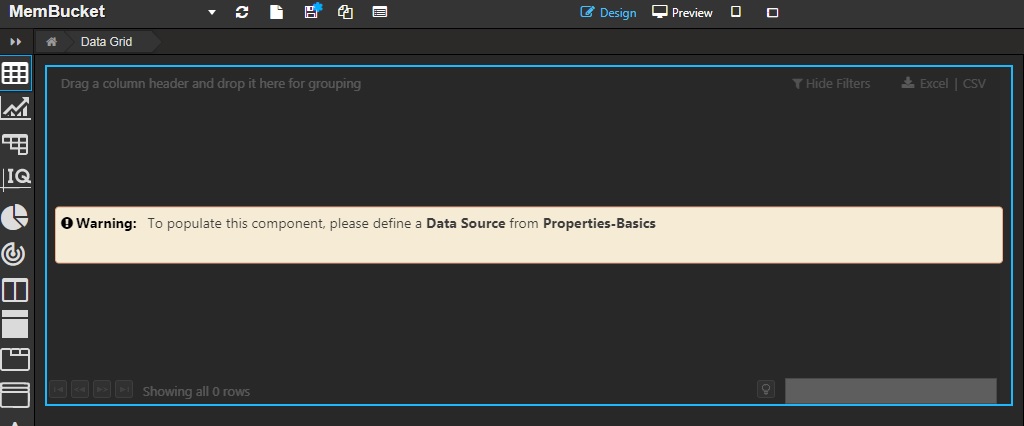
- To configure the data source, click on the
data sourceon the right-hand side menu.
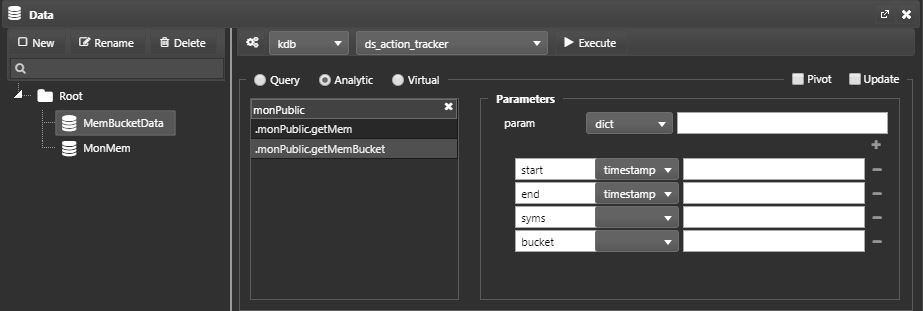
- A pop up will appear. Click on New and create a data source named MemBucketData. Select the
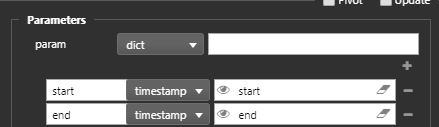
Analyticradio button and the.monPublic.getMemBucketanalytic from the menu. As we've defined this analytic to take in a dictionary as the parameter, selectdictand add the parameters as below. Set theSubscriptiontoManaged.
- Now, execute the query to see if you get data back. If successful, you should see a table returned on the bottom:
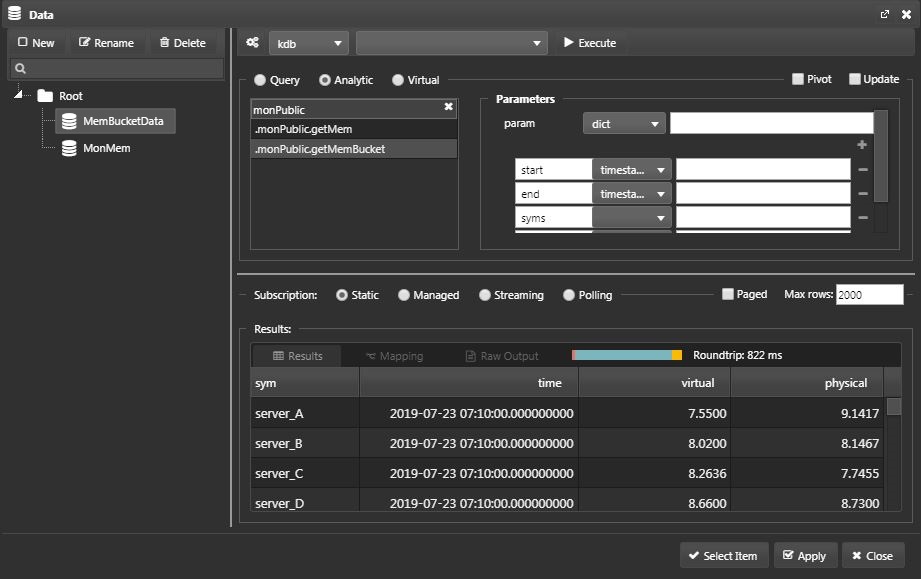
-
Select
ApplyandSelect Item. -
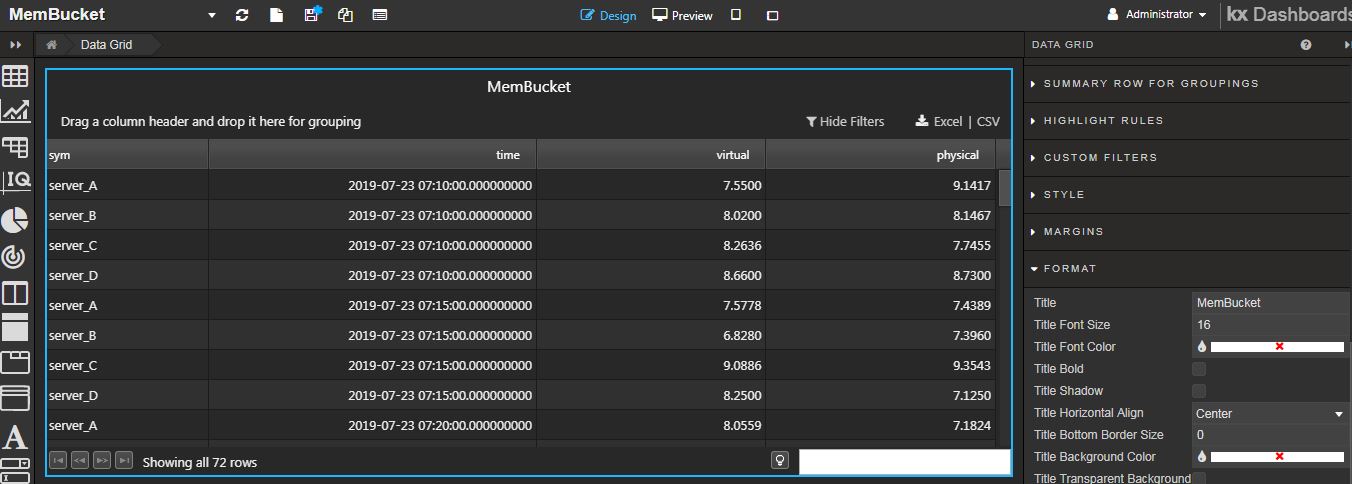
You should see a table displaying where you dragged the data grid.
Execution Order
It is important to execute the data source in this order: Execute > Apply > Select Item.
Parameterise the data grid
Next, add components to parameterise the dashboard and data grid. Given are simple examples, but these can be altered to make it dynamic.
Datepicker
-
Next, create components to filter the same data set by the time column.
-
Create two datepickers. These will be later linked to the MemBucketData datasource.
-
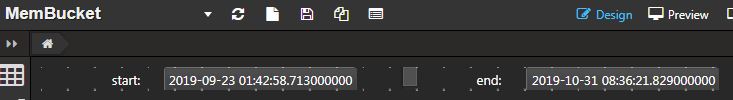
Drag a datepicker and type
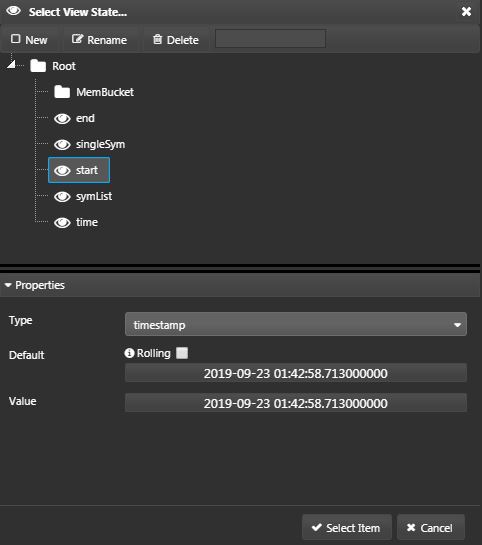
start:in Basics > Label. Click on the text box of Selected Date which will prompt a pop-up. -
This is the screen to create a View State. Click on New and name it start. Configure the Properties as below and select any past date. Click Select Item.
- Drag another datepicker and do the same for end, but instead, select Now for current timestamp or any future date.
Currently, these datepickers aren't attached to the data source so it won't do anything when you select the date.
- Go back to the data grid and open the MemBucketData data source. In params, set the start and end as the View States we've just created. The dates choosen via the datepicker now gets sent as the parameters to the MemBucketData data source that calls the
.monPublic.getMemBucketanalytic.
- In the Preview mode, change the start and end timestamp, and test if data is correctly filtered by time.
Drop down list
The next step is to create a drop down list. This is used to filter data by sym.
-
Drag the drop down list icon.
-
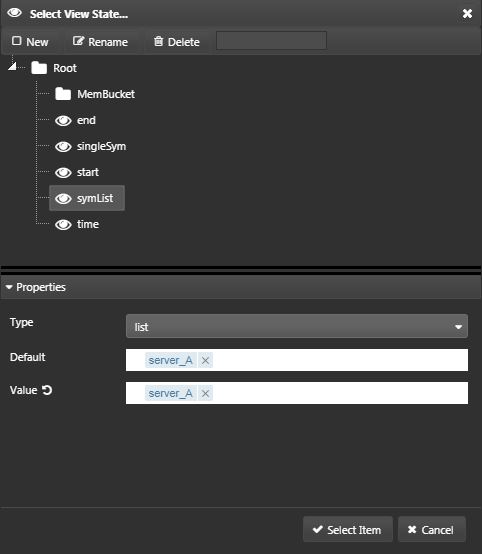
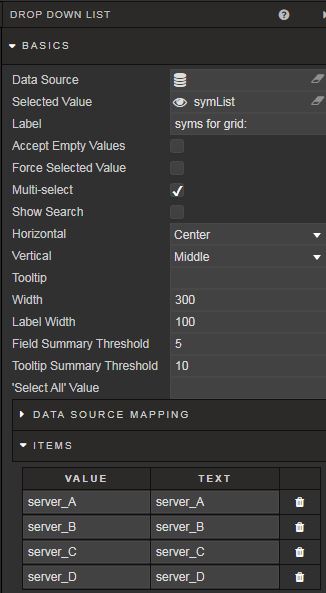
In Basics > Selected Value, create a new View State and name it symList. Set the values as below and click Select Item.
-
Make sure that
Multi-selectis checked. -
In Basics > Items, hard-code the 4 syms.
Dynamic Selection
The example is hard-coded for simplicity, but they may be driven from a query to dynamically extract syms.
-
You can play around with the settings such as changing layout sizes and the Label to make it more intuitive for users.
-
Instead of attaching the symList View State to the MemBucketData data source, create a virtual query.
Virtual query
Virtual queries utilize data loaded to the client. Assigned data sources to the virtual query do not re-query the database.
- Create a new data source named
MemBucketChartand write a virtual query that utilize MemBucketData data source. Allow filtering of multiple syms to source the data grid.
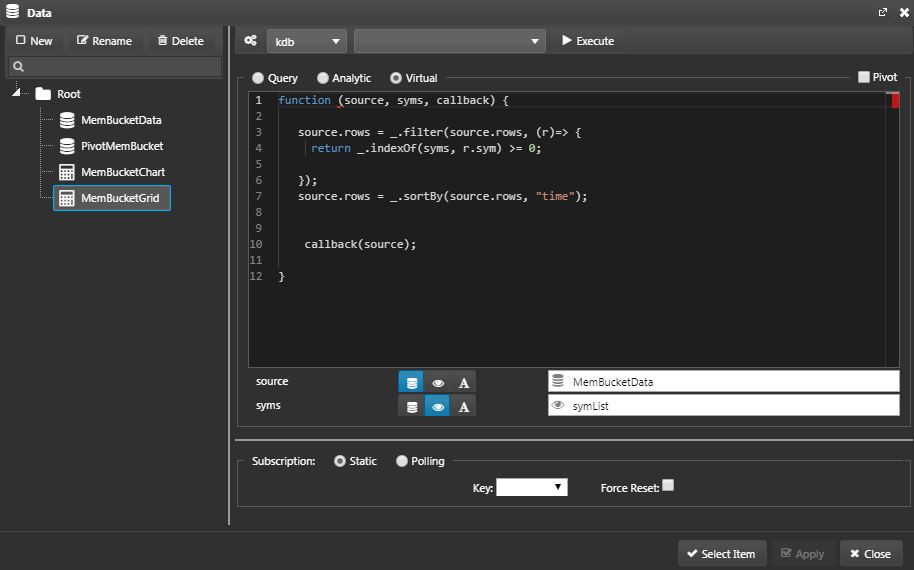
function (source, syms, callback) {

   source.rows = _.filter(source.rows, (r)=> {
     return _.indexOf(syms, r.sym) >= 0;

   });
   source.rows = _.sortBy(source.rows, "time");

   callback(source);
}
-
Execute the query to see if you successfully get data back. Select
ApplyandSelect Item. -
Now add the MemBucketGrid data source to the data grid.
Line graph
-
Next, create a line graph that displays the
physicalandvirtualcolumns of a single sym on a time series. -
Drag a
Canvas Chartto an empty space.
Parameterise the line graph
-
To filter time, use the same
startandendview state created before. -
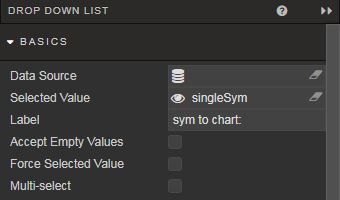
Drag another drop down list icon.
-
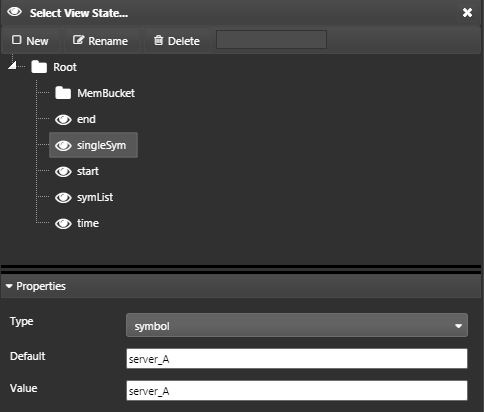
In Basics > Selected Value, create a new View State and name it singleSym. Set the values as below and click Select Item.
-
Make sure that
Multi-selectis unchecked. -
Similarly to above, hard-code the 4 syms in Basics > Items.
Virtual query
- Create a new data source named
MemBucketChartand write a virtual query that utilize MemBucketData data source. Allow filtering of a single sym to source the line graph.
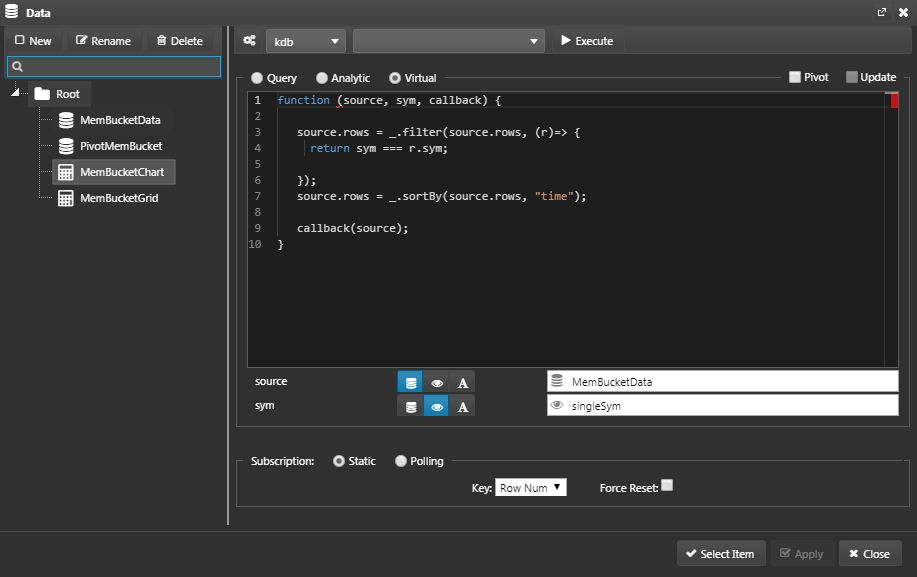
function (source, sym, callback) {

   source.rows = _.filter(source.rows, (r)=> {
     return sym === r.sym;

   });
   source.rows = _.sortBy(source.rows, "time");

   callback(source);
}
-
Execute the query to see if you successfully get data back. Select
ApplyandSelect Item. -
Now add the MemBucketChart data source to the canvas chart.
-
Set two layers for columns: virtual and physical.
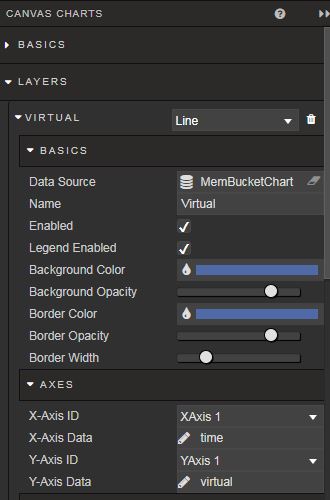
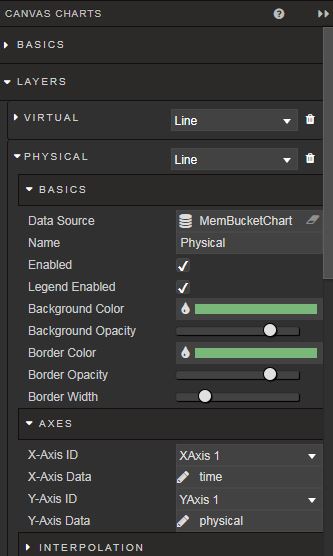
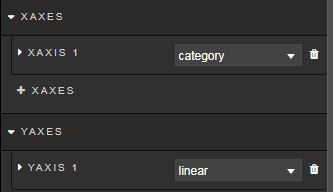
-Set the axes.
Testing
- In preview mode, test if you can filter the data grid and line graph by each of the associated drop-down menu.
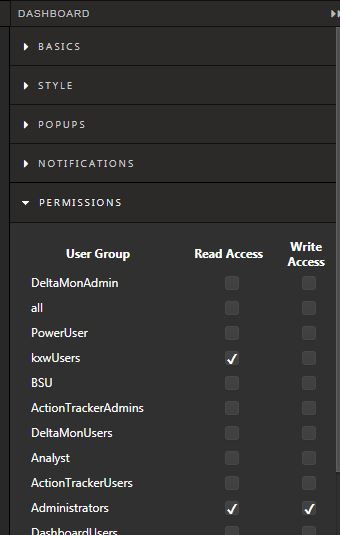
Entitlements
-
Once you are done creating your Dashboard, give the user permission to access it.
-
Click on an empty space in your Dashboard. On the right-hand side, open
Permissionsand checkRead AccessforKxwUsers.
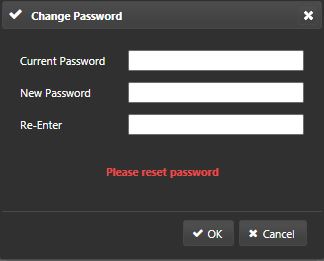
- Logout of
Administratorand login to Dashboards withkxwUser. You will be prompted to reset your password. In this example, we've set the new password askxwarehousewhich will be used in further examples.
- Reset your password and re-login with
kxwUserand the new password. You should be able to see the new Dashboard.
Add to package
The dashboard does not automatically get assigned to a particular package. Manually add this to the KxWarehouse package.
-
Go back to KX Control and find the Dashboard in the
Unpackaged Entitieson the Navigation panel. -
Open the Package Exporter tree from Tools > Package Exporter.
-
Drag the Dashboard into the tree and hit Save.
Limit concurrent sessions
Limiting concurrent sessions ensures license compliance, system stability, and fair resource distribution. There are two ways to limit the number of simultaneous dashboards sessions:
If a limit is specified in both locations, the tighter limit applies.
General limits
The license file defines the maximum number of allowed concurrent dashboards users, concurrent dashboards sessions, and concurrent dashboards sessions per user. If opening a new dashboards session would exceed any of these license-enforced limits, the system blocks the creation of a new session until an existing session is closed.
User specific limits
The DASHsessionLimits configuration parameter offers a more granular way to control the number of simultaneous dashboards sessions. In this configuration, you can set limits per dashboard type. You can override the default parameter to introduce a set of limits for each usergroup.