Server health
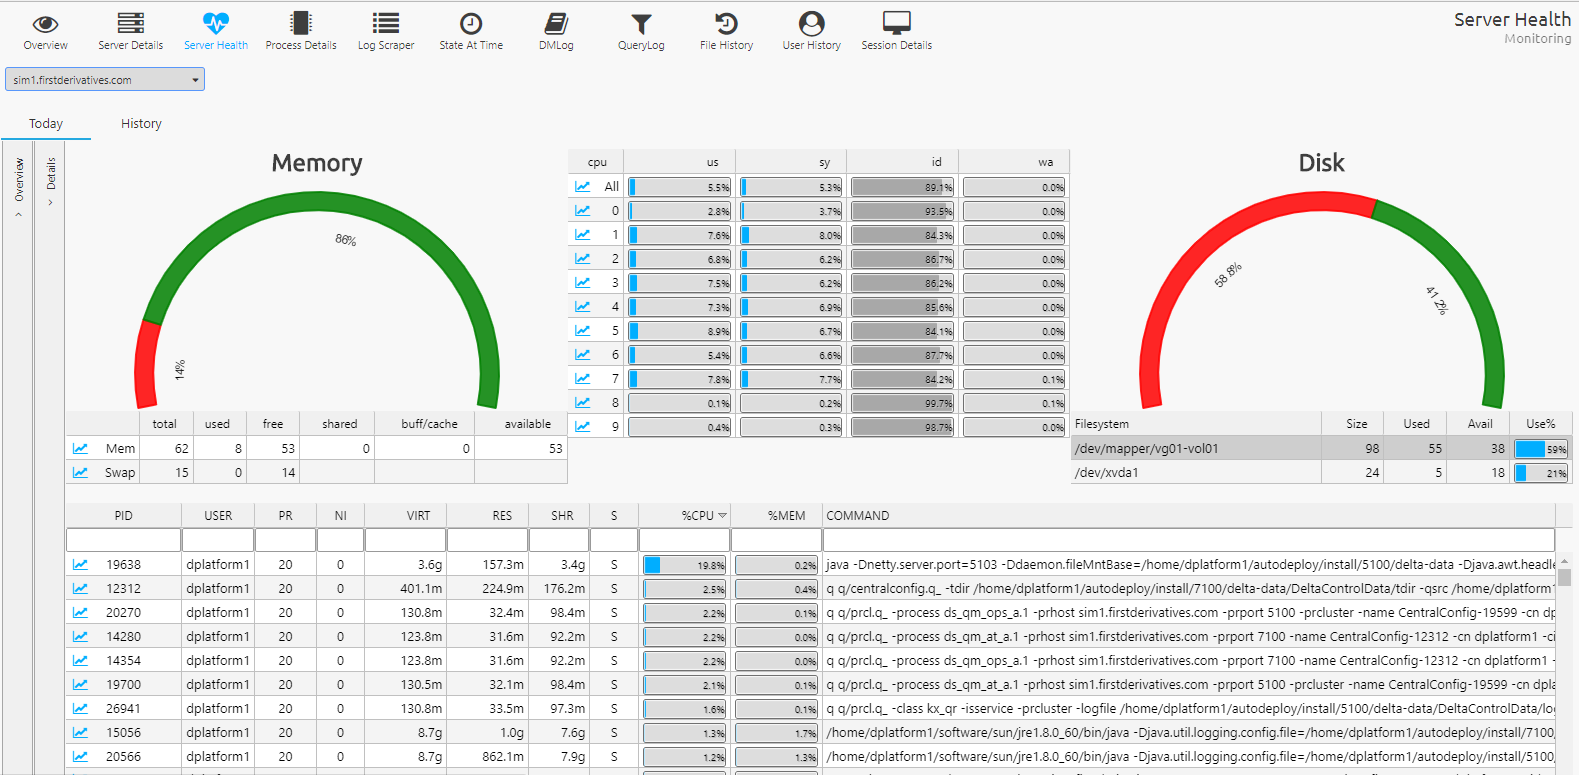
On the Monitoring dashboard the Server Health tab provides a real-time and a historical view of current server.
Today
The Today label displays real-time CPU, memory and disk utilization.
Details
Memory
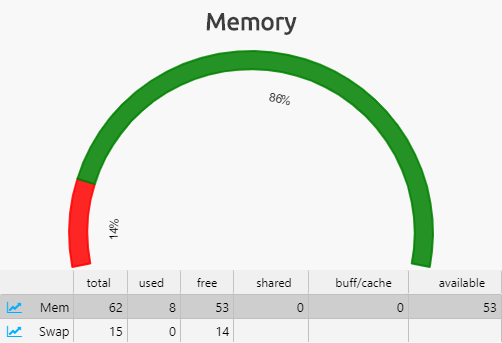
This table and meter show % and GB memory used as well as the total available on selected server. Click on chart icon to view time series.
CPU
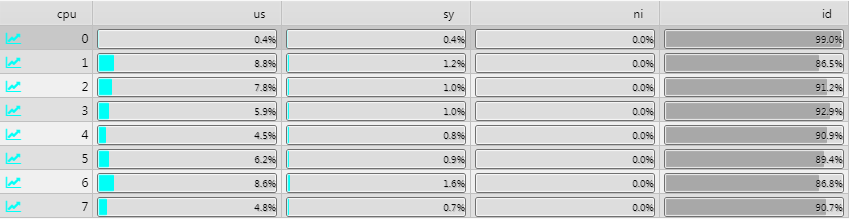
This table shows CPU usage per core. Click on chart icon to view time series.
Disk
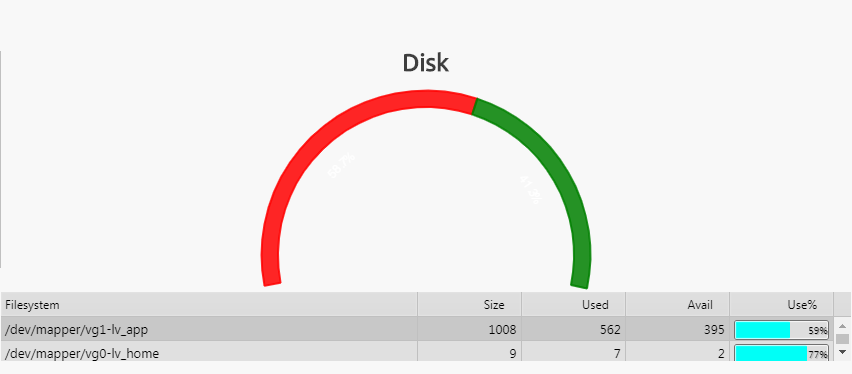
This table and meter show % and GB disk used as well as the total available. Click on a row to update the meter.
Process
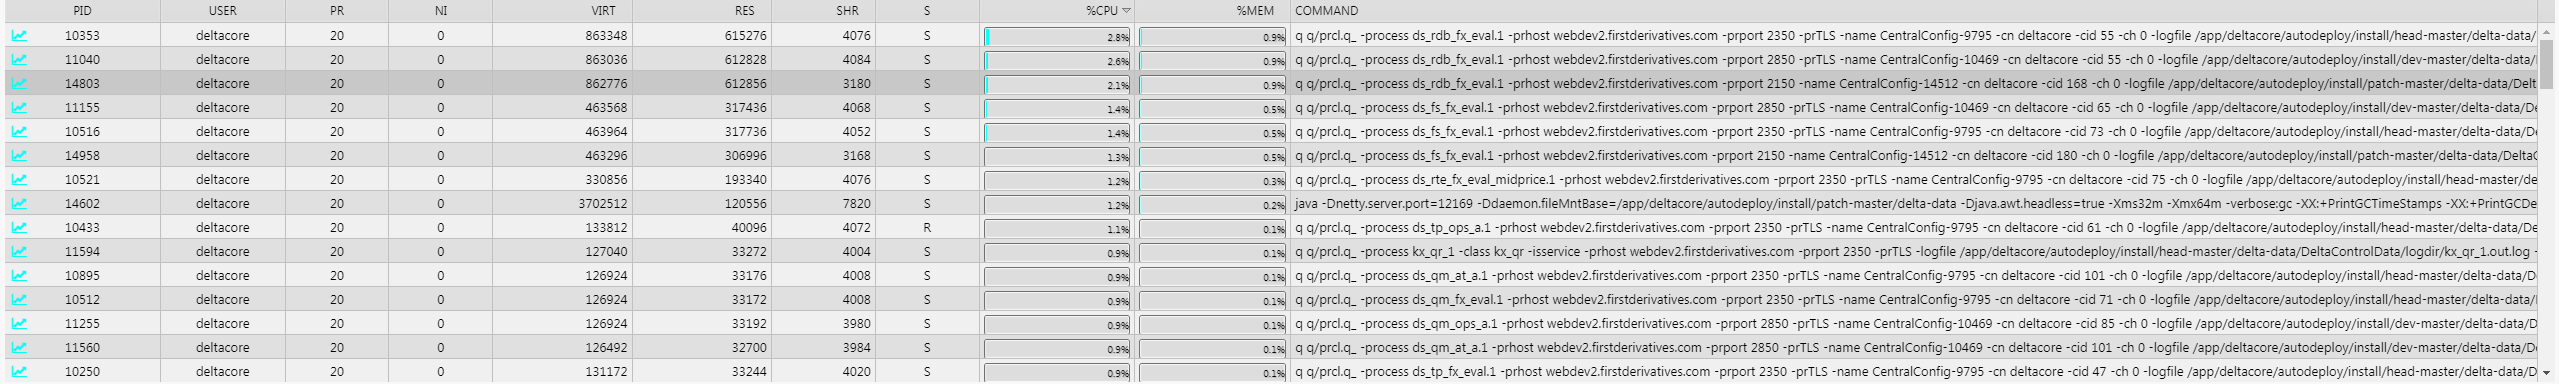
This table shows CPU usage per process. Click on chart icon to view time series.
Overview
Overview displays a quick real-time view across all servers and monitored resources. Click row to update server selection for Details
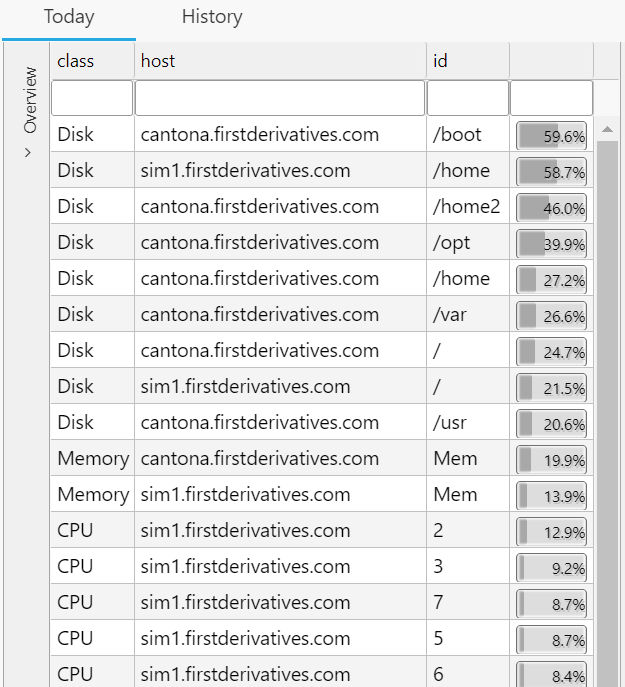
Table allows a user to quickly see high levels of utilization.
History
The History label will display historical CPU, memory and running PID information for selected server and date.
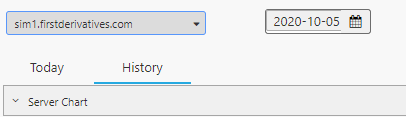
Select historical date from date picker to populate graphs
Server CPU/Memory
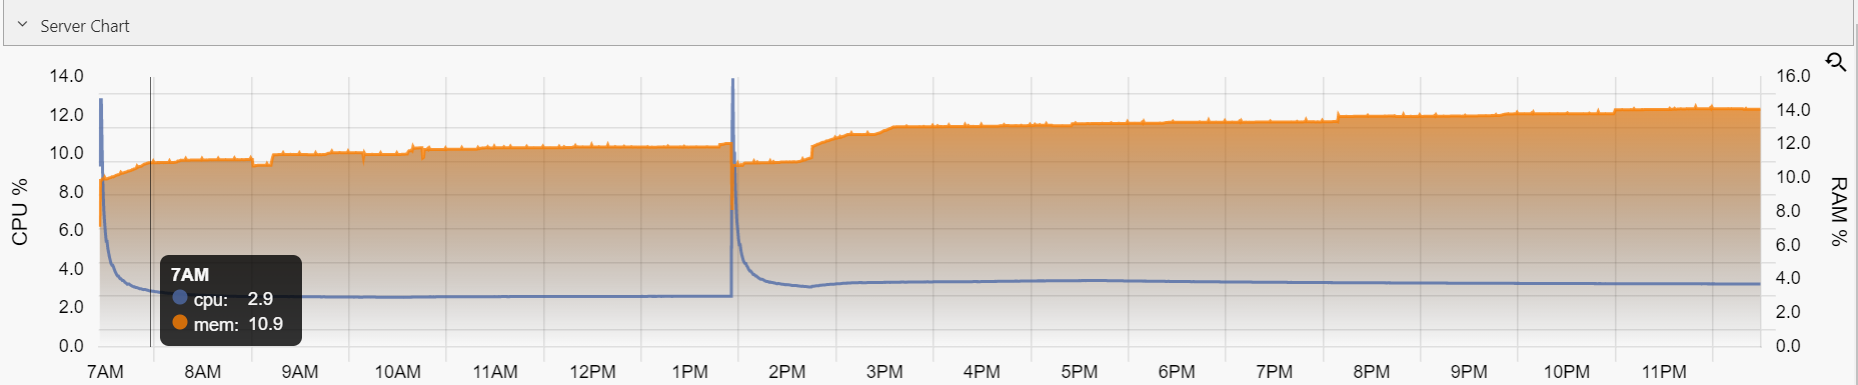
Server Chart is CPU and Memory time series for selected date and server
Process CPU/Memory
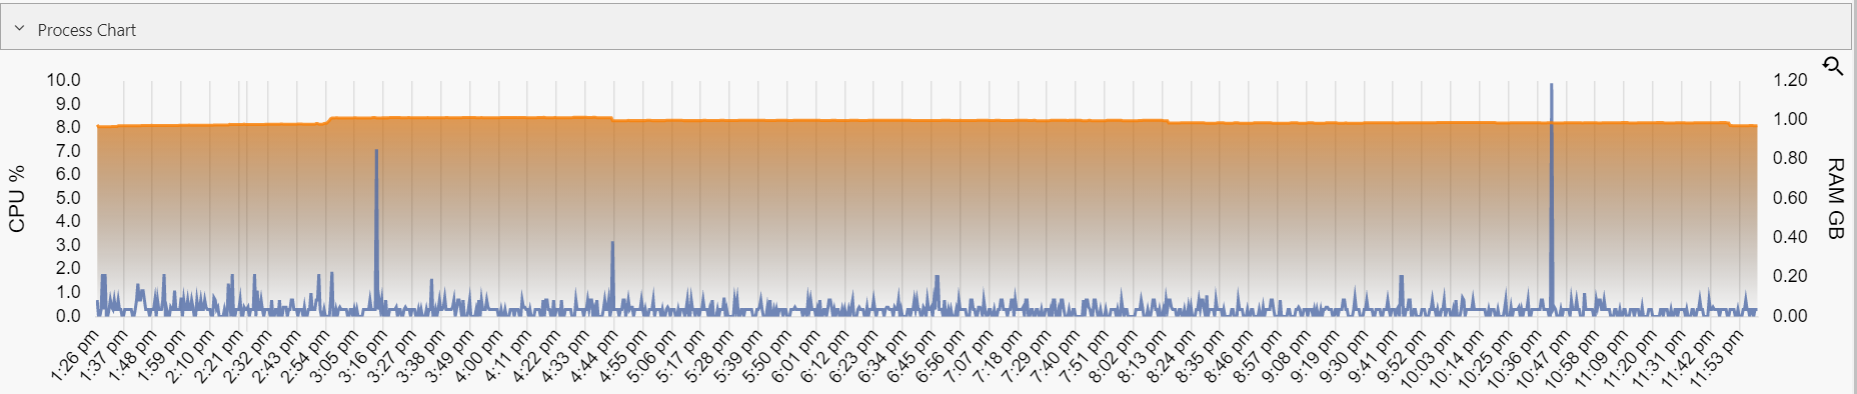
Process Chart is CPU and Memory time series for selected date, server and pid
Process list
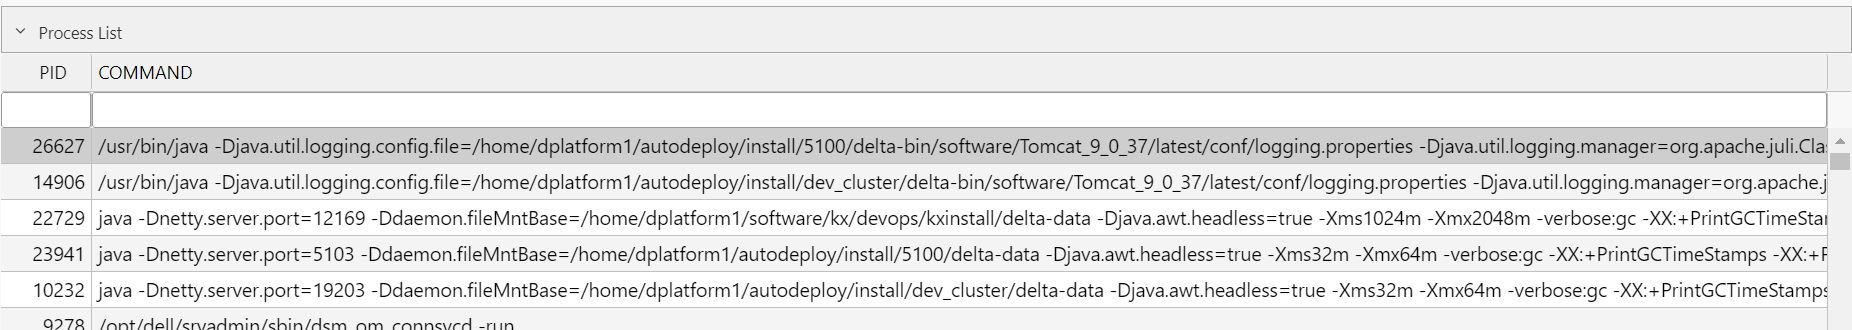
Process List shows processes running on selected date and server. Click row to update Process Chart.