Log scraping
Log Scraping is a SysMon collector which tails log files looking for specific messages.
Configuration
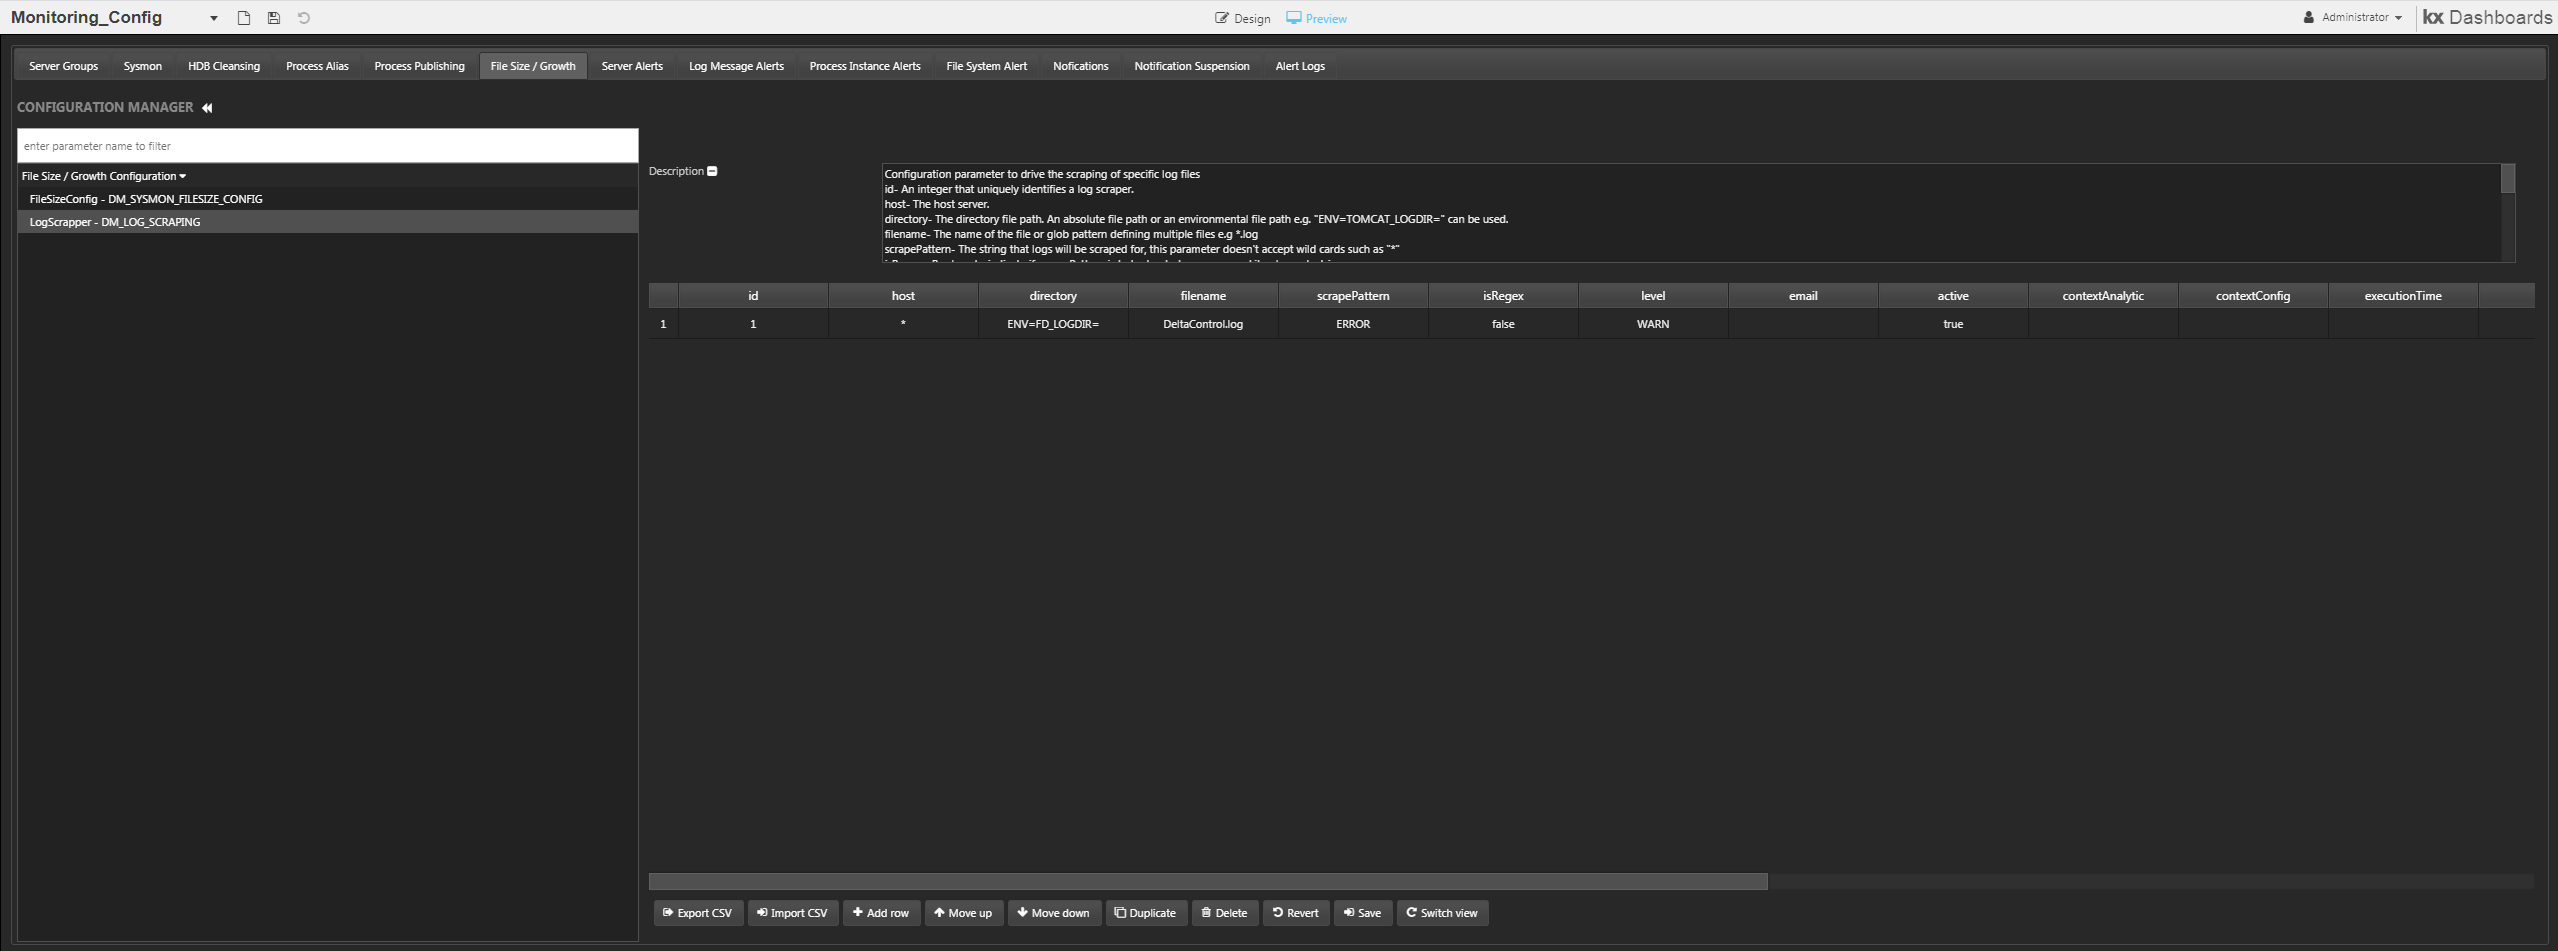
Log scraping is configured on the Monitor_Config dashboard, in the File Size/Growth Configuration tab, the DM_LOG_SCRAPING parameter. Specify Host, Directory, File and Scrape Pattern.
 Log Scraper configuration
To add a new configuration you simply click the add row button.
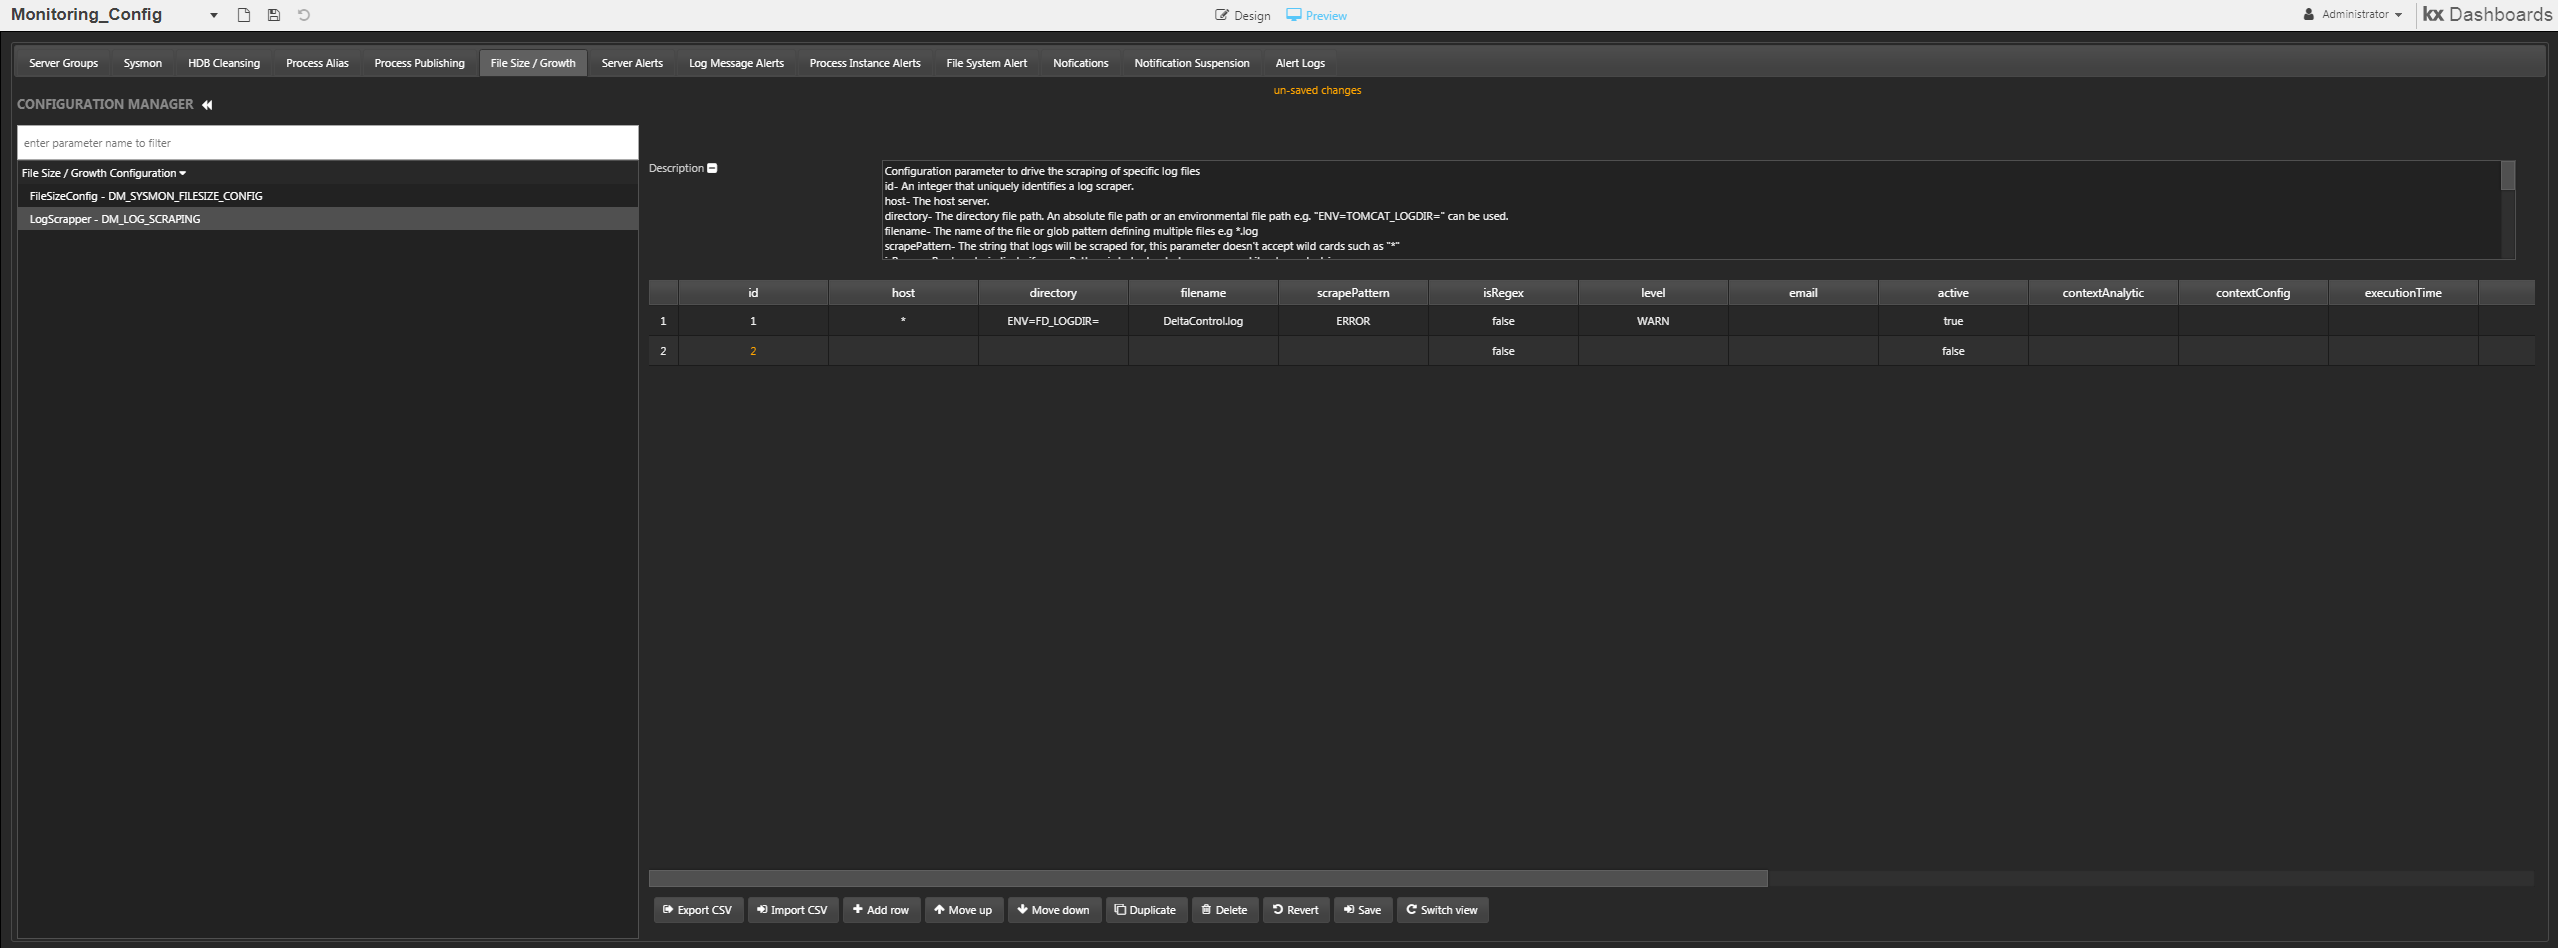 Log Scraper configuration using the HTML5 Monitoring_Config dashboard
Specify the Log Scraper Entry details as described in the following table:

Log Scraper Entry
| control | effect | wildcard |
|---|---|---|
| ID | ID of the log scraper entry | None |
| Host | Host the logfile is located on (wildcards allowed) | * can be used in place of host name |
| Directory | Directory the log files are located in: when files are added to this directory a new listener is started and the new file will be scraped if a pattern match is detected | Can use Absolute path or an environmental filepath e.g. "ENV=TOMCATLOGDIR=" |
| File Name | Log file name | Direct file name or glob pattern to find multiple files e.g. *.log |
| Scrape Pattern | Pattern to search for | None |
| isRegex | Literal Expression or Regular Expression | None |
| Level | ERROR, INFO or WARN |
None |
| Active | Boolean value if scraper active or not | None |
| Alert Options | Fields to be filled in for context specific alerts | None |
Scrape patterns
A scrape pattern can be either a literal expression or a regular expression.
Literal expression
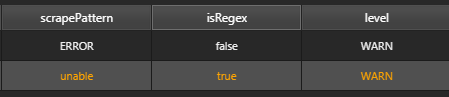
A literal expression is a string of characters to be matched. E.g when input is "unable" and the isRegex field is set to false it will search for that exact word.
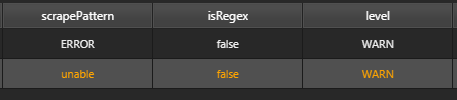
This will translate to these results in the Monitoring Dashboard, each log return has the exact word "unable" to be valid in this configuration.
Regular expression
A regular expression (regex) allows more complicated text patterns to be matched, and can allow one search to do the work of many. For example, search for the word separate and its common misspellings with regex s[ae]p[ae]r[ae]te. The Scrape Pattern Editor rejects invalid regexes.
Regex 101, Regexpal
The log scraper will check for each string specified. To use regex instead of literal expression simply set the isRegex value to true.
Alert options
Configure context-specific alerts and negative alerts.
Context-specific alerts
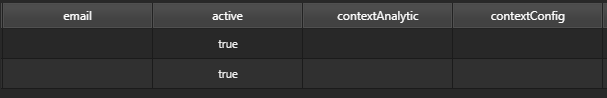
Firstly define a comma separated email list. Then Specify Content Analytic and Content Config Parameter.
| parameter | effect |
|---|---|
| Comma separated string which specifies the emails and/or distribution list | |
| contextAnalytic | Analytic to look up the context of the Alert |
| contextConfig | Associated Context Config Parameter |
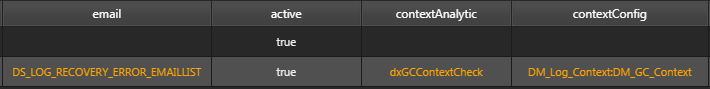 Setting a context-specific alert
Example above:
DS_LOG_RECOVERY_ERROR_EMAILLISTis the distribution listdxGCContextCheckcontext alert analytic used to check alert data for specific garbage collection use case- within the
DM_Log_Context:DM_GC_ContextcontextConfig parameter thecolValueset to 95, aDM_GC_Contextof the garbage collector value of memory in use as a percentage of total memory size, an analytic that means exceeds, and acolValueof 95, an alert is written to the log if the observed value exceeds 95%.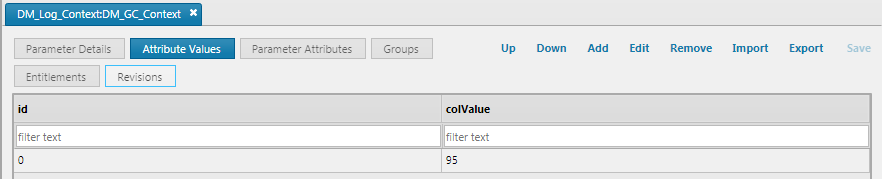
Example in KX Control:
- the configuration parameter
DM_SYSMON_CONFIG_DEFAULTattributemaxScrapersPerHostis used to specify the maximum number of log scrapers per host. An error message will be written to the log file and a warning displayed on the Log Scraper dashboard if the number of scrapers defined for the host exceeds this maximum.
Negative alerts

Negative alerting settings
Negative alerts are triggered by an absence in the log. Signify this by checking Negative Alert in the Alert Options Editor.
| parameter | effect |
|---|---|
| executionTime | time of day to make the check |
| TTL (mins) | Time To Live: the period (in mins before the Execution Time) in which the scrape pattern is sought in the logs |
| negativeID | identifier: group alerts together by giving them the same ID |
| schedule | frequency of the check: ONCE, HIGHFREQ, DAILY, WEEKLY, MONTHLY. The schedule option chosen determines further details: e.g. DAILY requires a start date and an option to exclude weekends. |
| monWeekends | boolean to check if log scraper should check for item on weekends |
| weekDay | schedule:WEEKLY, this column contains 3 letter representation of the days of the week to indicate that the event should occur every e.g. mon, tues |
| dayOfMonth | schedule:MONTHLY, this column contains an integer representing a day of the month. |
| date | schedule:ONCE, this is an exact date for the check |
| freq | schedule:HIGHFREQ to run HighFreq , this column contains a timespan representing every how many minutes the event should occur. |
| earlyNotifications | raise the alert if the scraped value appears before the TTL period |
Schedule options
| executionTime | TTL | negativeID | schedule | monWeekends | weekDay | dayOfMonth | date | freq | earlyNotifications |
|---|---|---|---|---|---|---|---|---|---|
| 01:00:00.000 | 15 | 1 | DAILY | false | |||||
| 01:00:00.000 | 15 | 2 | ONCE | false | 2020.04.23 | ||||
| 01:00:00.000 | 15 | 3 | WEEKLY | false | wed | ||||
| 01:00:00.000 | 15 | 4 | MONTHLY | false | 10 | ||||
| 01:00:00.000 | 15 | 5 | HIGHFREQ | false | 30 |
Example Daily:
 schedule:DAILY; Check occurs once a day at 01:00:00
Example Once:
 schedule:ONCE, date:2020:04:23; The exact date that the negative alert will run.
Example Weekly:
 schedule:WEEKLY, weekDay:mon; The negative alert will be ran weekly on Monday.
Example Monthly:
 schedule:MONTHLY, dayOfMonth:10; The negative alert will be ran on the 10th of each month.
Example HighFreq:
 schedule:HIGHFREQ, freq:30; The negative alert will be ran every 30 minutes.
Log scraper dashboard
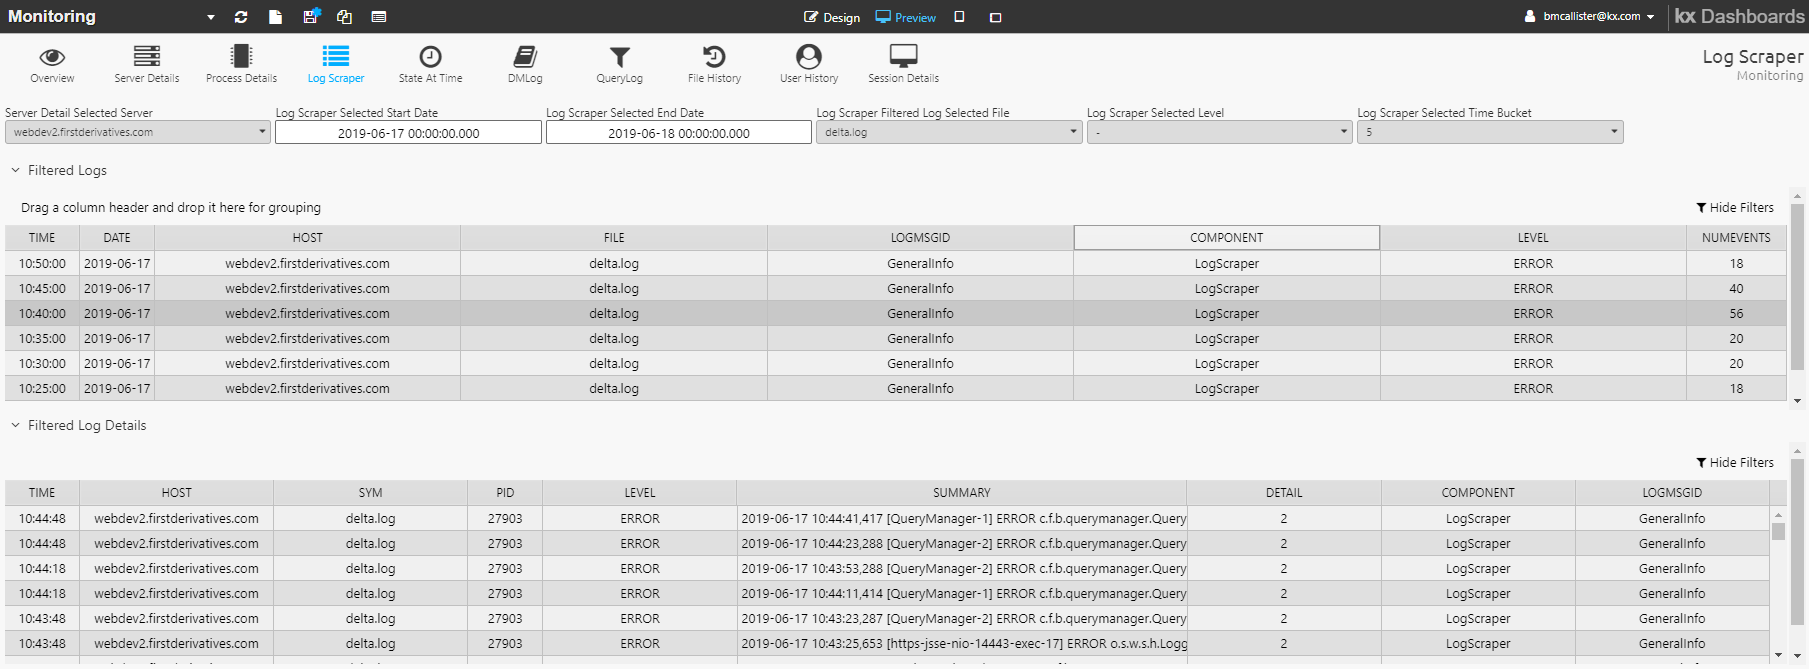
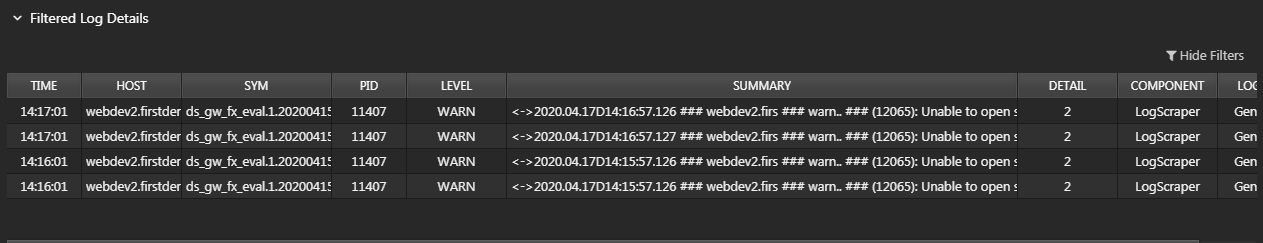
The KX Monitoring - Log Scraper tab provides a view of all scraped logging information.
Filter the display based on Start Date, End Date, Host, File, Level (INFO, WARN, ERROR, ALL) and Time Bucket. On Submit, the Filtered Logs table is updated.
Double-click on an item in the Filtered Logs table to populate the Filtered Log Details table.