Server details
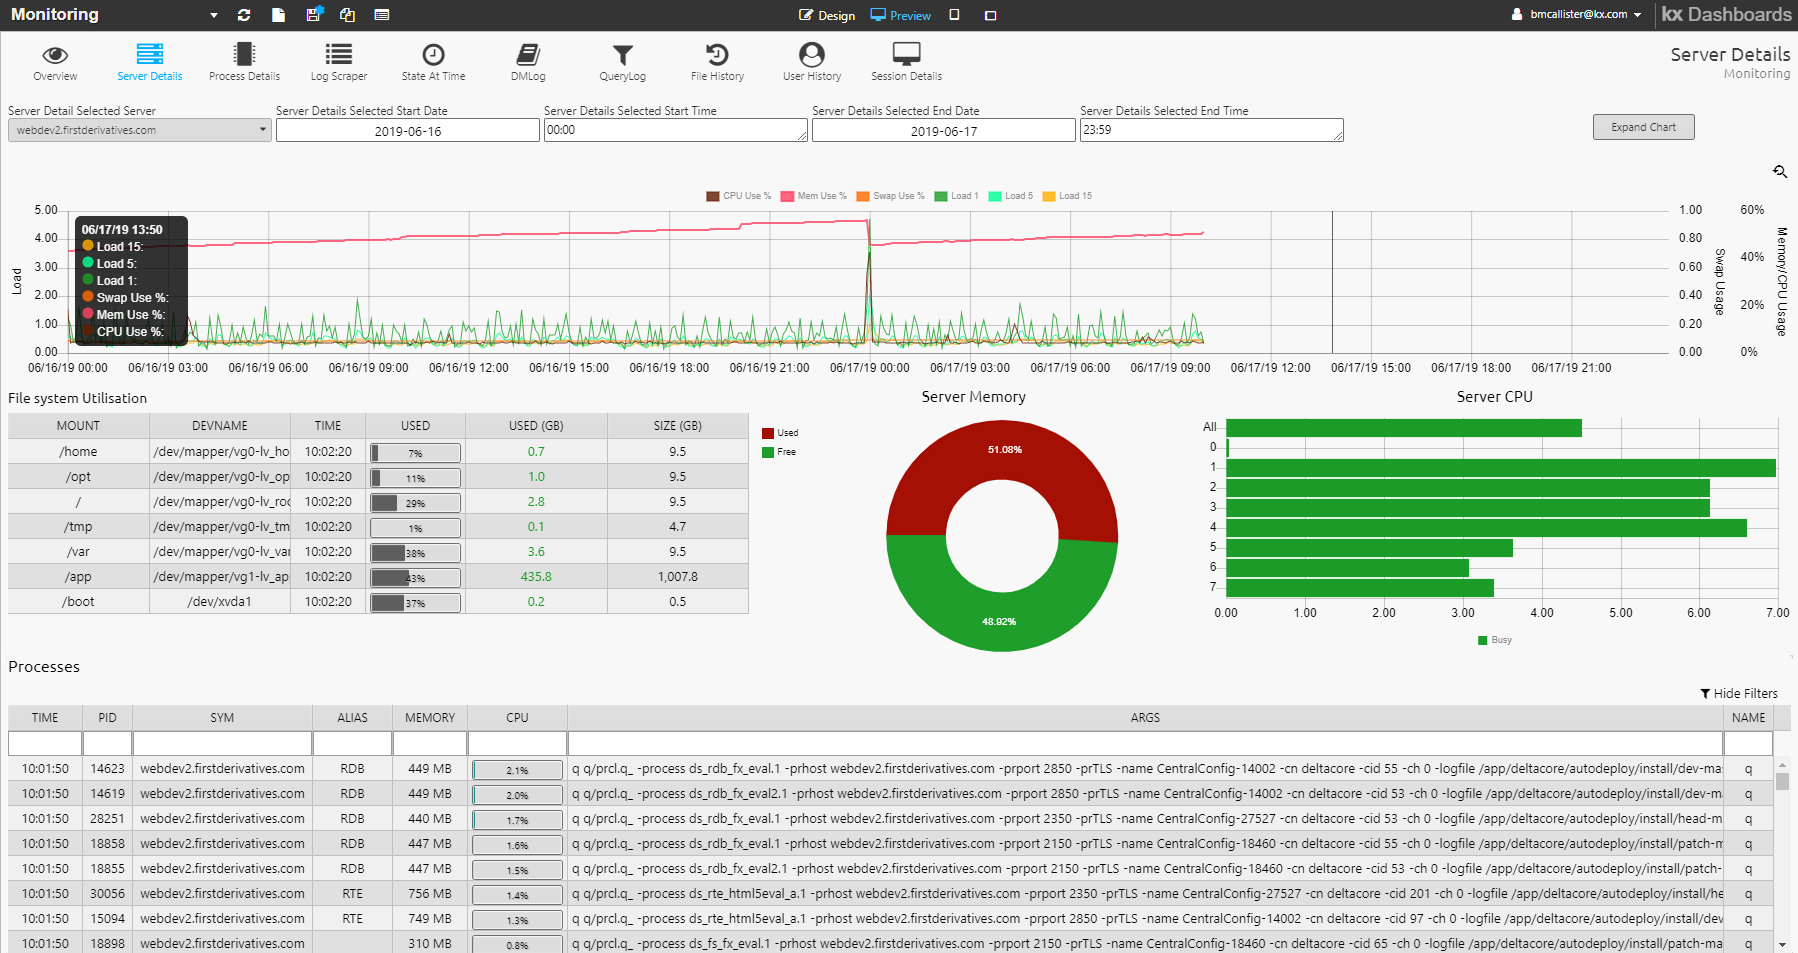
On the Monitoring dashboard the Server Details tab provides tools for the investigation of problems with a server, specifically with regard to CPU usage, memory usage and network cards.
Server details
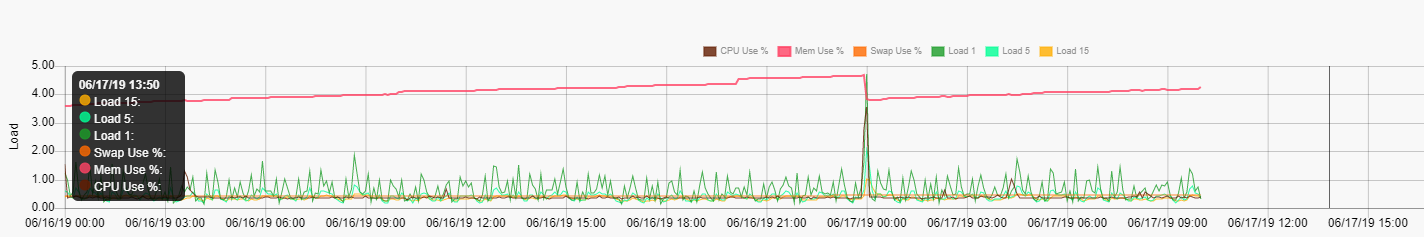
This panel displays a historic, time-bucketed chart of the total CPU, memory, load and individual CPU usage figures for a selected server.
Information displayed on the graph is determined by the Server Detail Parameters. Hover the mouse over a point in the graph to display information about the graph.
Server memory
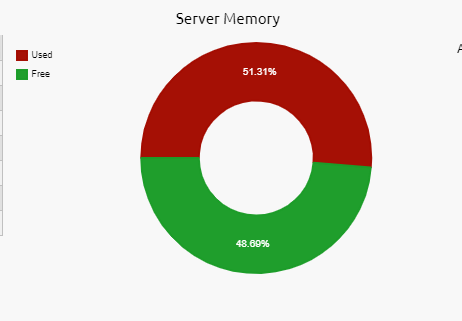
This shows the percentage used and free memory on the selected server.
Server CPU
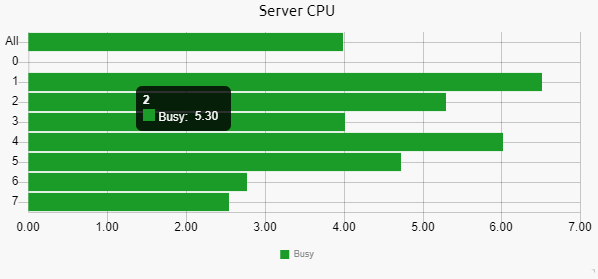
This chart displays how busy each core is on the selected server: percentage values are shown.
File system utilisation
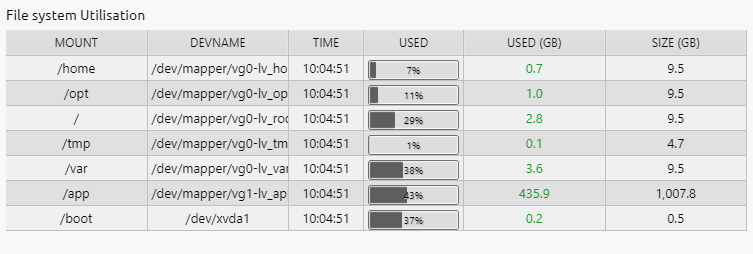
This table shows the percentage and Gb values used for the directories displayed.