Monitoring configuration
Monitor_Config dashboard allows the user to setup and config what KX Monitoring will monitor and alert on.
Monitoring config
| Tab | Description |
|---|---|
| Server Groups | Group servers into logical groups |
| Sysmon | Configure the Delta Daemon collection agent, SysMon |
| HDB cleansing | Define how long to keep data |
| Process alias | Configure process aliases |
| Process publishing | Enable and disable log levels within the Monitor Ops functionality |
| File Size / Growth | Configure File Size Growth and Log Scraping Alerts |
| Server Alerts | Server Load & CPU Alerts configuration |
| Log Message Alerts | Log Alert levels |
| Process Instance Alerts | Process Memory & CPU Alert settings |
| File System Alert | Disk space alerts |
| Notifications | Custom Alert notifications |
| Notification Suspension | Custom Alert suspension configuration |
| Alert Logs | Alert logs |
Server groups
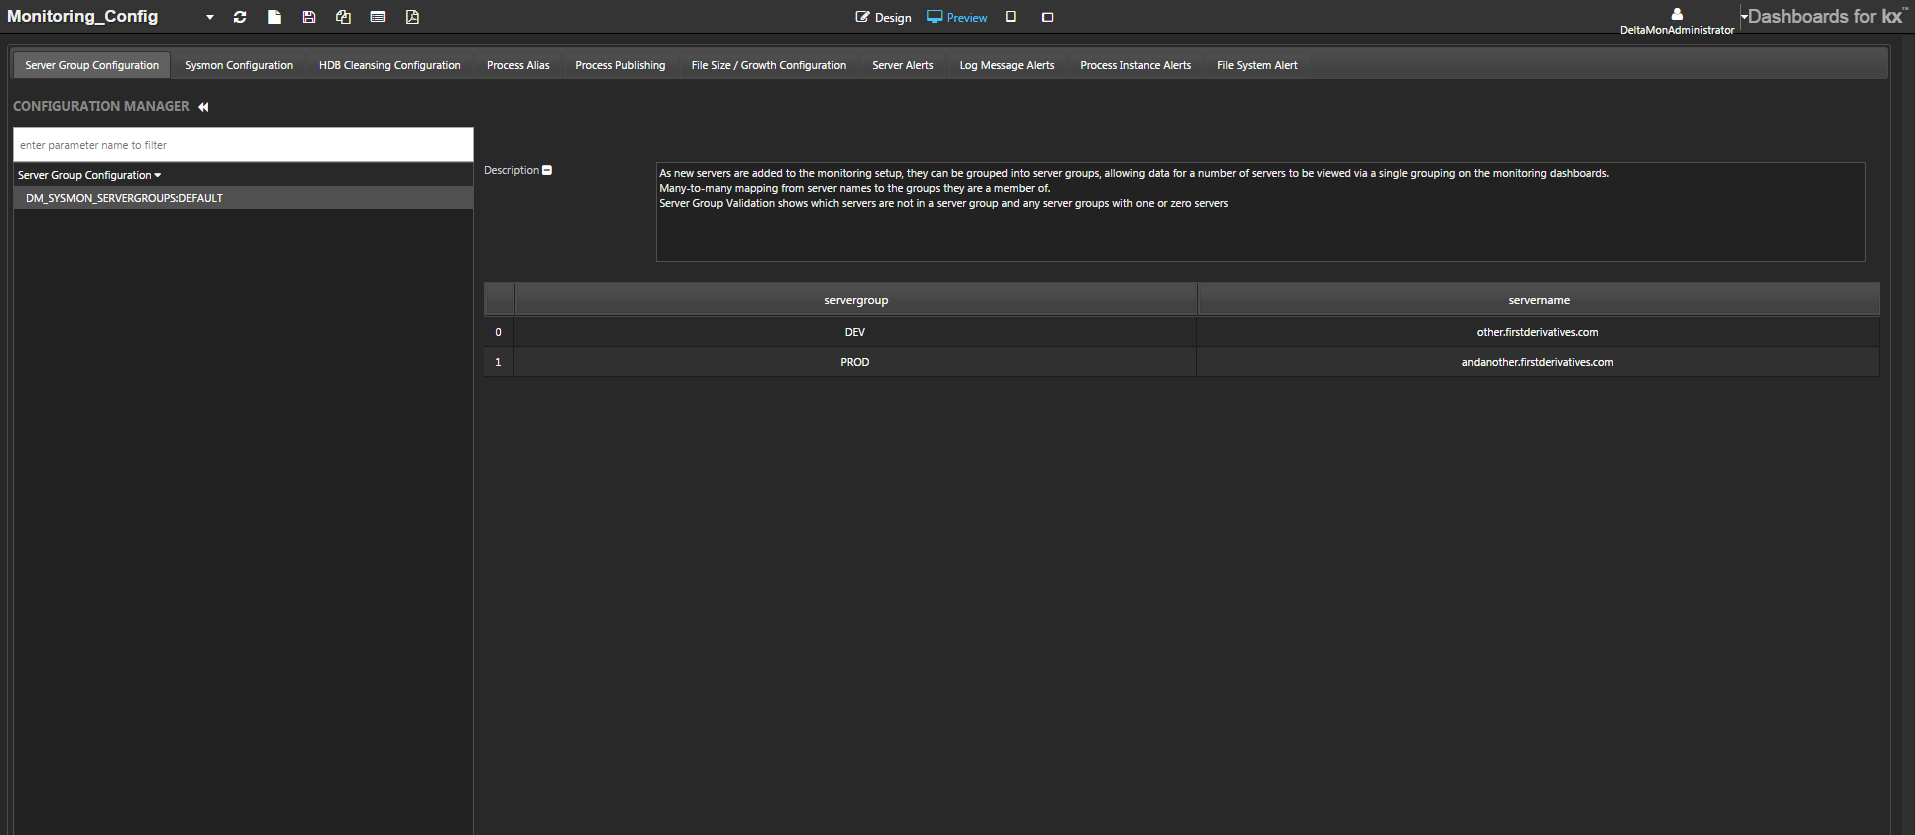
Associate servers in logical groups e.g. Dev, UAT, Prod. Within the main Monitoring dashboard,you can then filter by these specific groups. For example, to filter State At Time by Host Group, see Process CPU Memory League Table.
These groups will be available within the Monitoring dashboard to display data at a server level, or grouped across servers in a selected group.
To add a server to the group: click the plus button to insert a new row in the table; enter the server name and server-group details; click the Save button.
To remove a server: click on the server to be removed; click the Delete button; click the Save button.
Sysmon
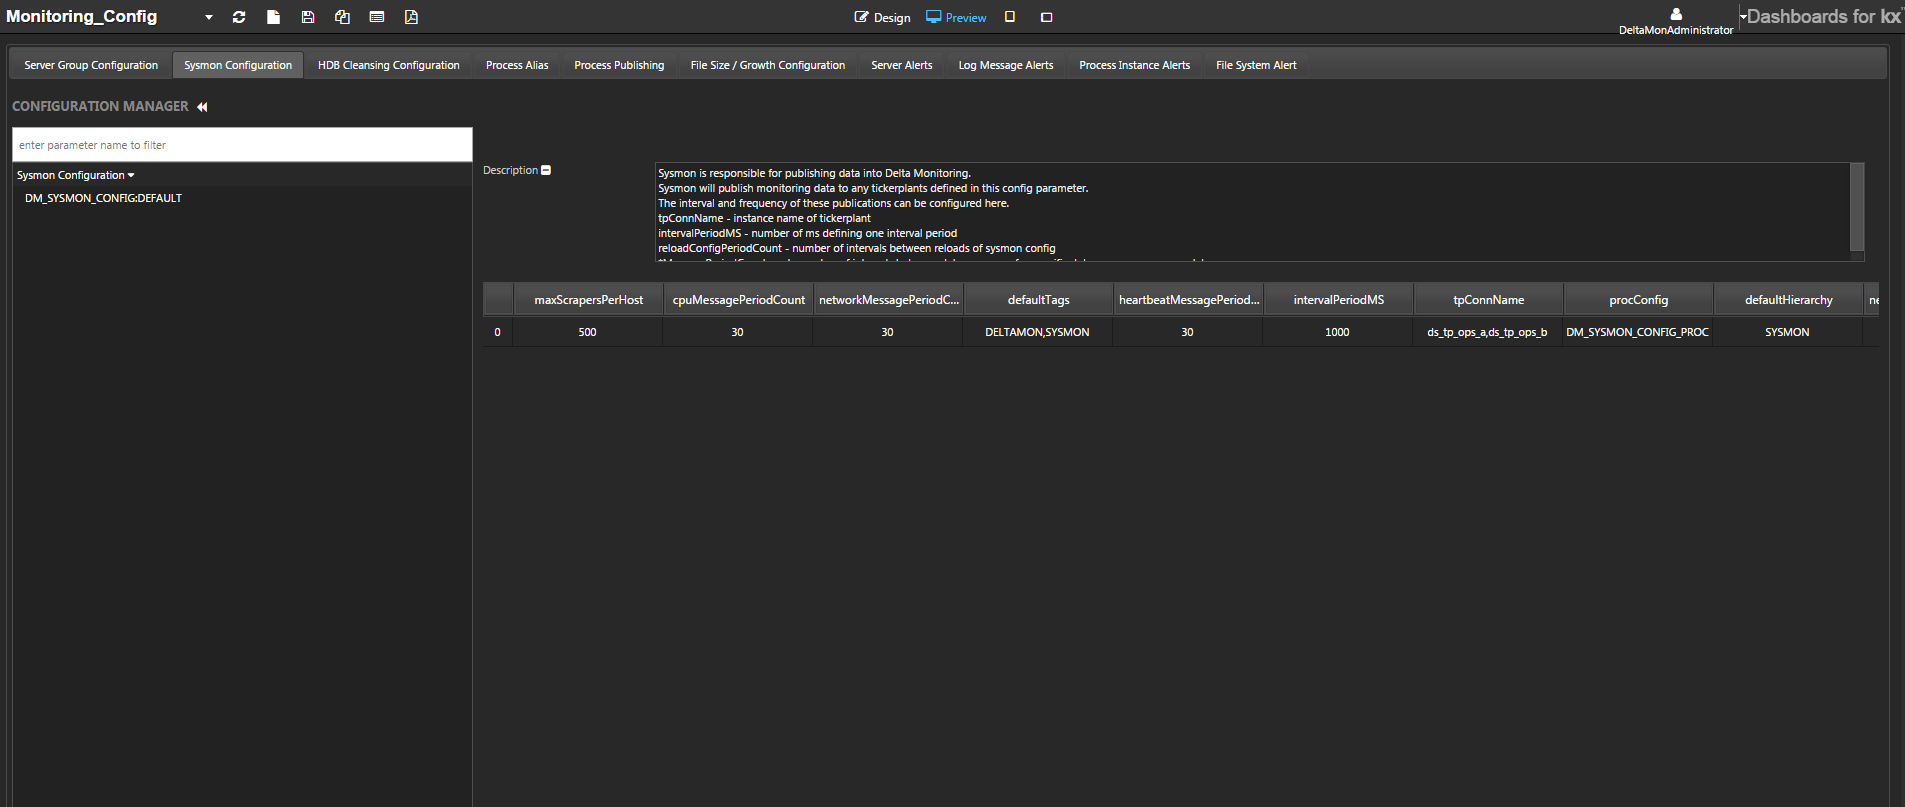
Use this tab to configure the Delta Daemon collection agent, SysMon. Each row contains information about the data that the collection agent will publish to each ops tickerplant (TP). The collection agent should be configured to publish the collected data to 2 TPs for failover.
With the exception of this configuration parameter, all configuration updates are pushed automatically in real time to all Delta Daemon SysMon collection agents. Updates to this configuration will require a restart of the Daemon SysMon collection agents.
| parameter | use |
|---|---|
| cpuMessagePeriodCount | How often to send a message to the dmxsysCPU schema |
| networkMessagePeriodCount | How often to send a message to the dmxsysNIC schema |
| defaultTags | Tags to set on signal registrations. For example DELTAMON, SYSMON |
| heartbeatMessagePeriodCount | How often to send a heartbeat message |
| intervalPeriodMS | Minimum polling interval, specified in milliseconds; defaults to 1000 |
| tpConnName | Name of the tickerplant to connect to. e.g. ts_tp_ops_a |
| procConfig | Name of the configuration to use to load the process (PID) filters. Defaults to DM_SYSMON_CONFIG_PROC |
| defaultHierarchy | Hierarchy to set on signal registrations, e.g. SYSMON |
| netConnectionMessagePeriodCount | How often to send a message to dmxsysNetConn schema |
| systemMessagePeriodCount | How often to send a message to the dmxsysServer schema |
| procMessagePeriodCount | How often to send a message to the dmxsysFileSystem schema |
| reloadConfigPeriodCount | How often to reload the configuration, specified in milliseconds |
| diskMessagePeriodCount | How often to send a message to the dmxsysFileSystem schema |
| diskLocalOnly | Gathering file system data on only local disks |
| monAgent | Monitoring agent to use for system monitoring. OSHI and Sigar available as options. |
Monitoring agent
Previously SIGAR has been used as the monitoring agent to gather system information, however the SIGAR library has not been actively maintained since 2010. Because of this, SIGAR has been known to have issues with recent Operating System and JAVA versions.
Sysmon now uses the OSHI library as the default monitoring agent, with the configurable option to continue using SIGAR within the Sysmon configuration parameter.
The OSHI system monitoring agent provides a near one-to-one match with what SIGAR originally provided.
Known gaps in OSHI:
* dmxsysNIC - Network interface overruns and Frame statistics unavailable.
* dmxsysPID - Identification of processor and some processor specific statistics unavailable.
* dmxsysStatCPU - CPU cache unavailable
HDB cleansing
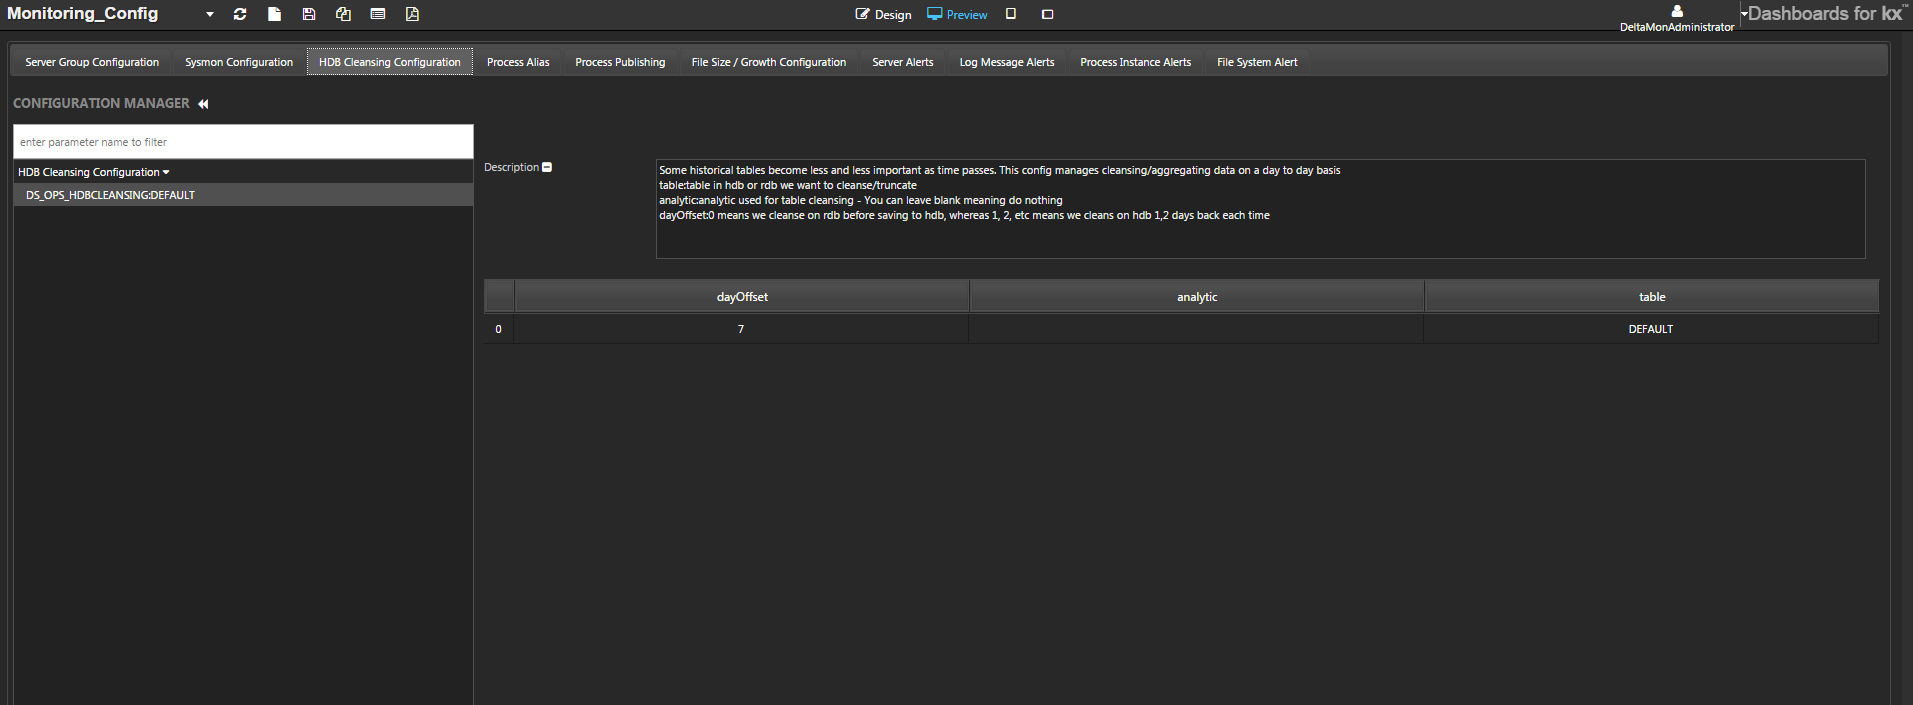
Use this tab to specify how long to keep data. This information is used by the ds_hdbcleanse_ops_a/b process instances. Cleansing replaces ops data with an aggregated version of the original. Duplicate entries may be removed and a count based on the process instance and log message added to the summary field.
| parameter | use |
|---|---|
| dayOffset | The age in days at which the data is cleansed. For example, if set to 7, data partitions older than 7 days will be cleansed. |
| analytic | Analytic to use when cleansing HDB, e.g. dOpHDBCleanse_dxLog. |
| table | Name of the table to be cleansed, e.g dxLog. The first entry in the table column is the DEFAULT setting for all tables. Override these default settings by adding individual tables – click the plus button at the end of the table. |
Process alias
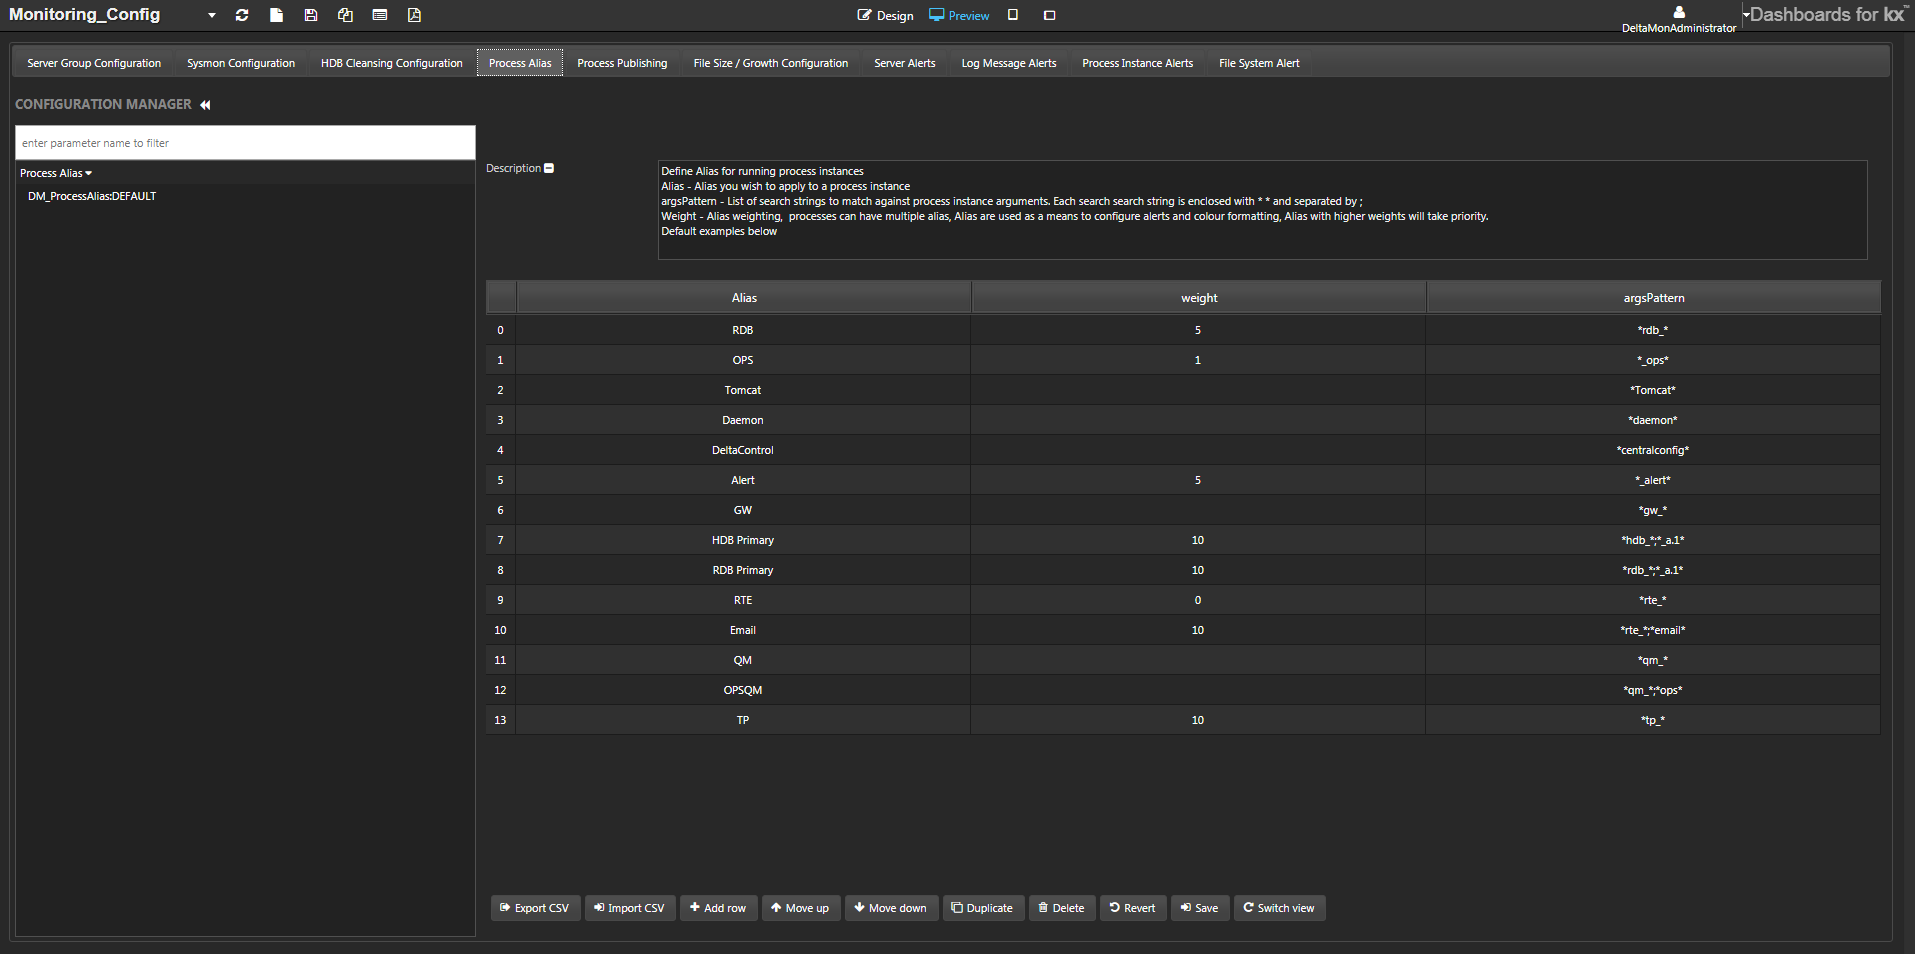
Use this tab to define aliases for running process instances. These aliases are used in other areas of Monitoring, for example the Alias filter field on the Process CPU Memory League table.
To add a new alias click the Add row button at the bottom of the screen and edit the row.
| attribute | use |
|---|---|
| Alias | alias to apply to a process instance. |
| weight | alias weighting. Aliases are used to configure alerts and color formatting. Because processes can have multiple aliases, it is necessary to assign weights to the aliases so that aliases with higher weights take priority. |
| argsPattern | search strings to match against process-instance arguments. Enclose each search string with asterisks; separate them with semicolons e.g. *foo*;*bar*. |
Process publishing
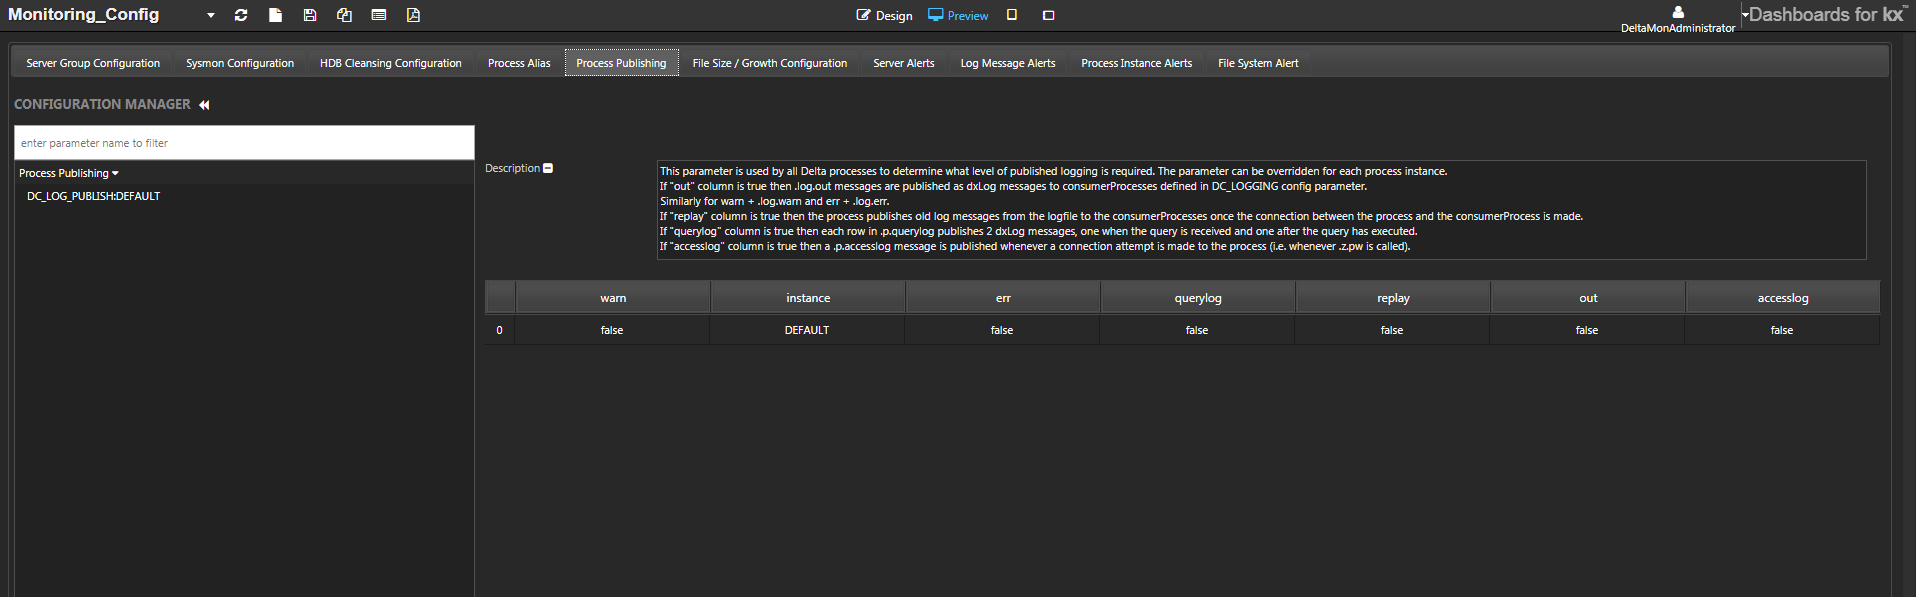
Use this tab to enable and disable log levels within the Monitor Ops functionality. For example in State At Time, Process CPU Memory League table. By default these are disabled, in which case no information is logged.
Amendments made here are stored in the DC_LOG_PUBLISH configuration parameter.
Toggle process publishing
In the Process Publishing tab, set the log levels to be viewed in the Monitoring dashboard.
Use the DEFAULT process settings, which specify the publishing levels for all processes, or add rows for individual processes and set the process publishing requirements for each process.
Set publishing requirements to either true or false. The options are:
| option | true means |
|---|---|
| Out | all .log.out messages are sent to the ops workflow and recorded in dxLog. This provides general logging information. |
| Warn | all .log.warn messages are sent to the ops workflow and recorded in dxLog. This provides for warning message logging. |
| Err | all .log.err messages are sent to the ops workflow and recorded in dxLog. This provides error message logging. |
| Replay | all log replay messages get sent to the ops workflow. |
| QueryLog | all queries made get sent to the ops workflow and recorded in dxQueryLog. |
| AccessLog | all attempts to access processes get sent to the ops workflow and recorded in dxAccessLog. |
Once the publishing option for a process is set, click the Save button.
Manage default process settings
The DEFAULT instance entry in the table defines behavior for any process not specified in the table.
- Add a row with instance set to
DEFAULT, or edit the table row if it exists. - Set your publishing requirements to either
trueorfalsefor each of the publishing options. - Click Save to save your changes.
Default logging behavior
Increasing the logging on the default process can cause a large spike in data collection, requiring additional disk space to store this data.
Remove a process from the publishing list
Click Delete on a highlighted row to remove a selected process from the table. Its behavior will then be defined by the DEFAULT settings.
File size and growth
FileSizeConfig
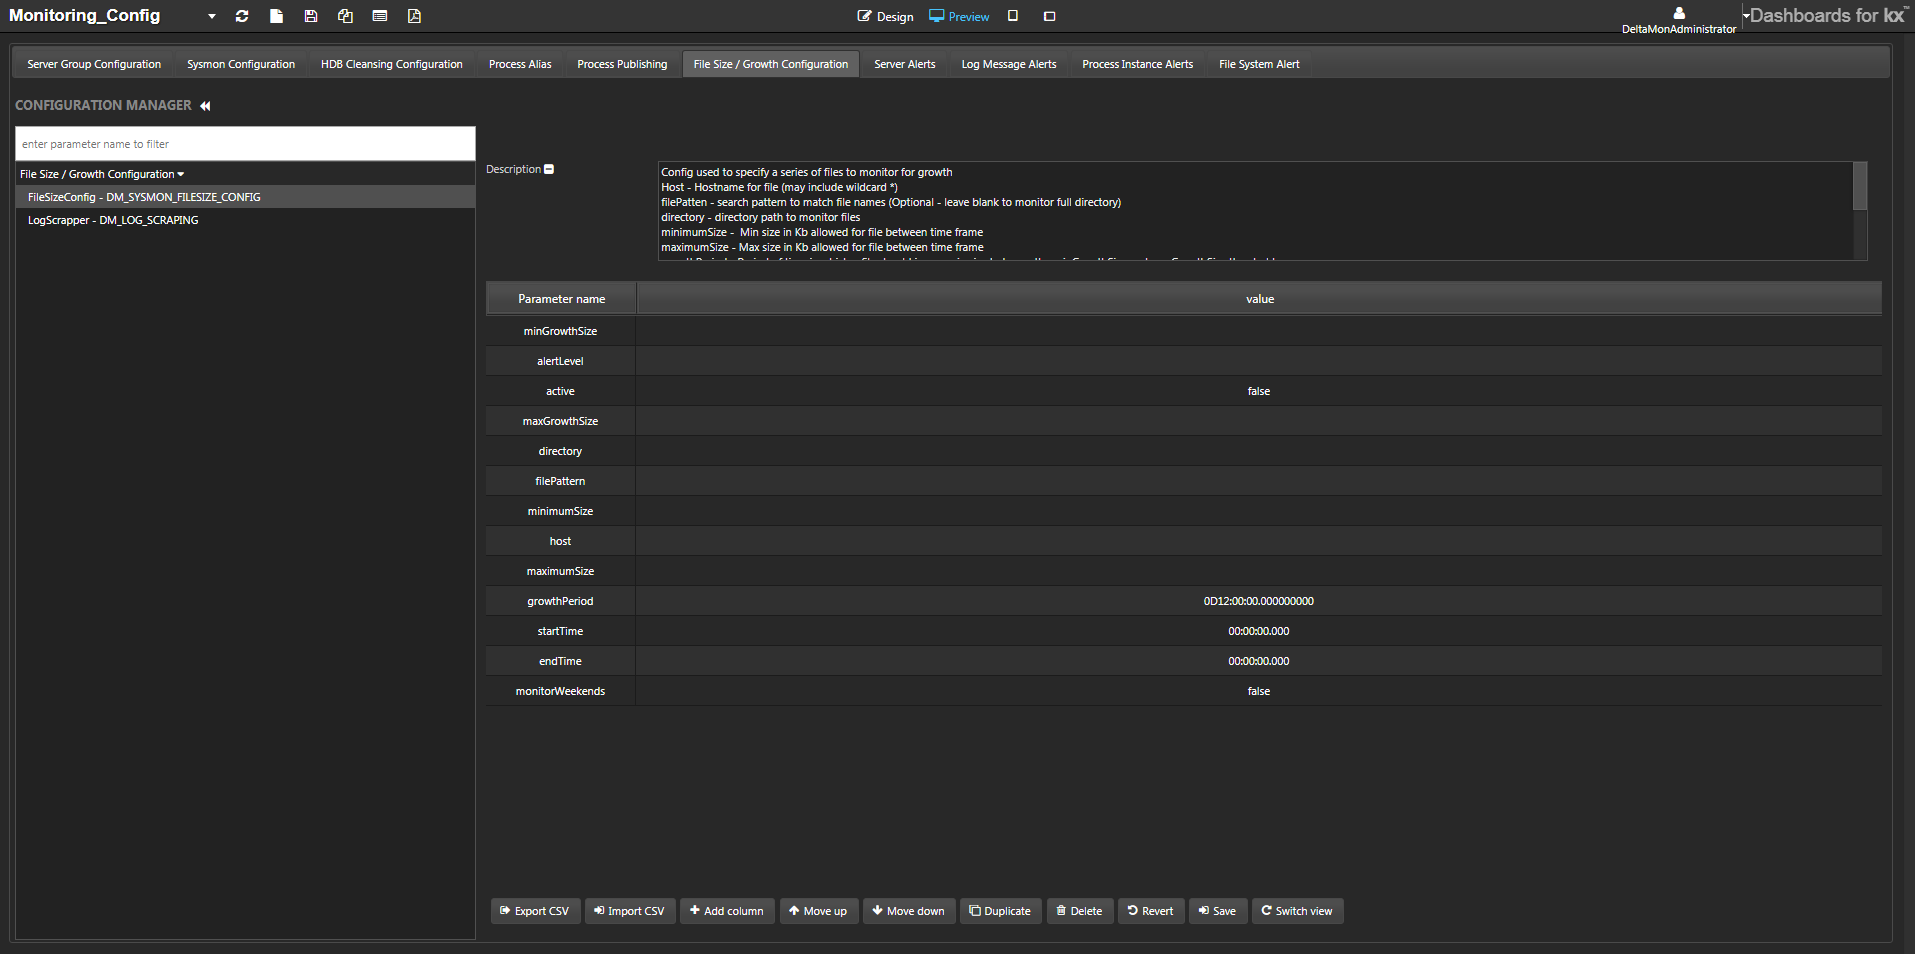
Through the File Size / Growth Configuration tab of the Monitoring_Config dashboard specify the minimum, maximum, and growth size of files and directories to be monitored.
To add a new file to be monitored, edit the details described in the table, then click Save.
| parameter | controls |
|---|---|
| minGrowthSize | min amount file should increase during growth period (Kb) |
| maxGrowthSize | max amount file should increase during growth period (Kb) |
| directory | directory path to monitor files |
| filePattern | (optional) search pattern to match file names |
| minimumSize | min size allowed for file (Kb) |
| host | hostname for file (may include wildcard *) |
| maximumSize | max size allowed for file (Kb) |
| growthPeriod | time period in which a file should grow between the minGrowthSize and maxGrowthSize limits |
| startTime/endTime | daily time frame for monitoring |
| active | boolean indicates whether file is to be monitored for growth |
| alertLevel | level to apply when breaches are made WARN/ERROR |
| monitorWeekends | boolean indicates whether file should be monitored during weekends |
LogScraper
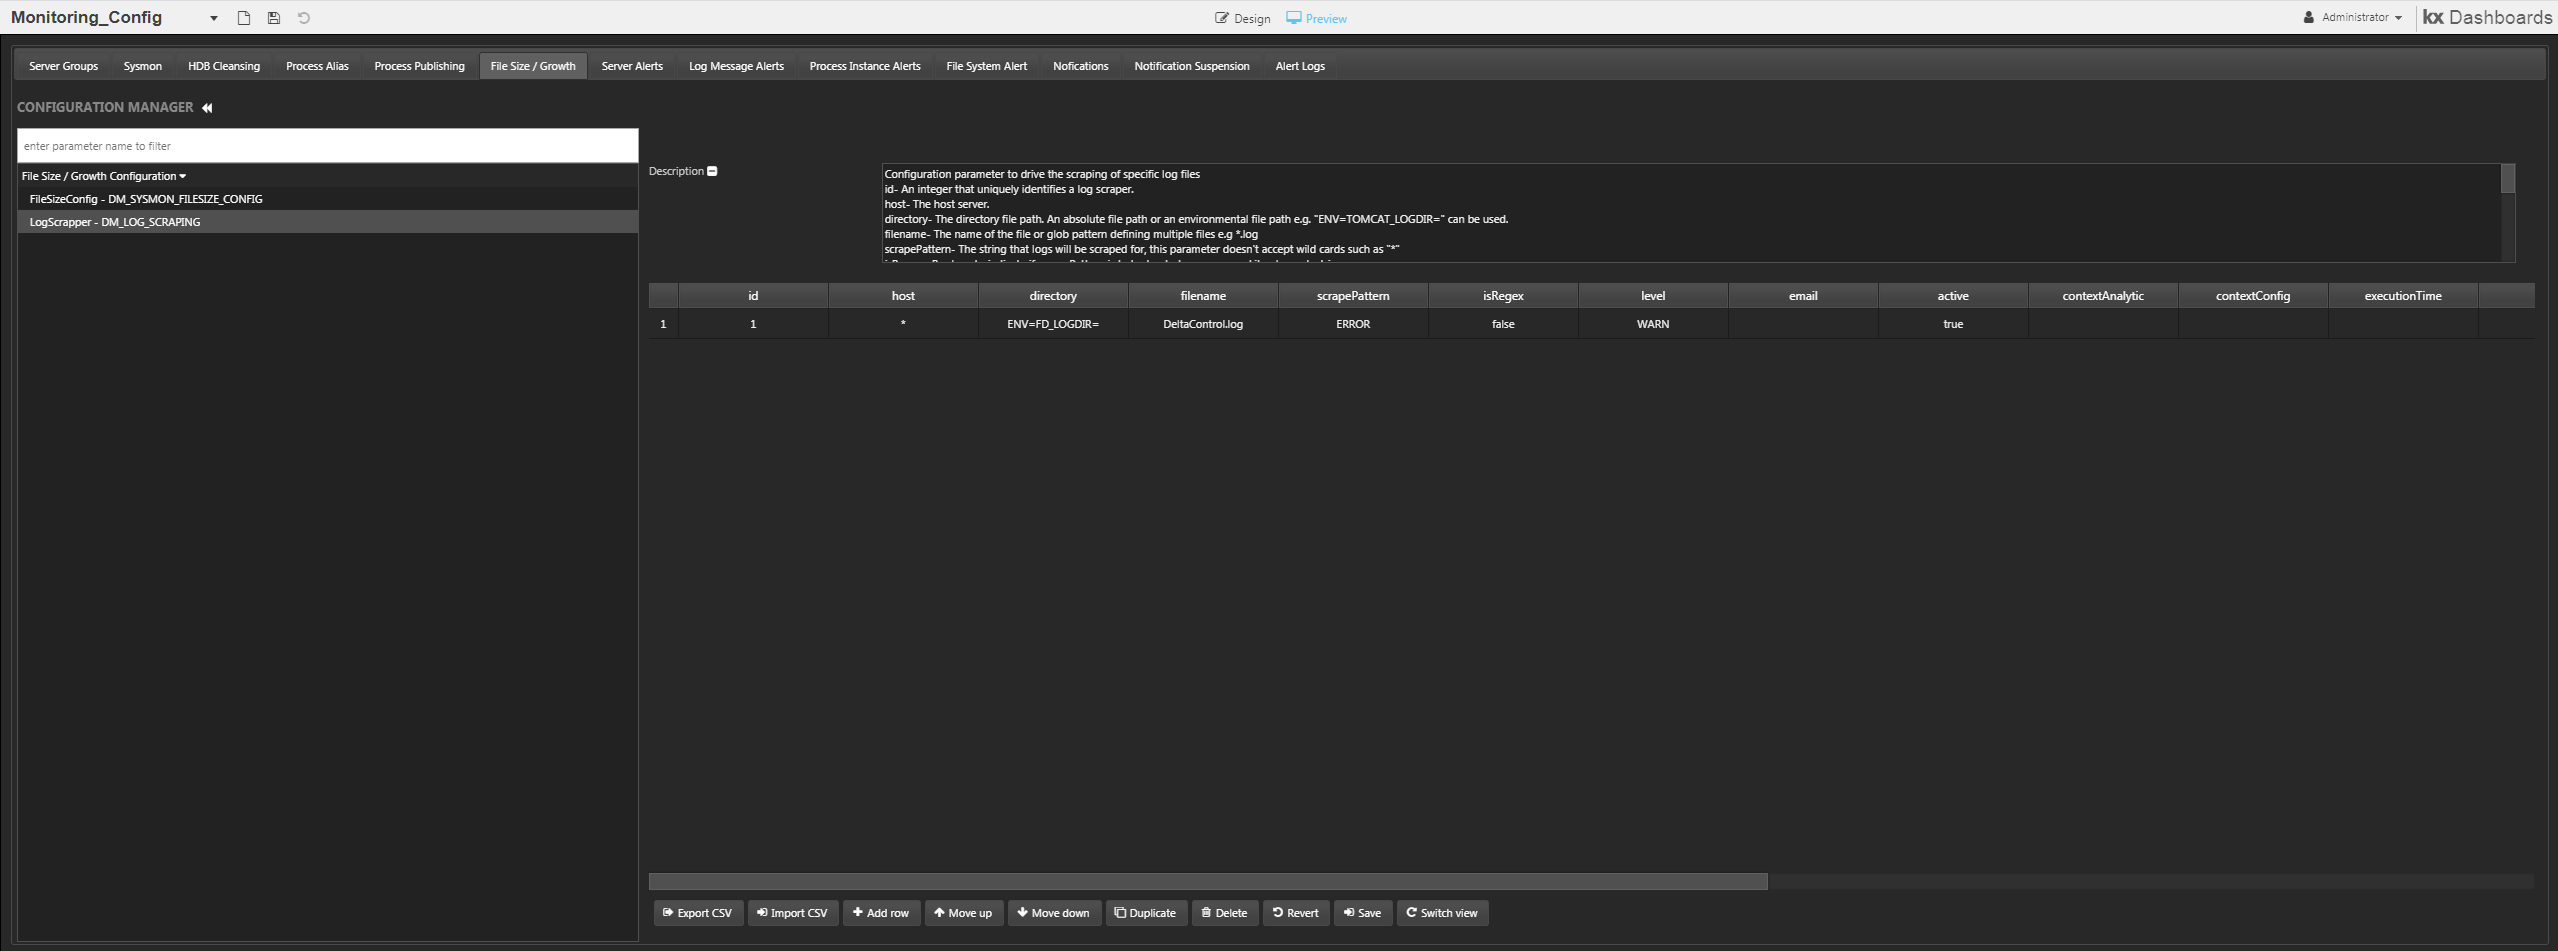 Log Scraper configuration
Log Scraper configuration dashboards. This allows the user to add and remove log scraping from any file on a monitored server. Log Scraping provides full details on how to setup complex scraping patterns.
Server alerts
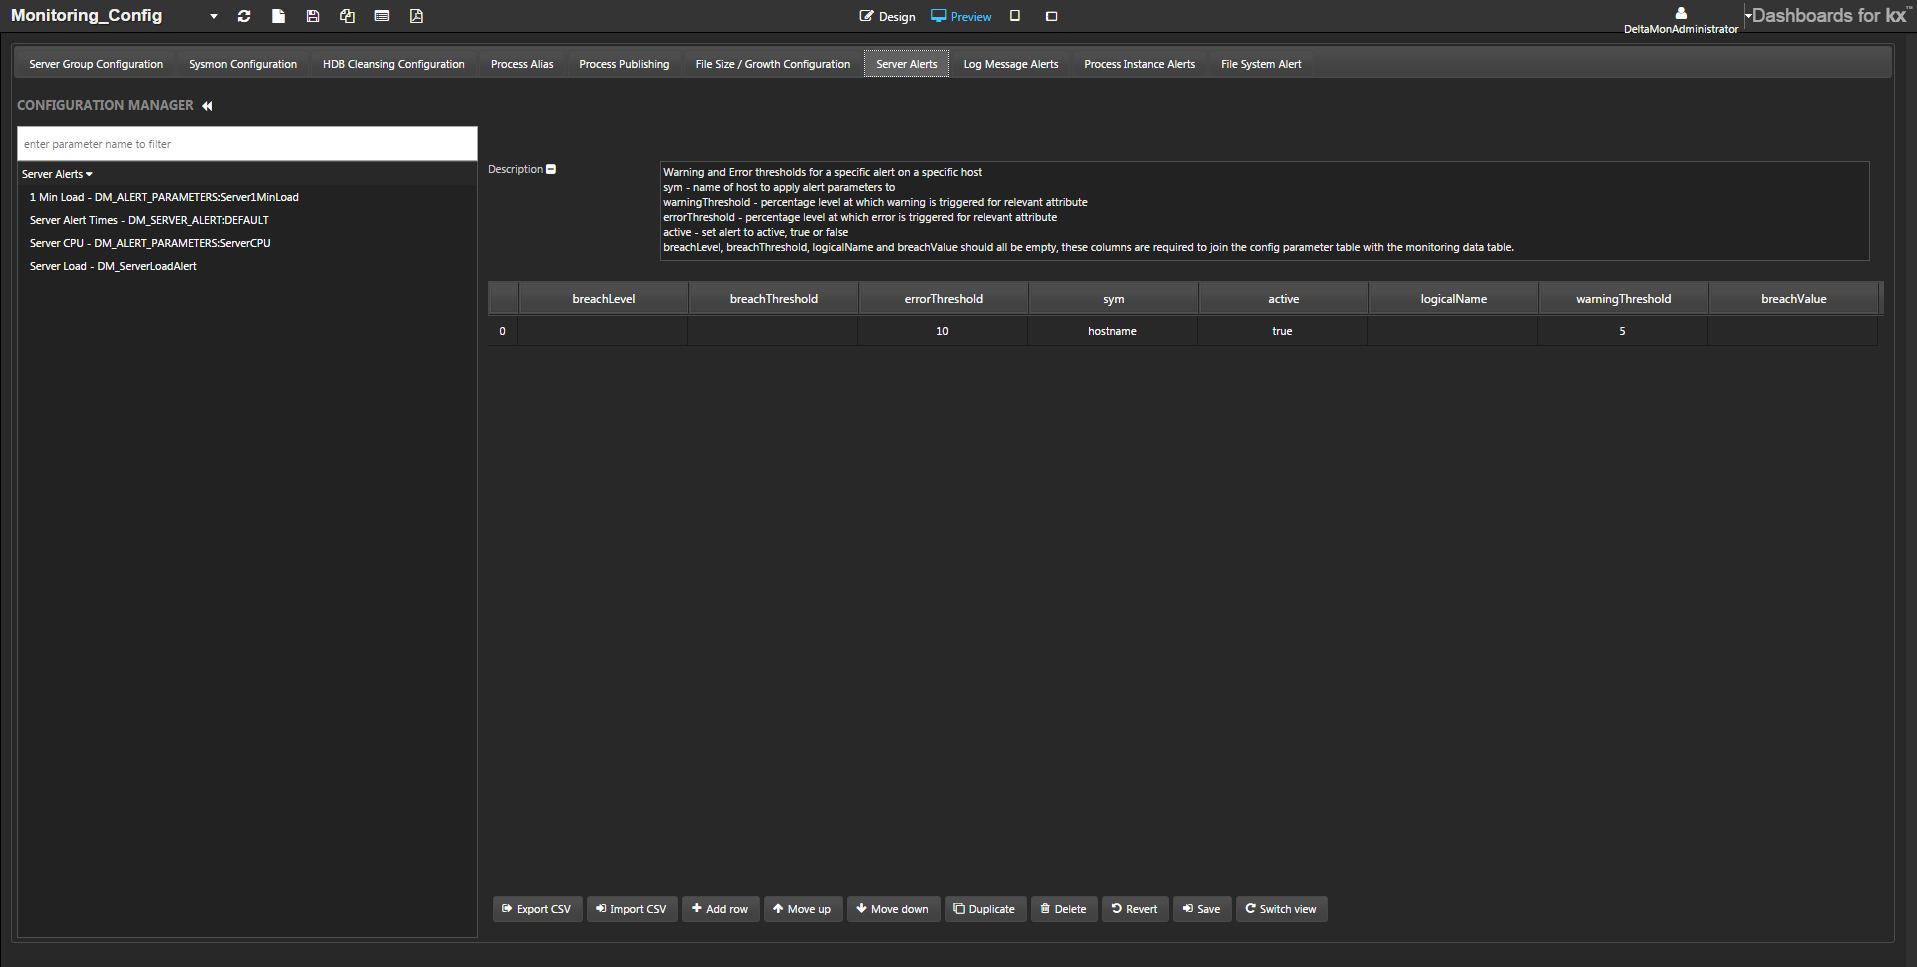 Server-specific alert configuration is configured on the Server Alerts tab
In this tab, set the following server-alert configuration parameters:
1 min load
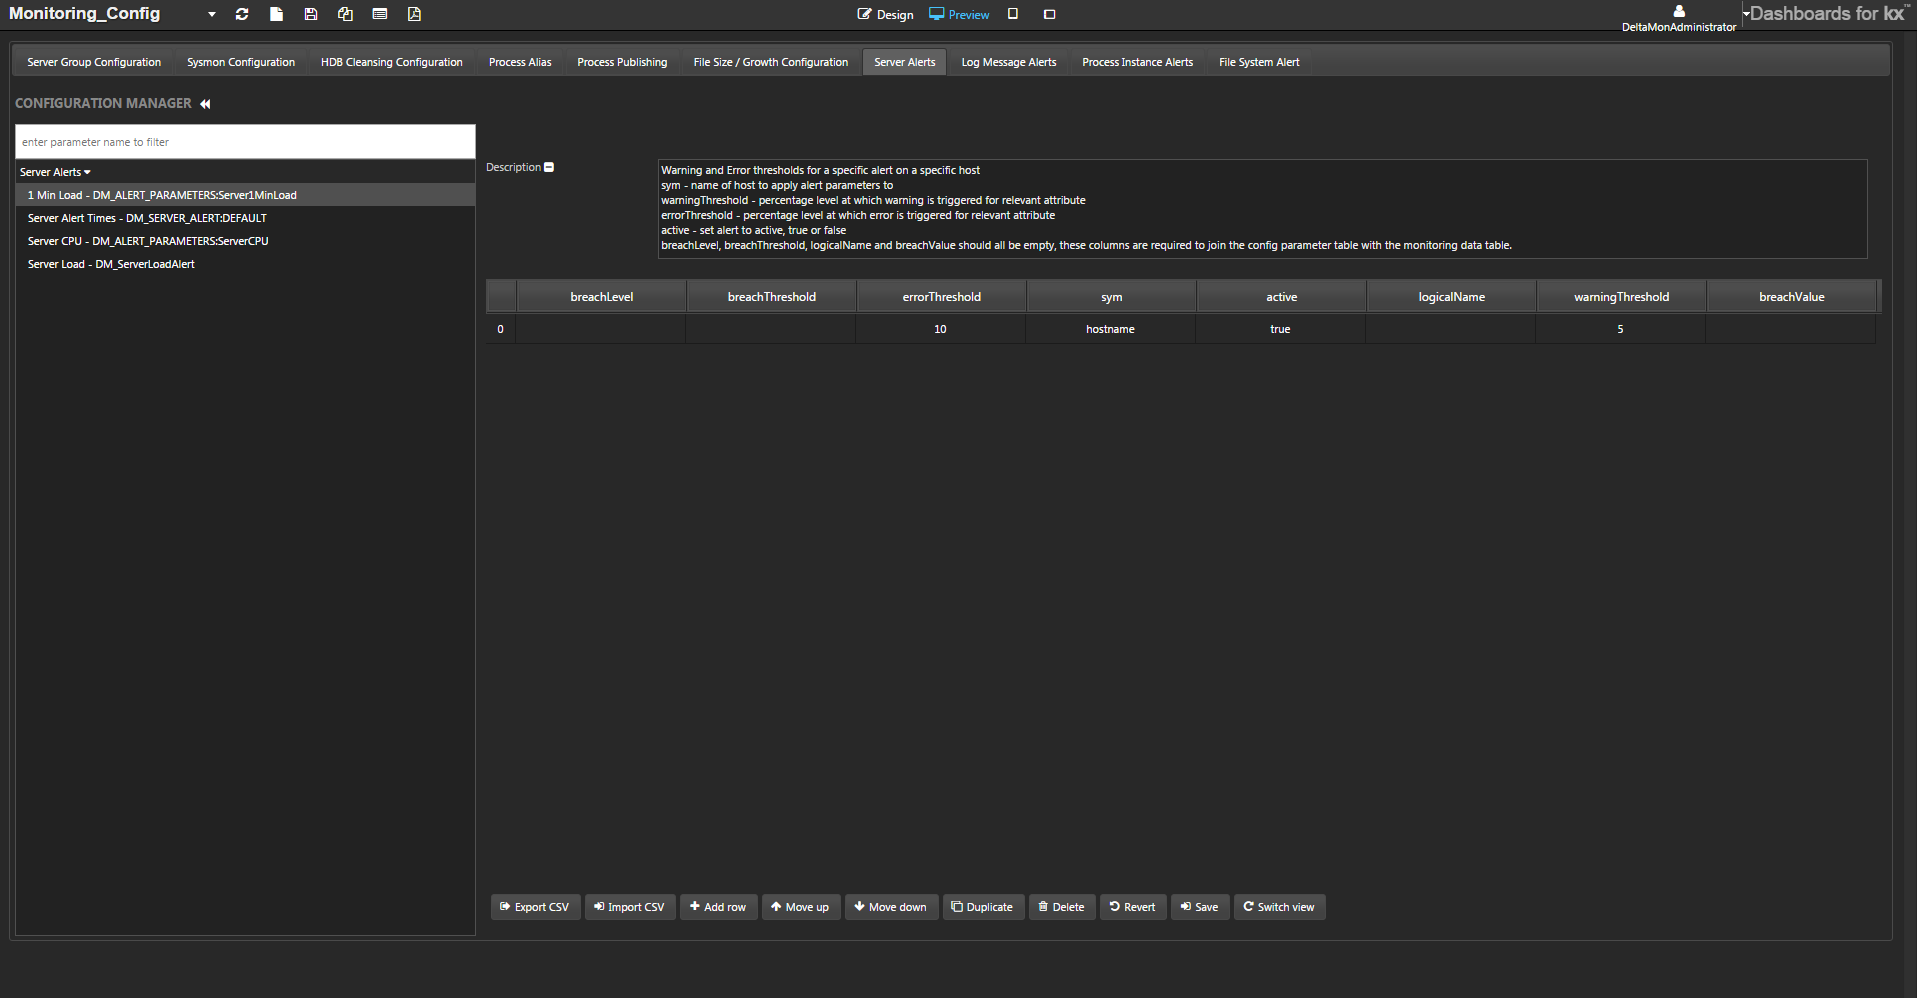
This parameter controls monitoring of the one-minute load of a server. It is used to compare against the observed one-minute load average stored within the dmxsysStateServer table by the SysMon process. Each row of the parameter represents a satellite server.
The attributes of this parameter:
| attribute | description |
|---|---|
| breachLevel | Should be left blank: populated by the alert when carrying out checks on memory usage. |
| breachThreshold | Should be left blank: populated by the alert when carrying out checks on memory usage. |
| errorThreshold | The percentage level at which an error is triggered for the relevant attribute. |
| sym | The name of the host to be monitored. |
| active | Flag: if false, Monitor ignores this parameter. |
| logicalName | Should be left blank: populated by the alert when carrying out checks on memory usage. |
| warningThreshold | The percentage level at which a warning is triggered for the relevant attribute. |
| breachValue | Should be left blank: populated by the alert when carrying out checks on memory usage. |
Server CPU
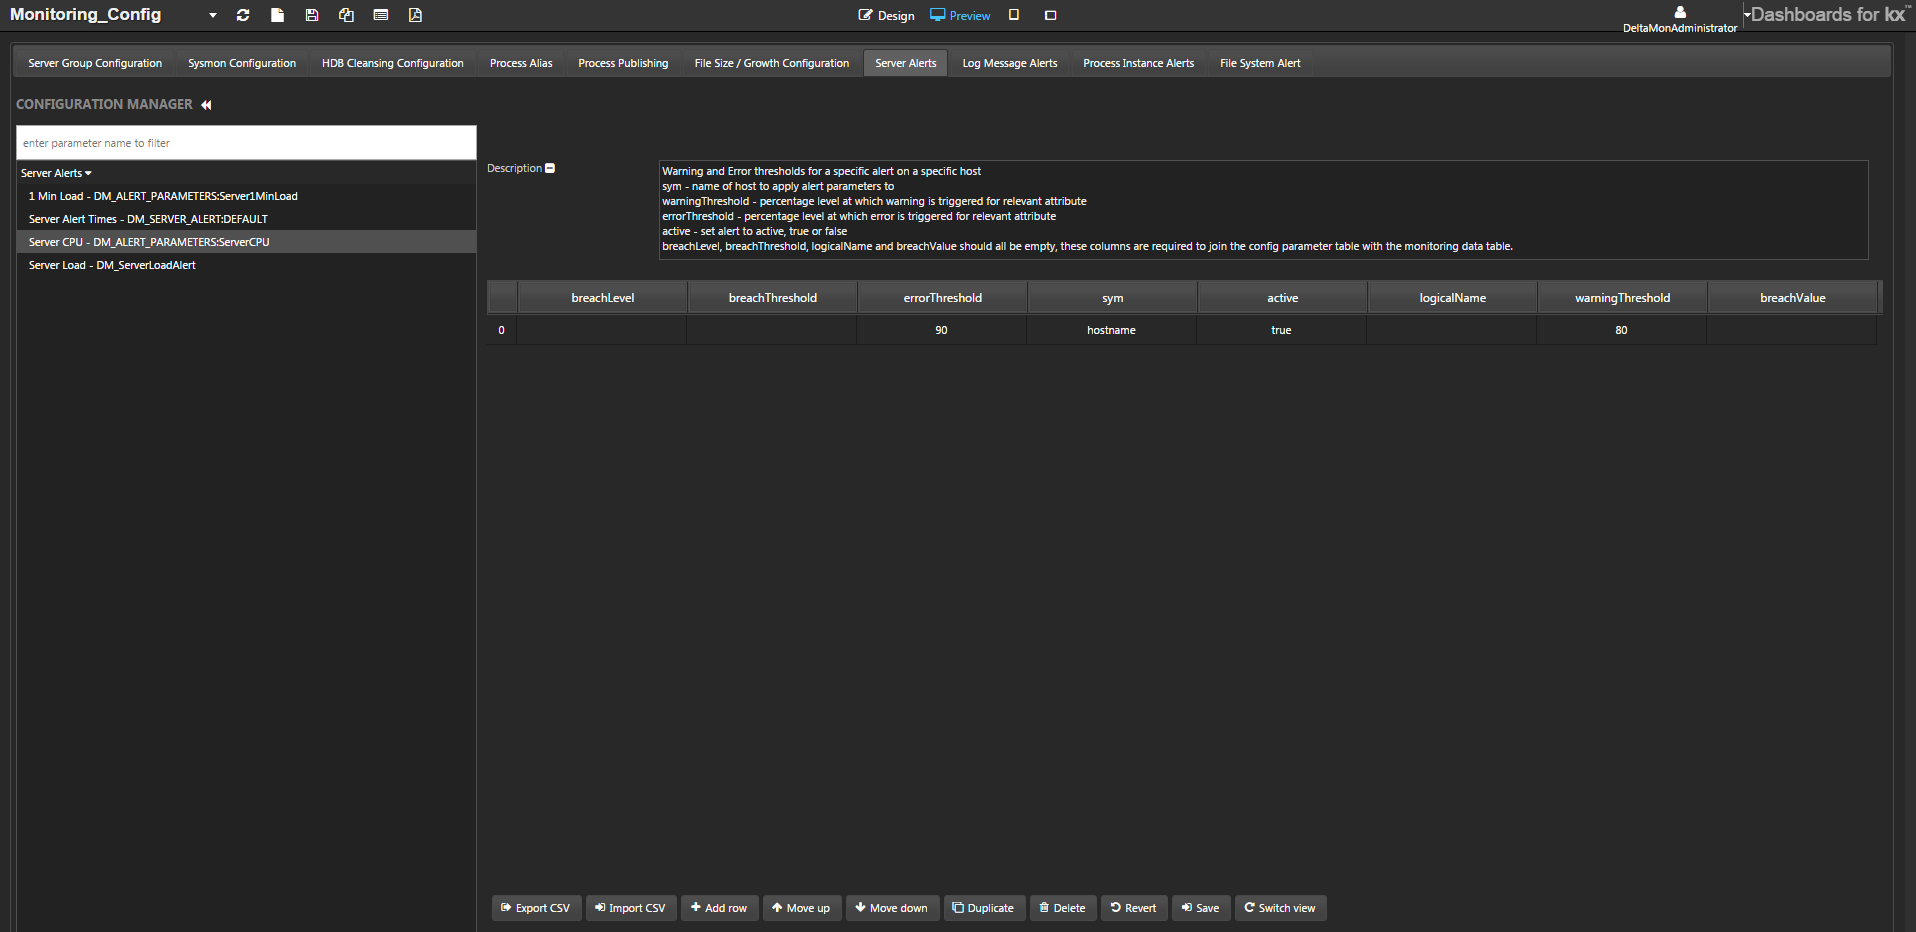
This parameter is used for monitoring that CPU usage is within a given threshold. It is used to compare against the observed CPU usage stored in the dmxsysStateServer table by the SysMon process. Each row of the parameter represents a satellite server.
The attributes of this parameter:
| attribute | description |
|---|---|
| breachLevel | Read-only: populated by the alert when carrying out checks on memory usage. |
| breachThreshold | Read-only: populated by the alert when carrying out checks on memory usage. |
| errorThreshold | This is an integer representation of the CPU usage. A value of 90 would represent 90% CPU usage. Once the CPU usage exceeds this value an error is triggered and an alert generated |
| sym | The name of the host to be monitored. |
| active | Flag: if false, Monitor ignores this parameter. |
| logicalName | Read-only: populated by the alert when carrying out checks on memory usage. |
| warningThreshold | This is an integer representation of the CPU usage. A value of 80 would represent 80% CPU usage. Once the CPU usage exceeds this value a warning is triggered and an alert generated. |
| breachValue | Read-only: populated by the alert when carrying out checks on memory usage. |
Server alert times
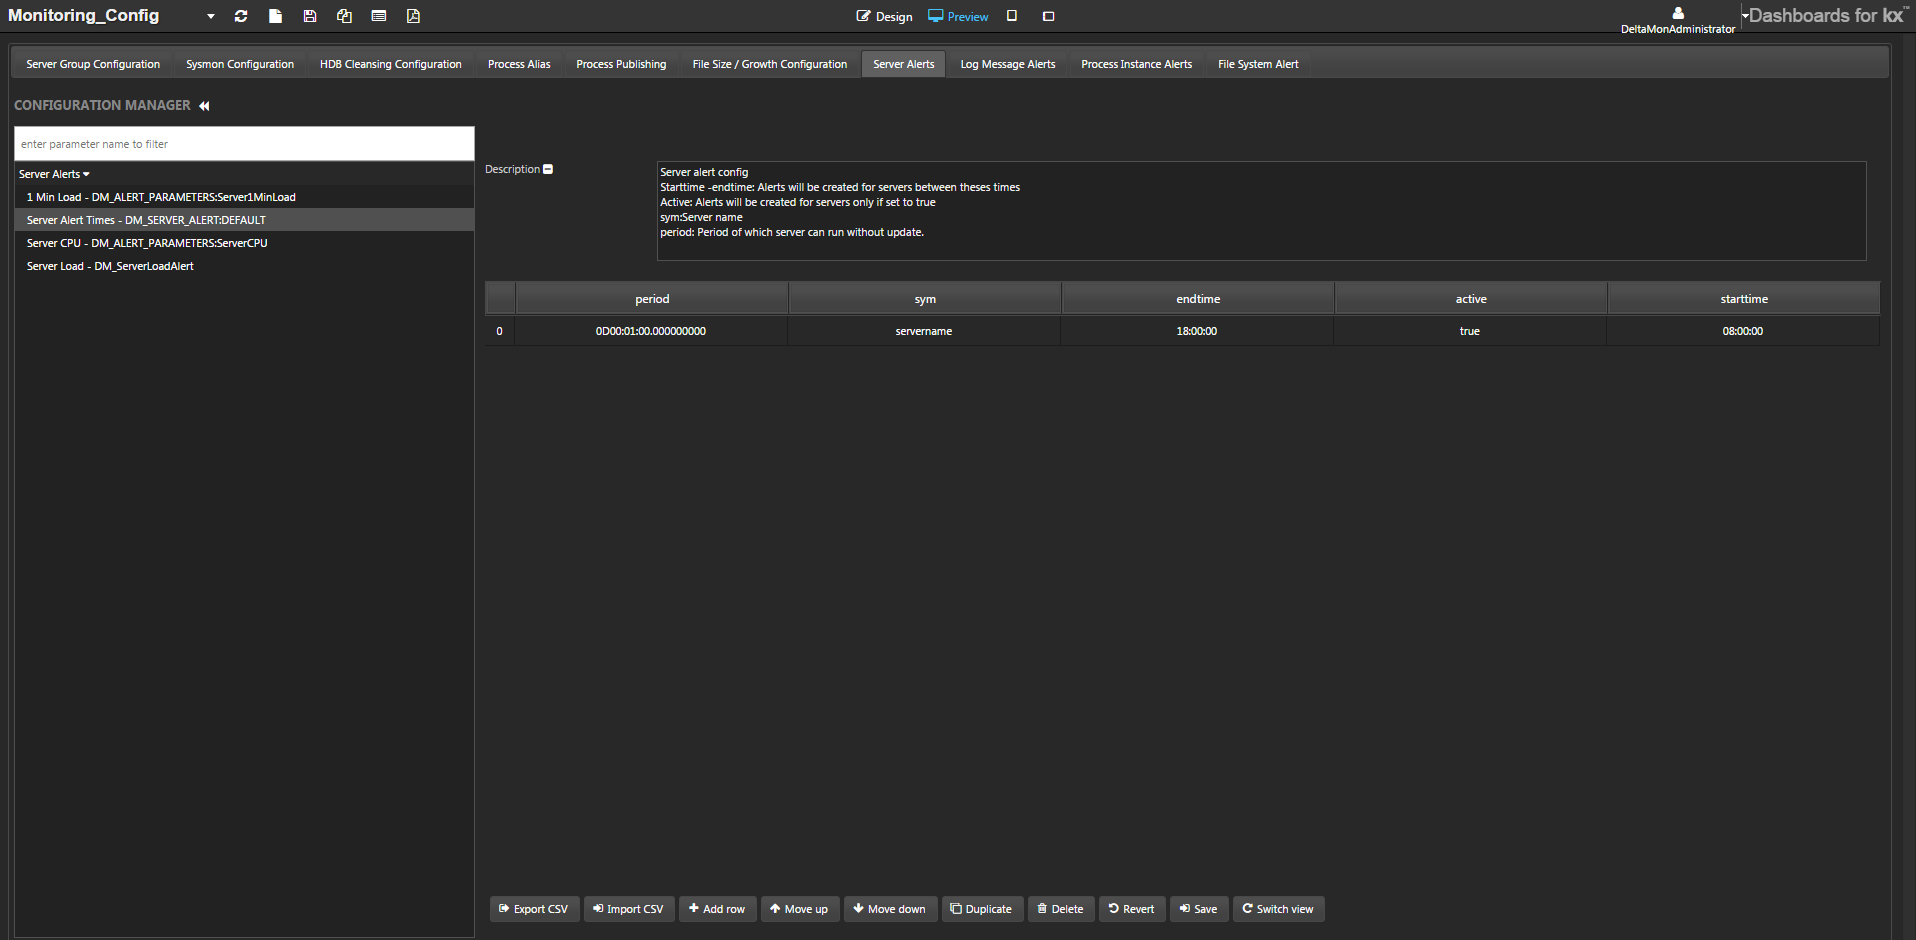
Used to configure monitoring of the servers themselves. It ensures that servers are running between specified times and the period of time they can be inactive before alerts are generated. Each row of the parameter represents a satellite server.
The attributes of this parameter:
| attribute | description |
|---|---|
| period | The period of time the server is allowed to go without update. |
| sym | The name of the host being monitored. |
| endTime | The time at which monitoring should end. |
| active | Flag: if false, Monitor ignores this parameter. |
| startTime | The time at which monitoring should begin. |
Server load
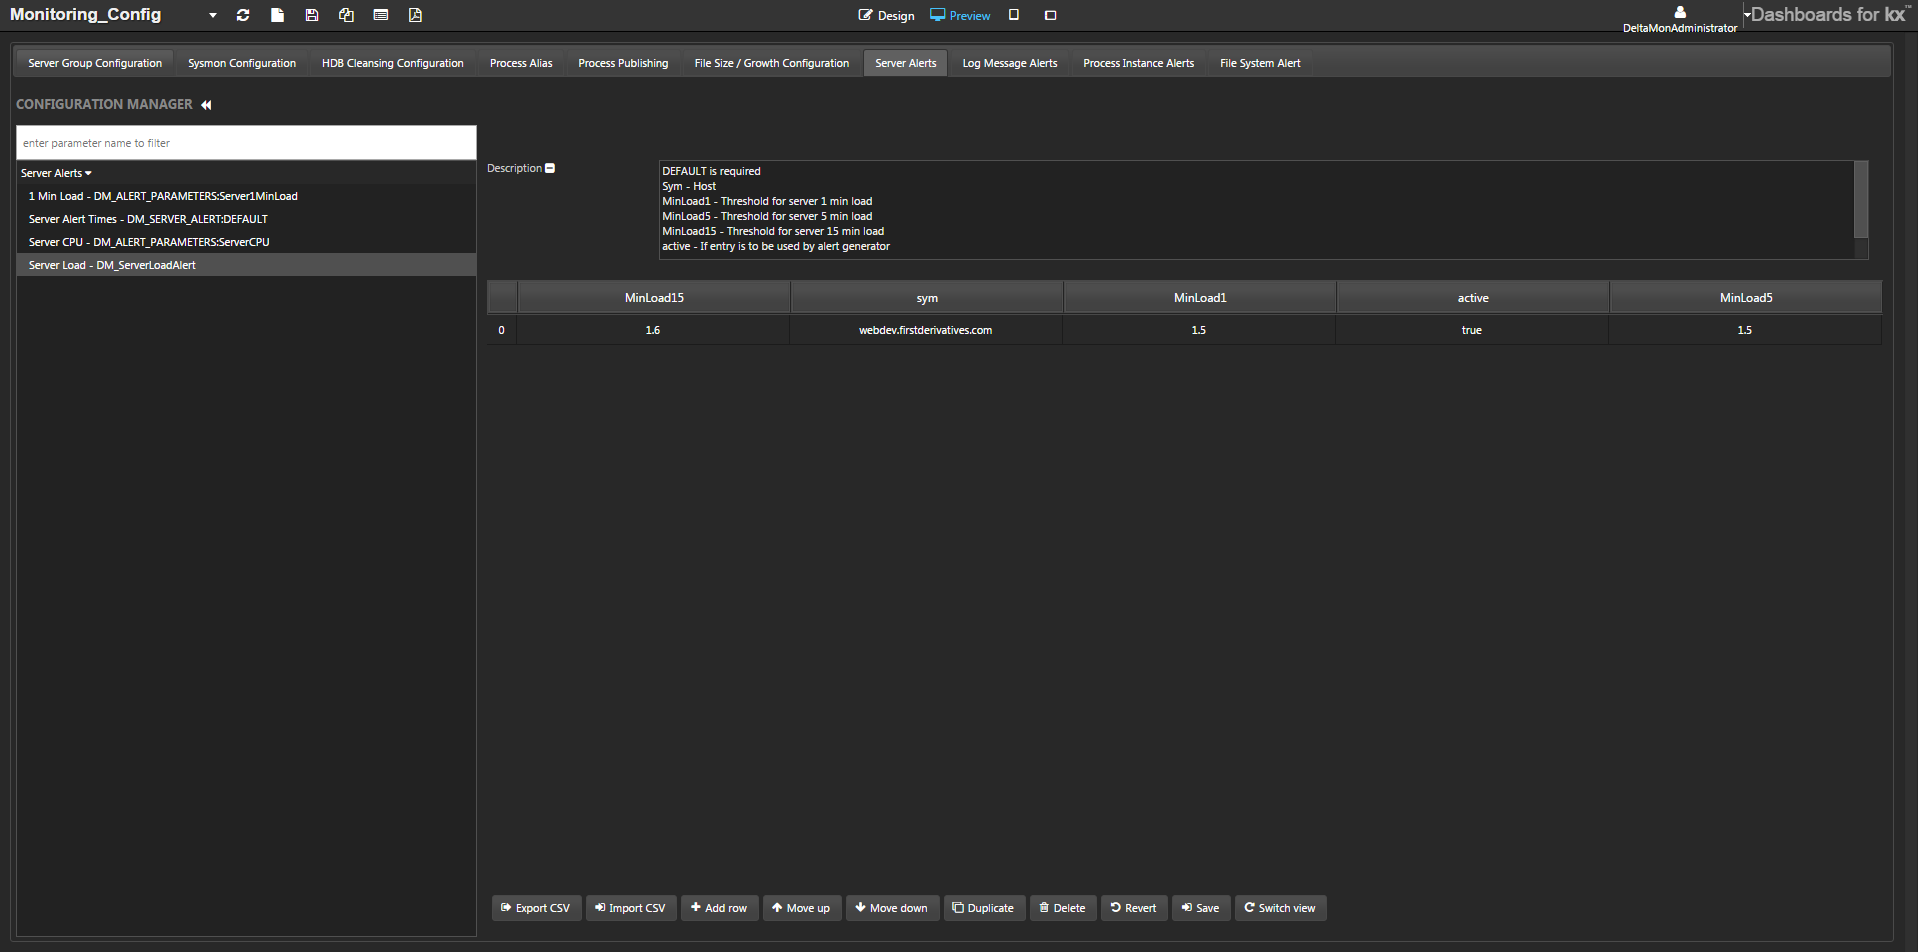
The Server Load (1-, 5-, and 15-minute) allows the alerting on the load levels on a specific server (sym) value
| attribute | description |
|---|---|
| MinLoad15 | Threshold for server 15-min load. |
| sym | The host name. |
| MinLoad1 | Threshold for server 1-min load. |
| active | Flag: if false, Monitor ignores this parameter. |
| MinLoad5 | Threshold for server 5-min load. |
Log message alerts
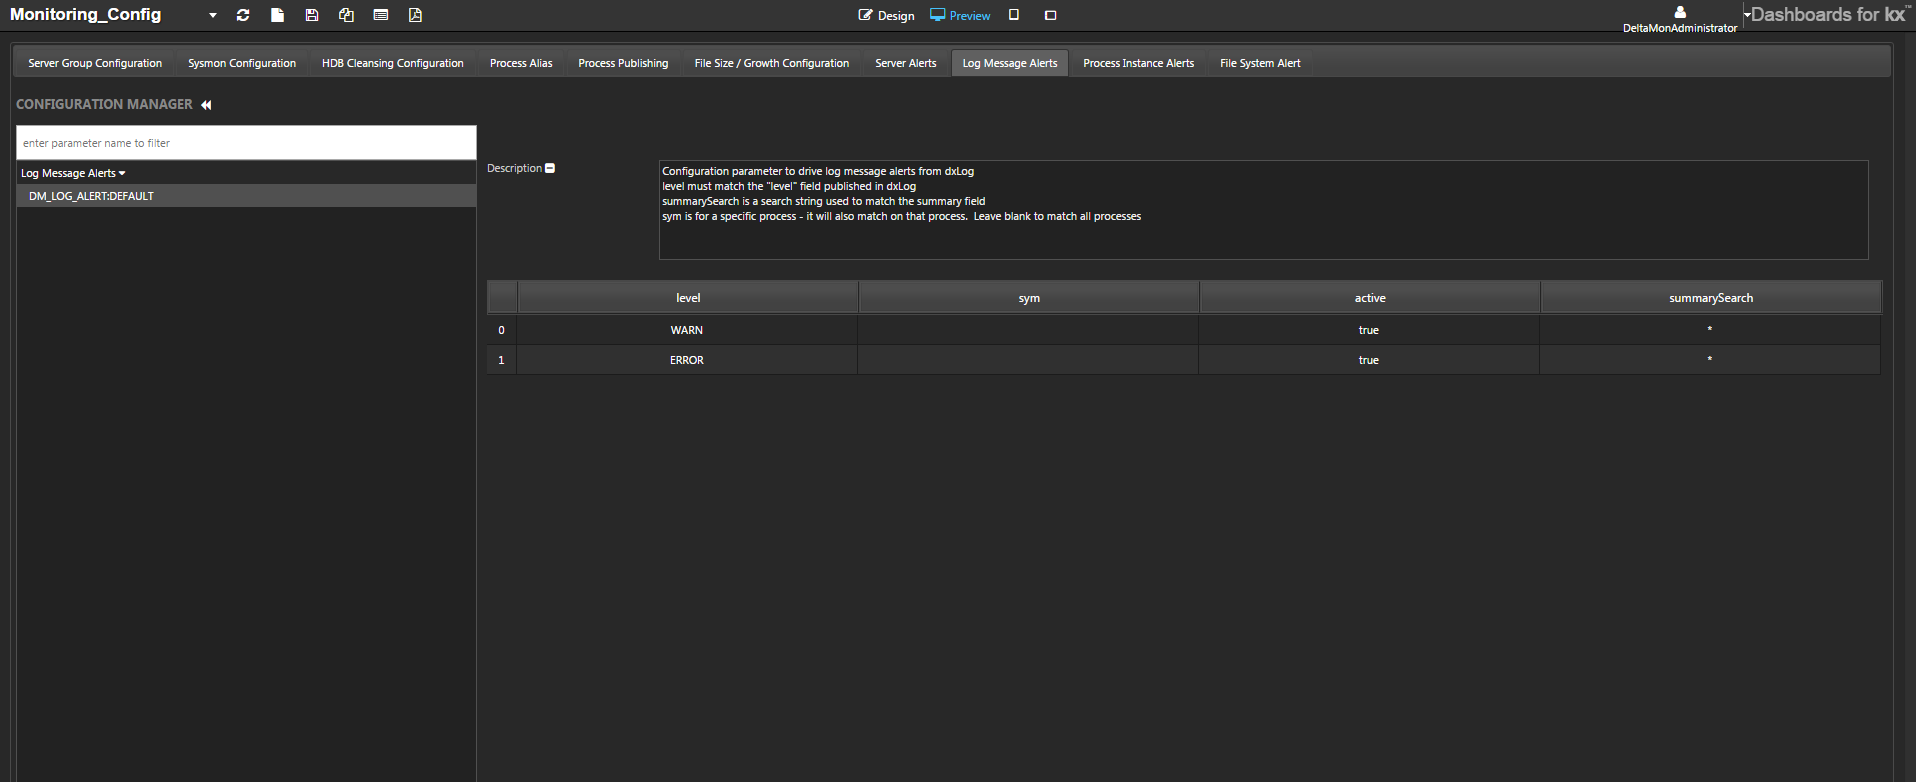
Use the Log Message Alerts tab to configure alerts based on the process log messages. Each process has its own log file; however, for this configuration to be of use, those processes must also populate the dxLog table within the RDB ops process. This depends on the DC_LOG_PUBLISH configuration. Set this in the Process Publishing tab of the Monitoring_Config dashboard.
The parameter can be configured to generate alerts on all warning or error messages generated by KX Delta Platform processes. It can also be configured to generate alerts on specific error messages. This is done by matching a regex to the summary field of the log message.
The attributes of this parameter:
| attribute | description |
|---|---|
| level | The level of message to trigger an alert. If set to Warn an alert would be created on a warning message. |
| sym | The name of the process instance being monitored. If blank it will trigger on all process instances. |
| active | Flag: if false, Monitor ignores this parameter. |
| summarySearch | A search string used to search the summary field of a log message. For example if upd is entered here it would search for messages with upd in the summary description |
Process instance alerts
Three parameters are defined:
- Process Instance Alert
- PID Resident Memory
- Process CPU Alert
Process instance alert
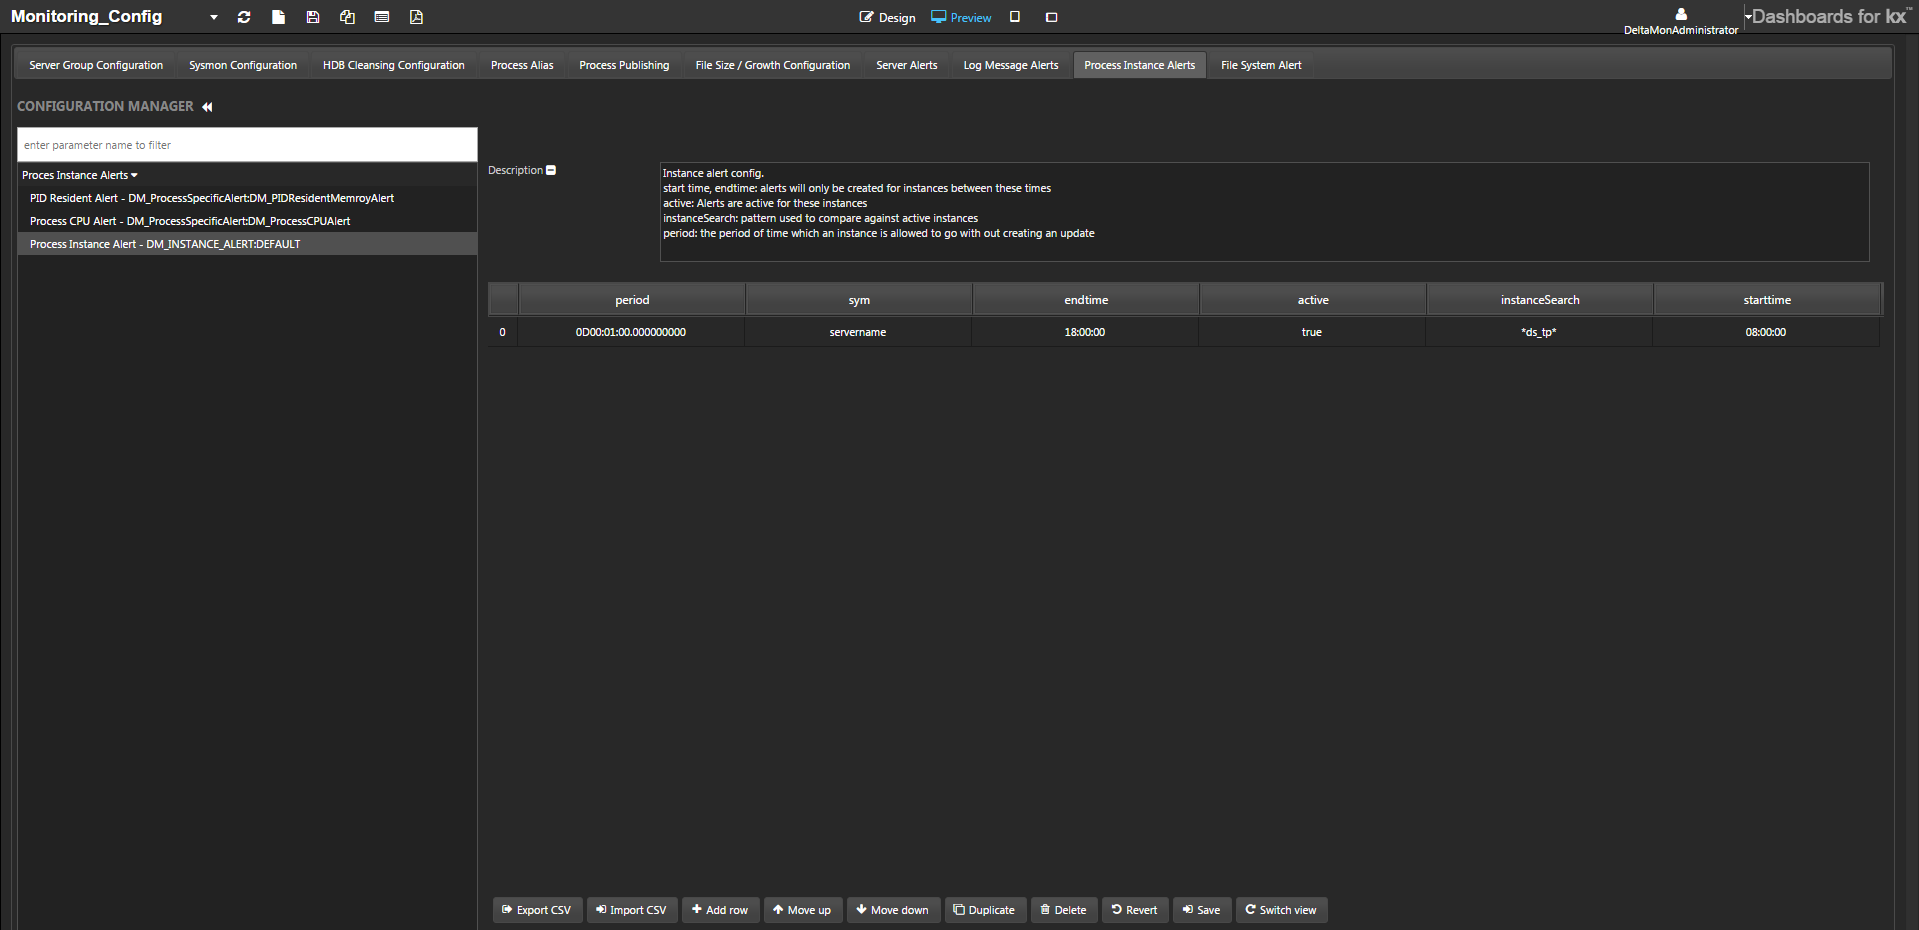
Configures monitoring of the individual KX Delta Platform processes running on any or all satellite servers. It ensures that particular process instances are active within a designated time frame. Each row of the parameter represents an individual process.
The attributes of this parameter:
| attribute | description |
|---|---|
| period | The period of time the instance is allowed to go without update. If the process instance fails to update within the period defined here an alert will be generated. |
| sym | The name of the host being monitored. |
| endtime | The time at which monitoring should end. If a process instance is not running within the specified time frame an alert is generated. |
| active | Flag: if false, Monitor ignores this parameter. |
| instanceSearch | The pattern used to match against running process instances. This can be a regex or the name of the process instance that is to be monitored. For example searching for an instance name via search pattern tp would be all TP process instances |
| starttime | The time at which monitoring should begin. |
PID resident memory
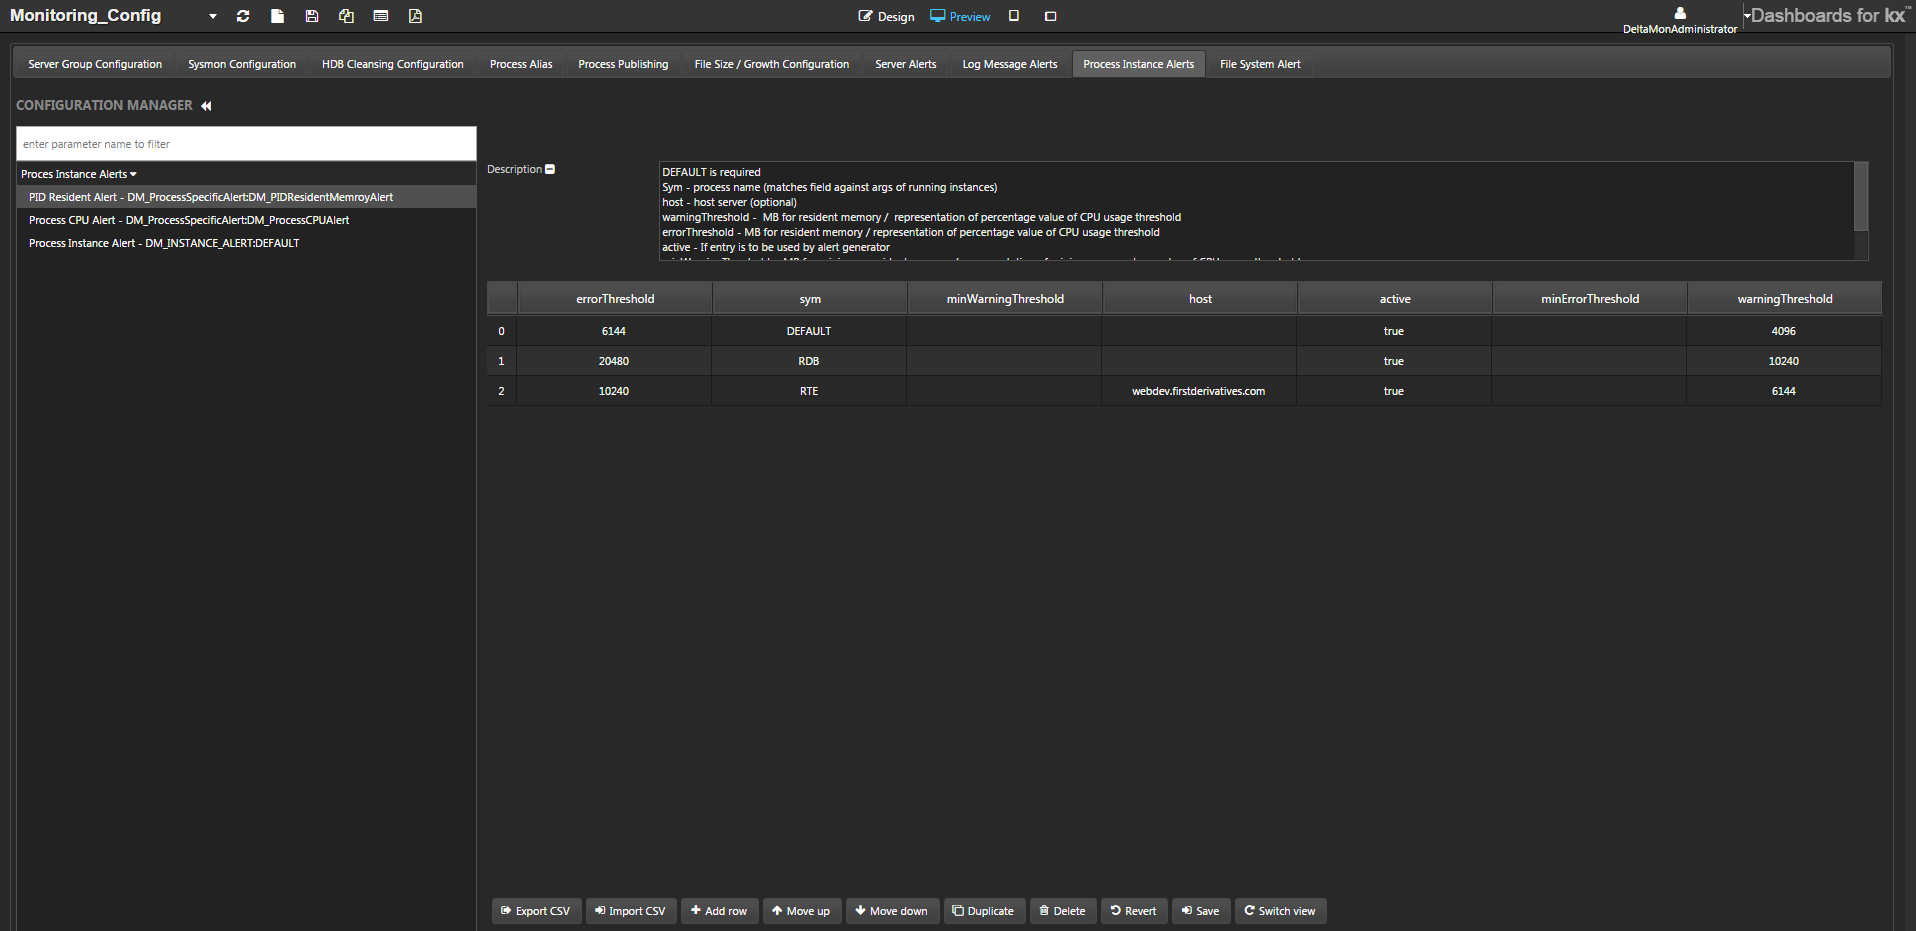
The attributes of this parameter::
| attribute | description |
|---|---|
| errorThreshold | The value in Mb of RAM consumed. When memory usage exceeds this value an error is generated. |
| sym | The process name (matches field against args of running instances). |
| minWarningThreshold | The value in Mb for minimum resident memory. A warning will be generated when this threshold is breached. |
| host | The host server. This is optional. |
| active | Flag: if false, Monitor ignores this parameter. |
| minErrorThreshold | The value in Mb for minimum resident memory. An error will be generated when this threshold is breached. |
| warningThreshold | The value in Mb of RAM consumed. When memory usage exceeds this value a warning is generated. |
Process CPU alert
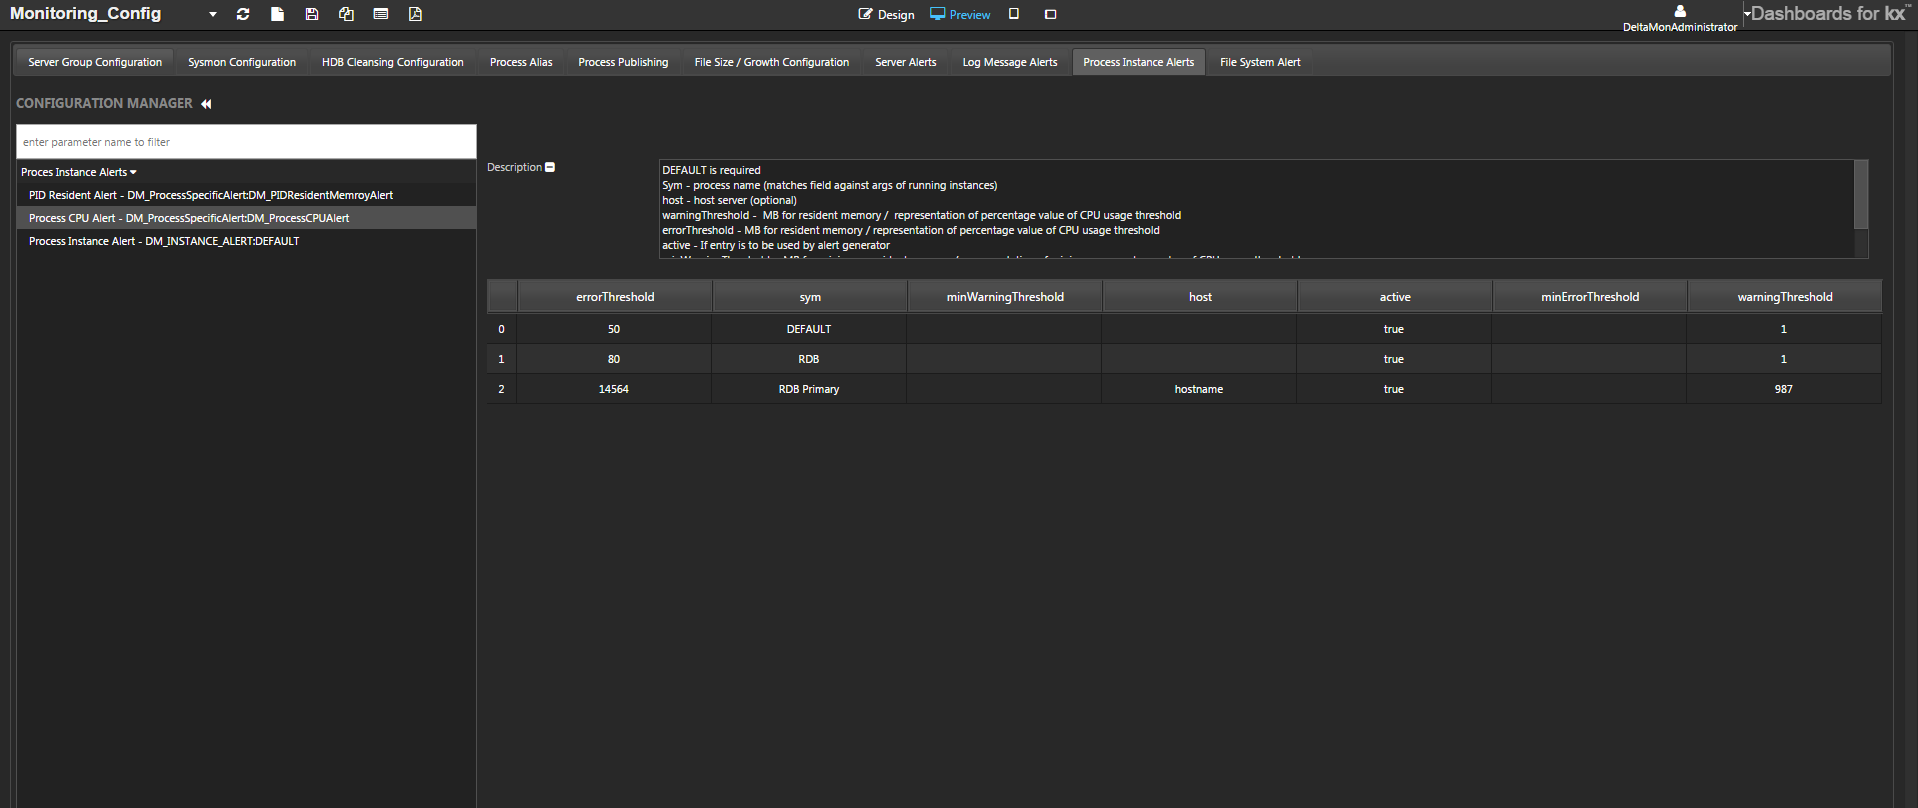
Used for monitoring CPU usage by process. It is compared against the observed CPU usage by each running process stored within the dmxsysStatePID table by the SysMon process. Each row of the parameter represents a process or a process instance alias to be monitored.
The attributes of this parameter:
| attribute | description |
|---|---|
| errorThreshold | The percentage value of CPU consumed. When CPU usage exceeds this value an error is generated. |
| sym | The process name (matches field against args of running instances). |
| minWarningThreshold | The value in Mb for minimum CPU usage. A warning will be generated when this threshold is breached. |
| host | The host server. This is optional. |
| active | Flag: if false, Monitor ignores this parameter. |
| minErrorThreshold | The value in Mb for minimum CPU usage. An error will be generated when this threshold is breached. |
| warningThreshold | The percentage value of CPU consumed. When CPU usage exceeds this value a warning is generated. |
File system alerts
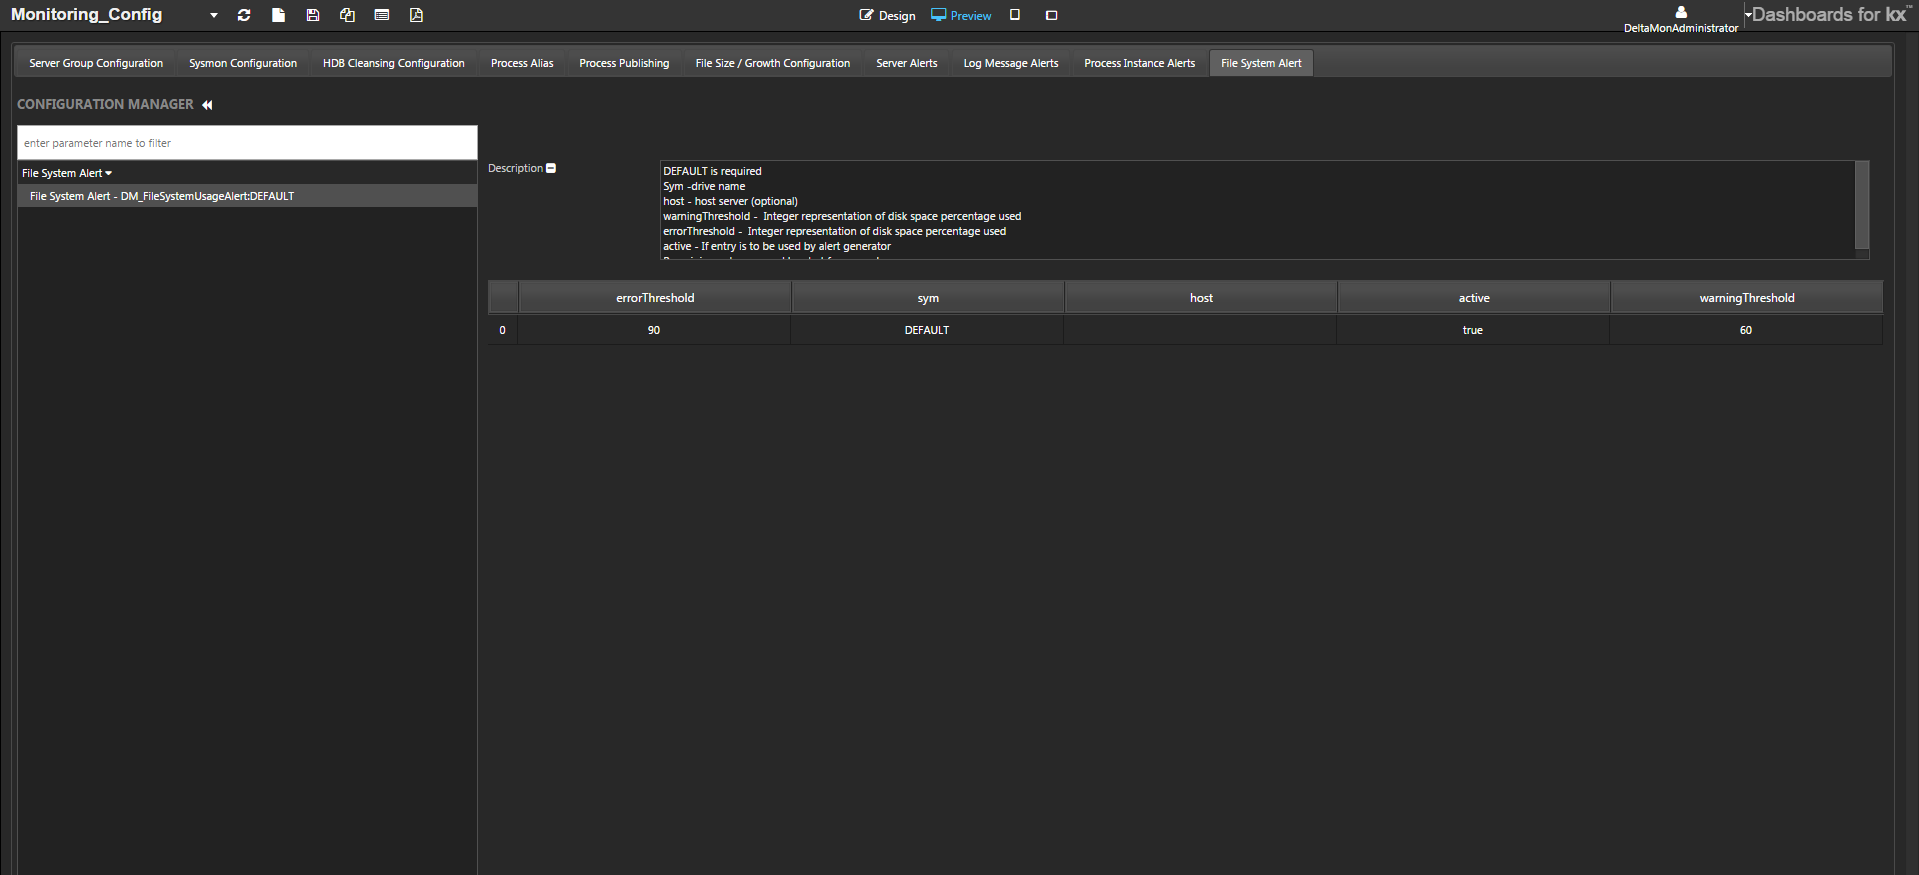
The File System Usage Alert is used to monitor the disk-space usage. It is compared against the observed disk space usage stored within the dmxsysStateFileSystem table by the SysMon process. Each row within the configuration parameter represents a network drive to be monitored.
The attributes of this parameter:
| attribute | description |
|---|---|
| sym | The drive being monitored. |
| host | The host server. This is optional. |
| strictMatch | Flag: if true, exact match of drive to sym as configured. false will append wild cards to sym. |
| warningThreshold | The percentage of disk space used. When disk space usage exceeds this value a warning is generated. |
| errorThreshold | The percentage of disk space used. When disk space usage value exceeds this value an error is generated. |
| active | Flag: if false, Monitor ignores this parameter. |
Notifications
Deprecation
Modern browsers no longer support Flash applications. As of KX Delta Platform v4.6.0 alerts should be configured using ControlUI.
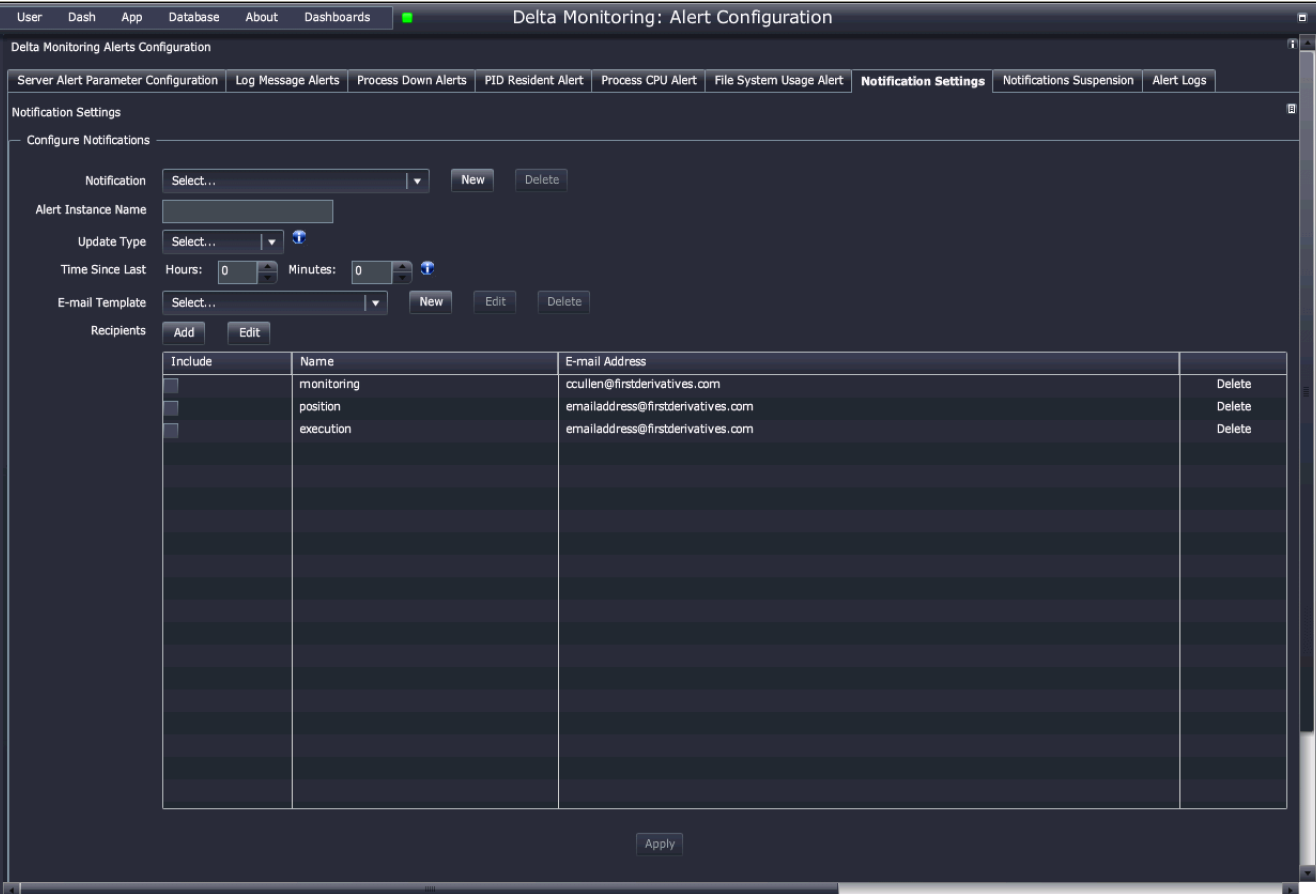
Use ths tab to set up email notification to be sent when alerts are triggered. You can also associate the notification with alert instances and specify their frequency and recipients.
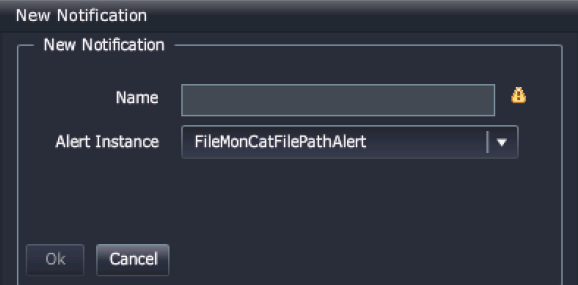
- Notification
- Select a notification from the drop-down list to populate the notification details. Or click New to add a new notification. When you create a new notification you specify a name for the notification and select the alert instance that it is associated with.
- Alert Instance Name
- The alert instance that the notification is associated with.
- Update Type
-
Indicates when the notification will be sent:
On True: Send notification on alerttriggered=trueOn False: Send notification on alerttriggered=falseOn First True: Send notification when the alert first setstriggered=trueOn First False: Send notification when the alert first setstriggered=falseOn Change: Send notification when the alert’striggeredvalue is not equal to its previous valueOn All: Send notification regardless of the alert’striggeredstate
- Time Since Last
- Delay time from when a notification is sent until the next notification is sent.
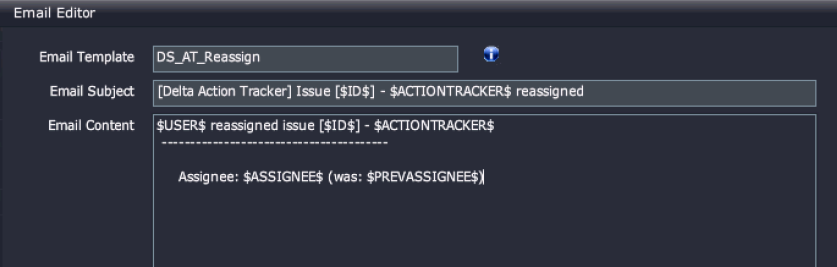
- Email Template
- Template for the email that will be sent when the notification is triggered. The template can be edited by clicking Edit or you can create a new template by clicking New.
- Recipients
- This is the list of email addresses that will receive the notification. Click Add to add a new recipient, you will need to specify a name and email address. Click on a recipient in the list and click Edit to change the details.
Notification suspension
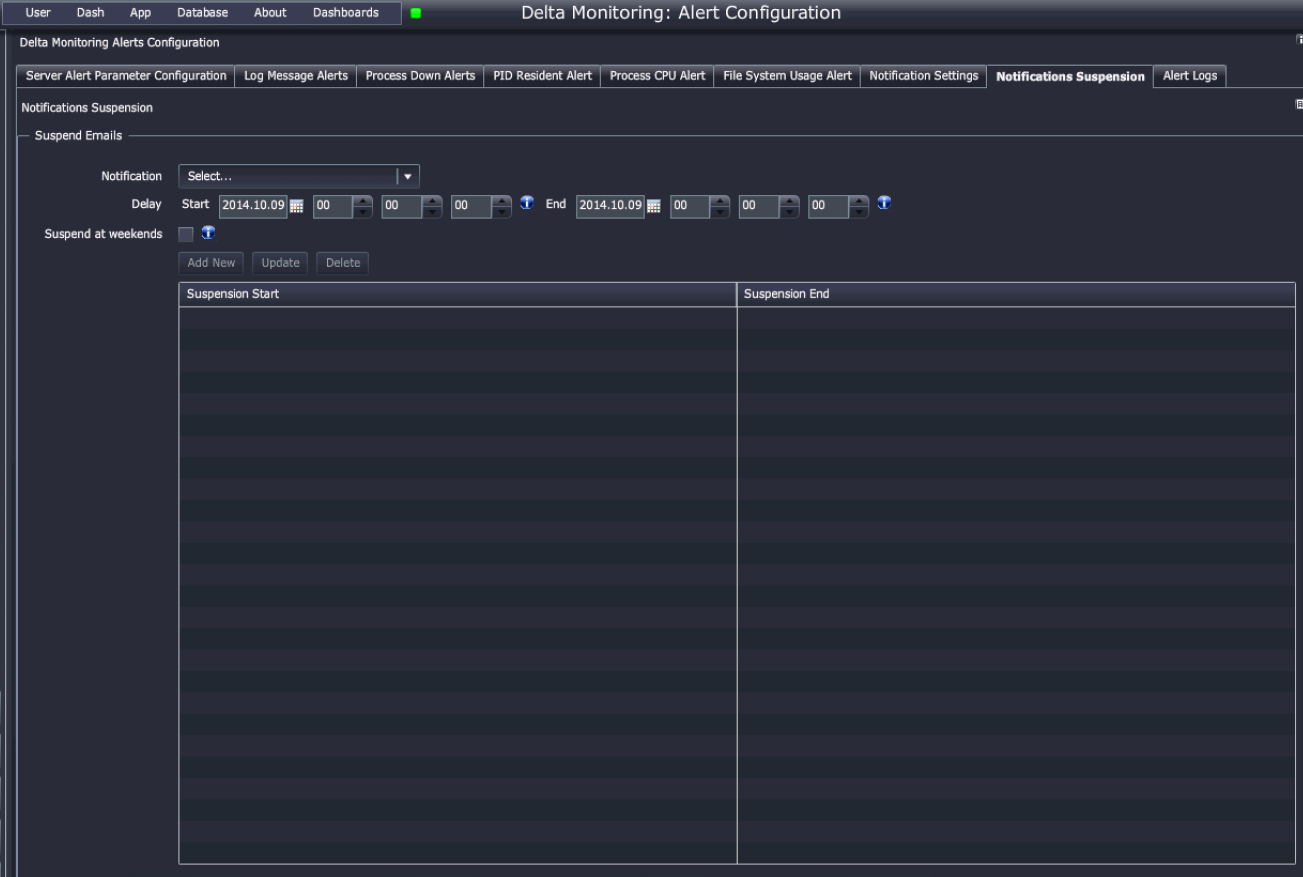
Use this tab to set periods when email notifications are temporarily suspended. You can also suspend notifications on weekends.
| control | effect |
|---|---|
| Notification | Name of the notification to which the suspension applies. |
| Delay | Start and end date and time for the suspension. |
| Suspend at Weekends | Check to suspend emails on weekends (Saturday and Sunday). |
Alert logs
Deprecation
Modern browsers no longer support Flash applications. As of KX Delta Platform v4.6.0 alerts should be configured using ControlUI.
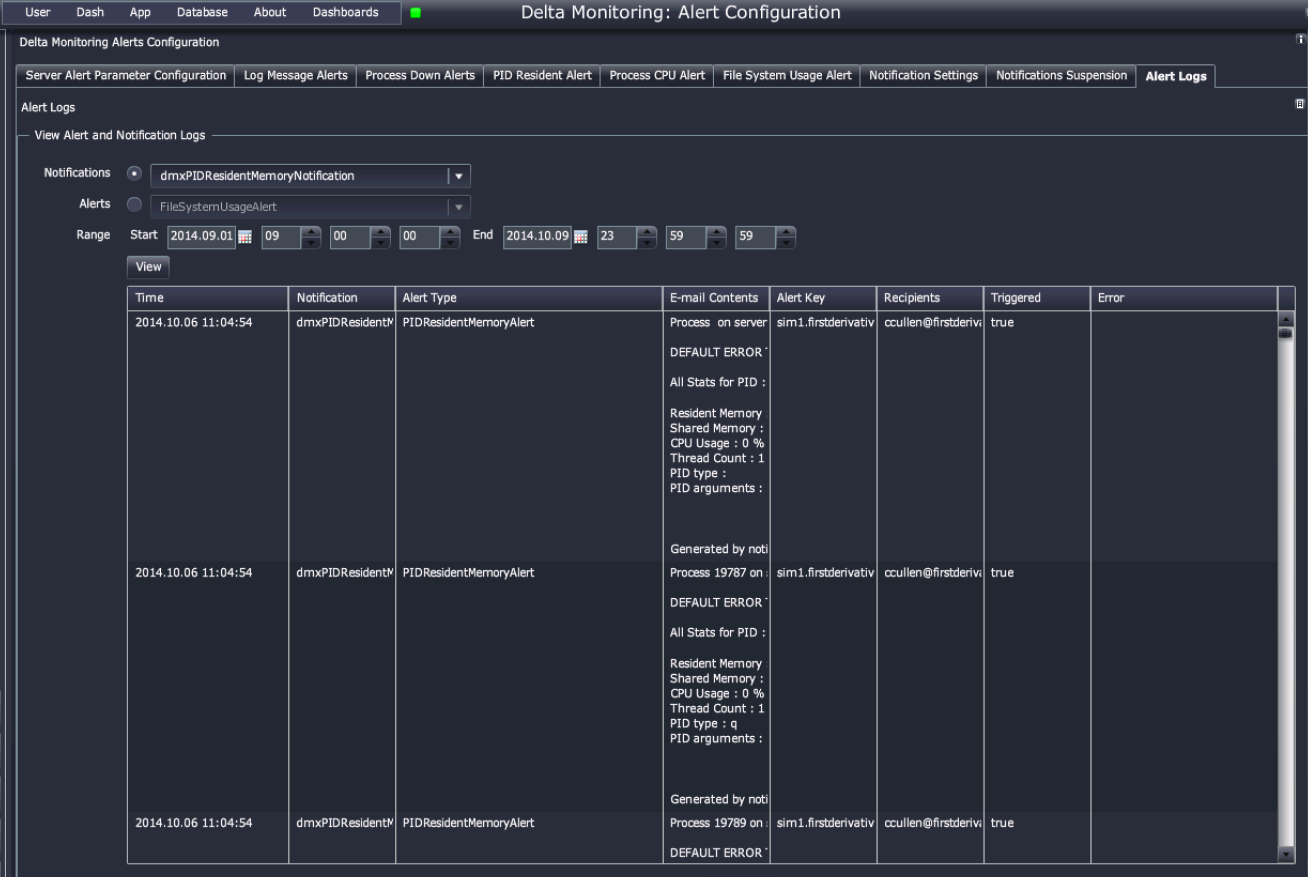
Use this tab to investigate the events that triggered an alert. You can view logs of both notifications and alerts.
| control | effect |
|---|---|
| Notifications | Check to select notifications. Use the dropdown list to select a specific notification. |
| Alert | Check to select alerts. User the dropdown list to select a specific alert. |
| Range | A date and time range to filter the results. |
Mail server
To enable email alerts, it will be necessary to setup the the email server.
Use the KX Control UI to set the following configuration parameters to the correct email server:
DS_LAUNCH_COMMANDLINE_PARAMS:ds_jemailDS_JEMAIL_SERVER:exchangeAnonymousDS_JEMAIL_SERVER:exchangeAuthenticated
Which override of DS_JEMAIL_SERVER to use depends on whether the underlying email service requires authentication to send emails.
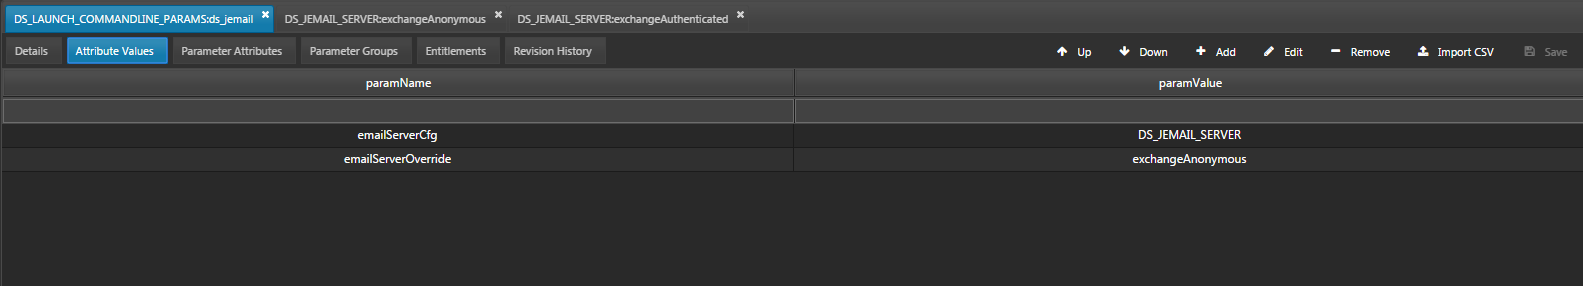
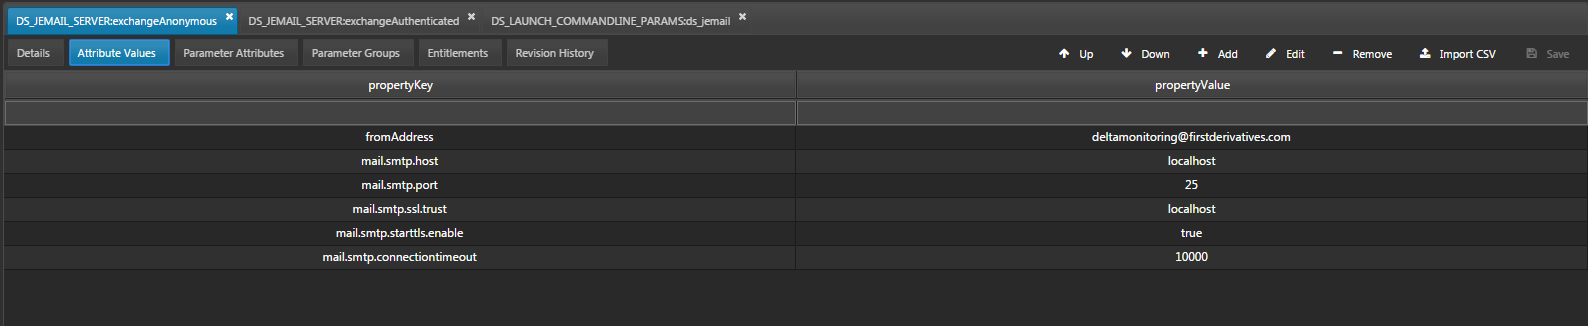
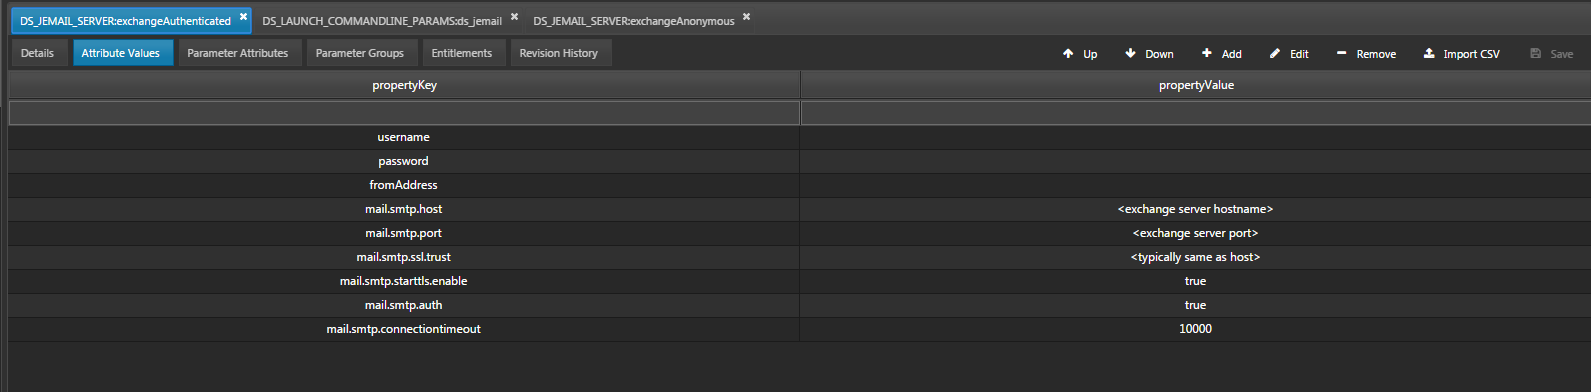
Restart the ds_jemail_a.1 process (via the KX Control UI) to pick up the changes.
Advanced alert configuration
Advanced users can use the Alert Management dashboard to
- define alert criteria and alert instances
- define actions to be taken when alerts are triggered
- suspend emails generated by certain alerts
- inspect logs of alert activity