KX Monitoring
KX Monitoring gathers and displays information about the status of an environment in real time. It offers the ability to monitor any number of servers within a system, tracking critical server and process statistics. Each server requires a SysMon Java application installed and running to collect run time information, while the KX Dashboards provide powerful tools for visualizing and analyzing the current and historical state of the system. As well as an active real-time view of the status of an environment KX Monitoring offers powerful out of the box Alerting for potential system issues before they occur. The same Alert framework provided within the KX Delta Platform can be extended to allow additional alerts to be implemented as required from the monitored data.
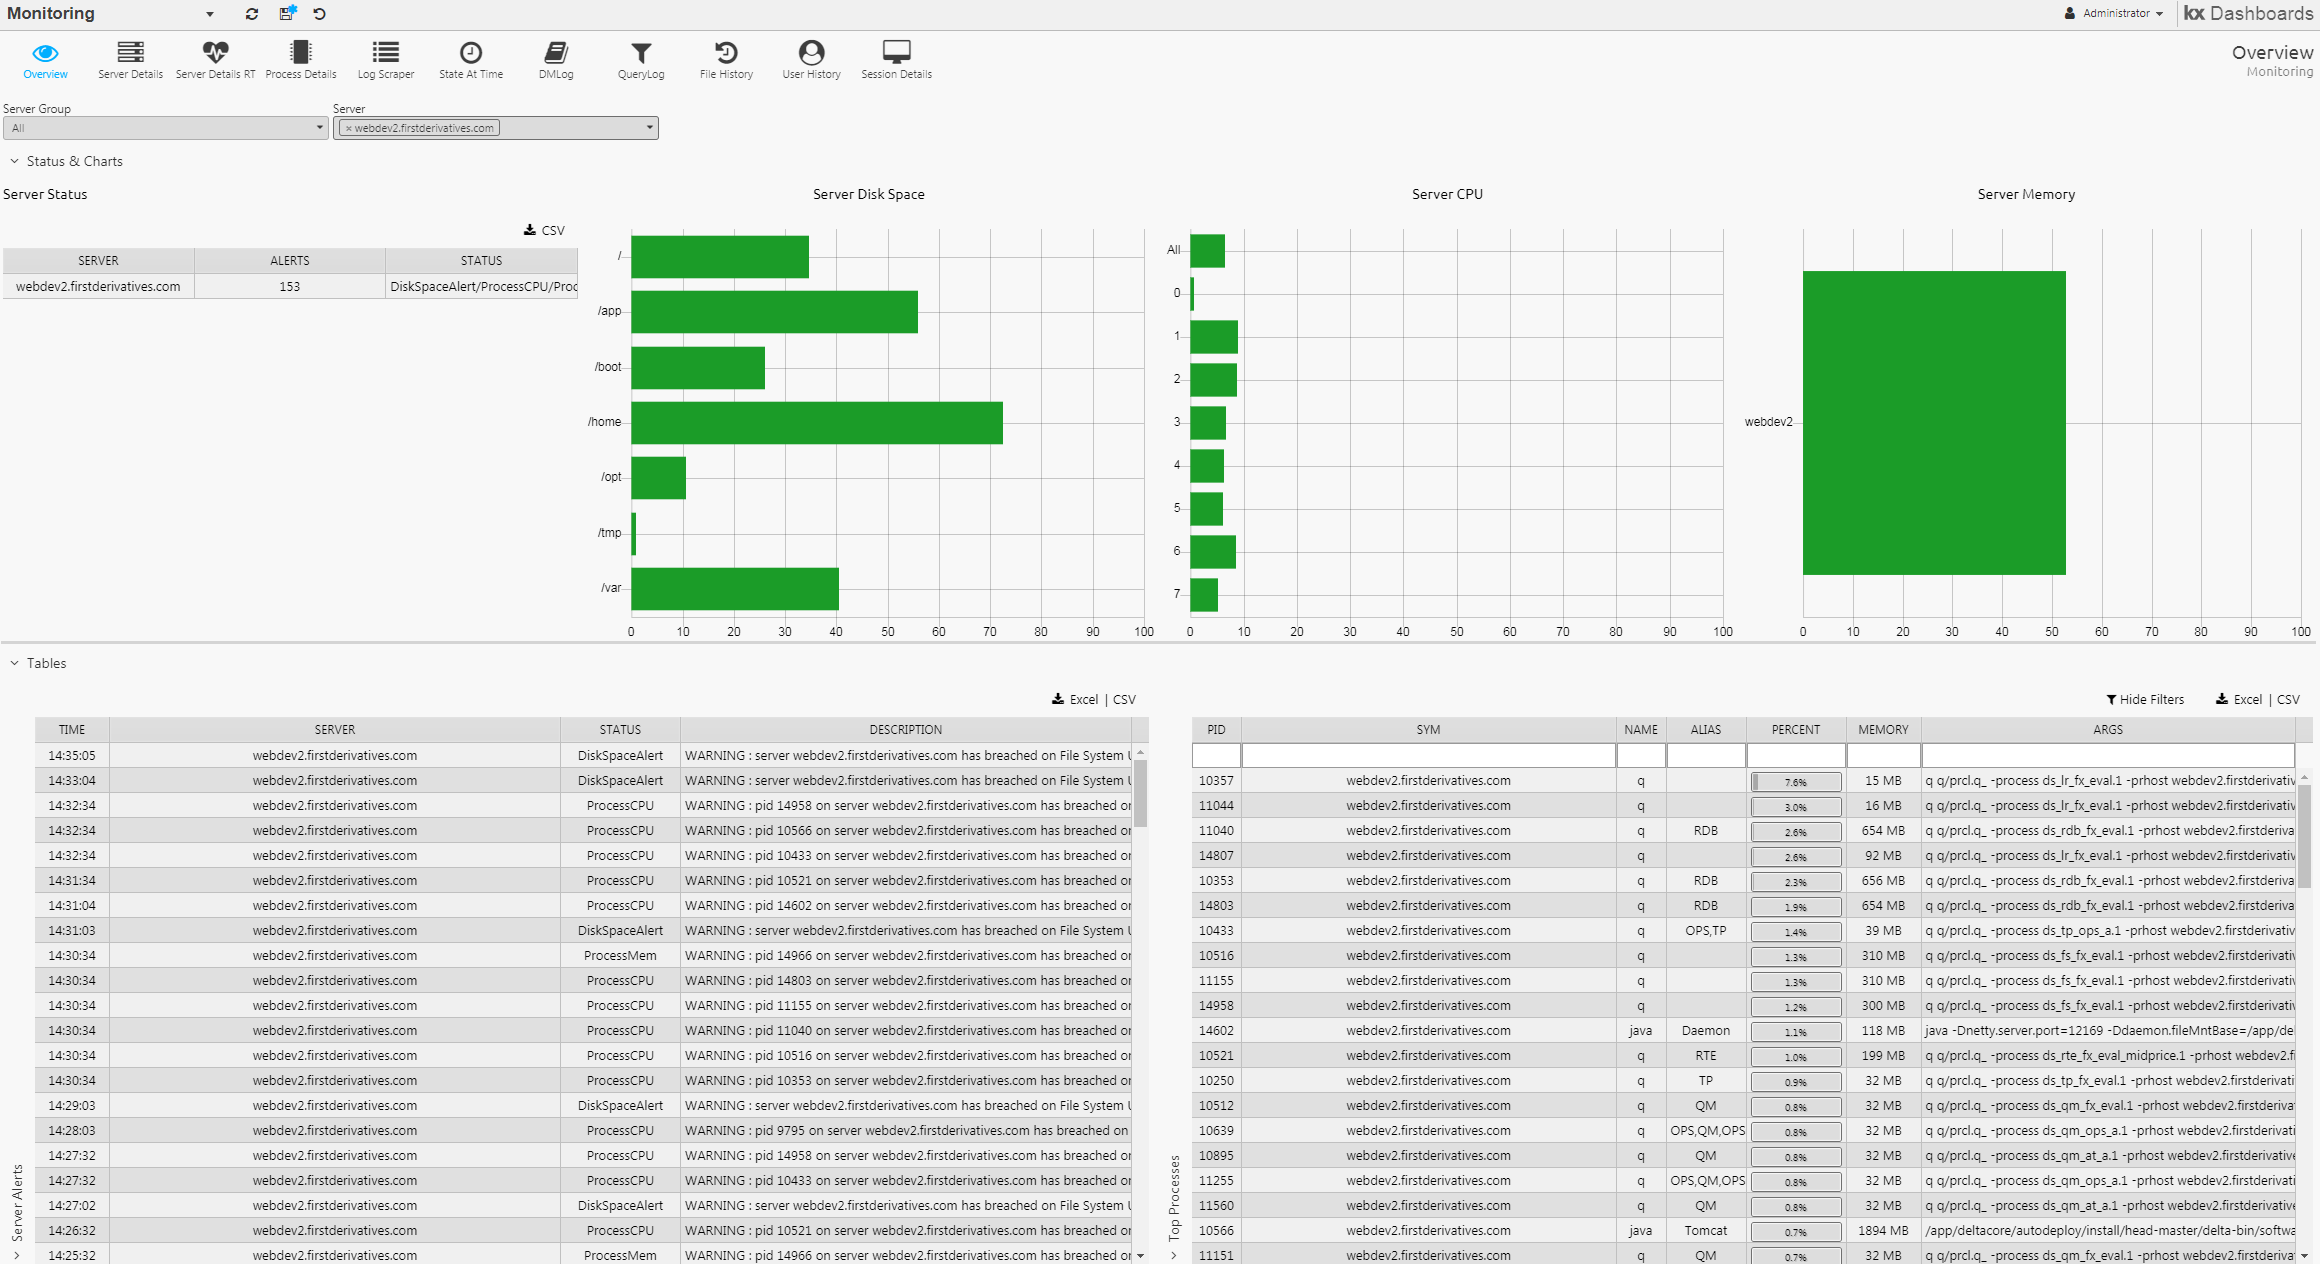
The dashboard displays an overview of the current state of the system. It is an aggregated view across all processes running on all servers.
| panel | content |
|---|---|
| Top Processes | processes using the most CPU and memory |
| Server Status | number of alerts per server and the status of each server |
| Server Memory | free and used memory stats for all servers |
| Server CPU | busy and idle percentages for all CPUs |
| Server Disk Space | free and used disk space for each server |
| Server Alerts | active alerts generated when server thresholds are breached |
Top processes
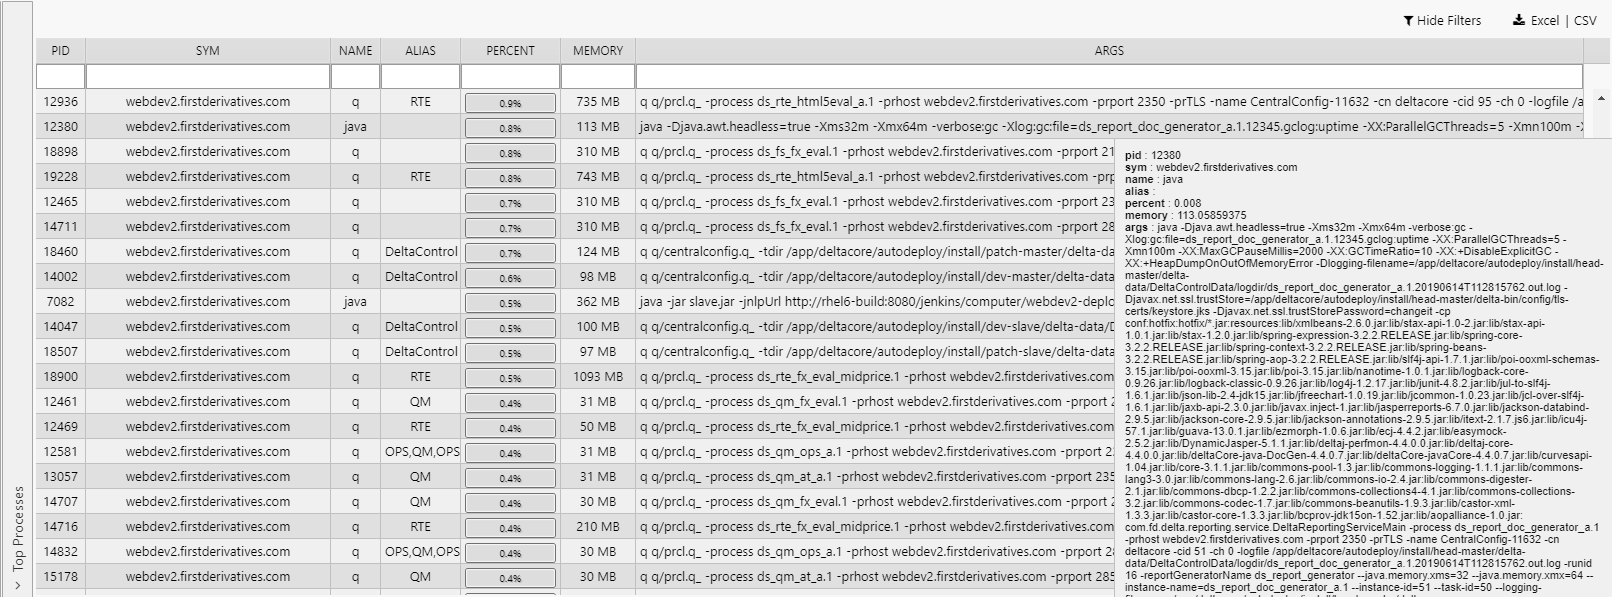
Processes using the most CPU and memory: those using nominal levels of CPU and memory are ignored.
| column | description |
|---|---|
| PID | process ID |
| SYM | host of the process |
| NAME | type of process, e.g. q, Java |
| ALIAS | configured alias for the process |
| PERCENT | percentage CPU being used by the process |
| MEMORY | Mb of memory used by the process |
| ARGS | Process arguments |
Server status
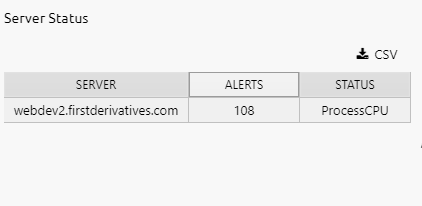
Number of alerts and the status of each server.
| column | description |
|---|---|
| SERVER | server name |
| TOTALERTS | total number of alerts per server |
| STATUS | last alert on the server |
Server memory
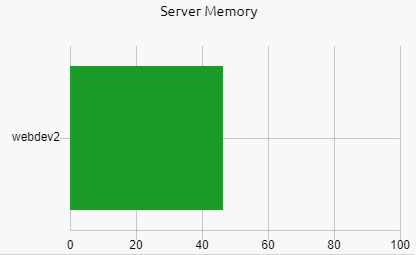
Free and used memory for all servers within the system. This can be useful in identifying the servers using the most memory.
Server CPU
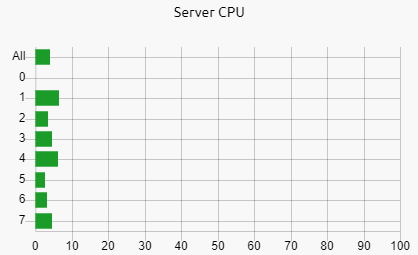
Busy and idle percentages for all CPUs in each server within the system.
Server disk space
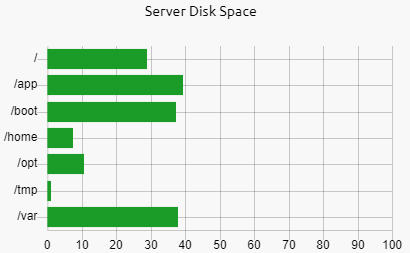
This graph displays the free and used disk space for each server defined within the system.
Server alerts
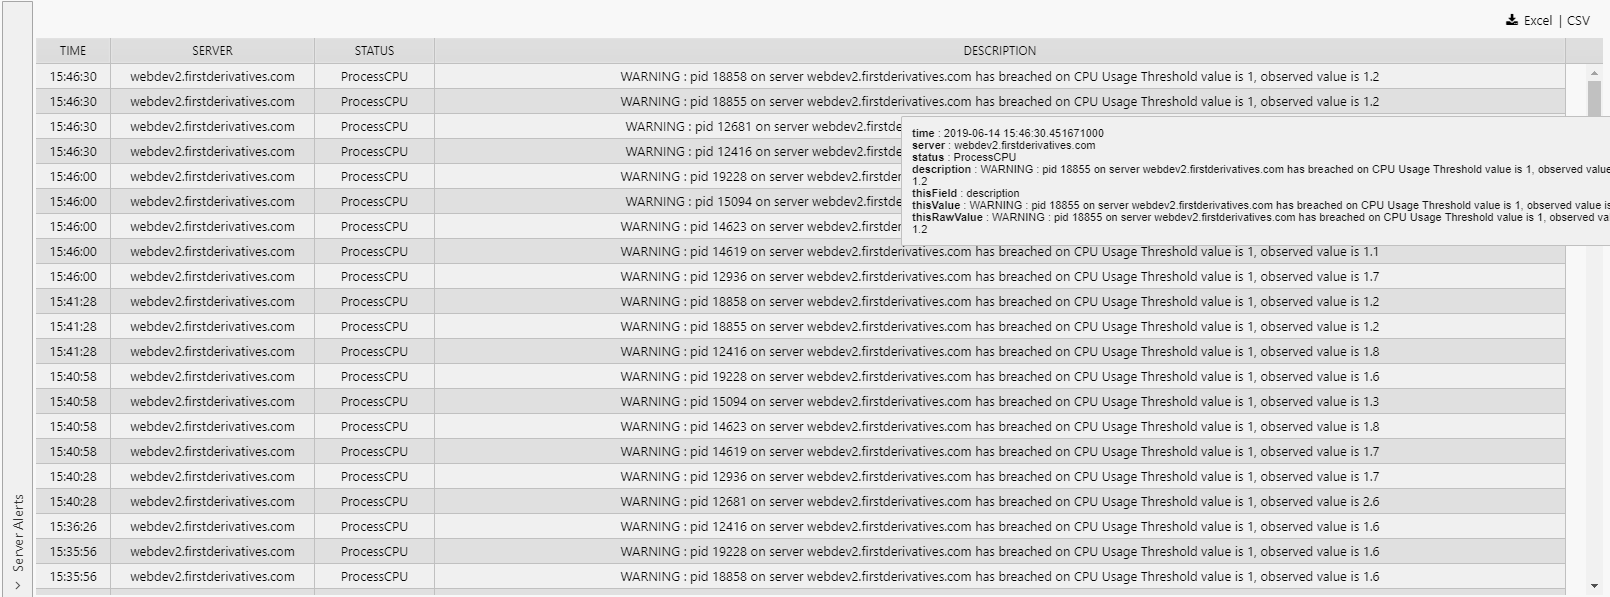
KX Monitoring fires active alerts when server thresholds are breached, and lists them in the Server Alerts table.