State at time
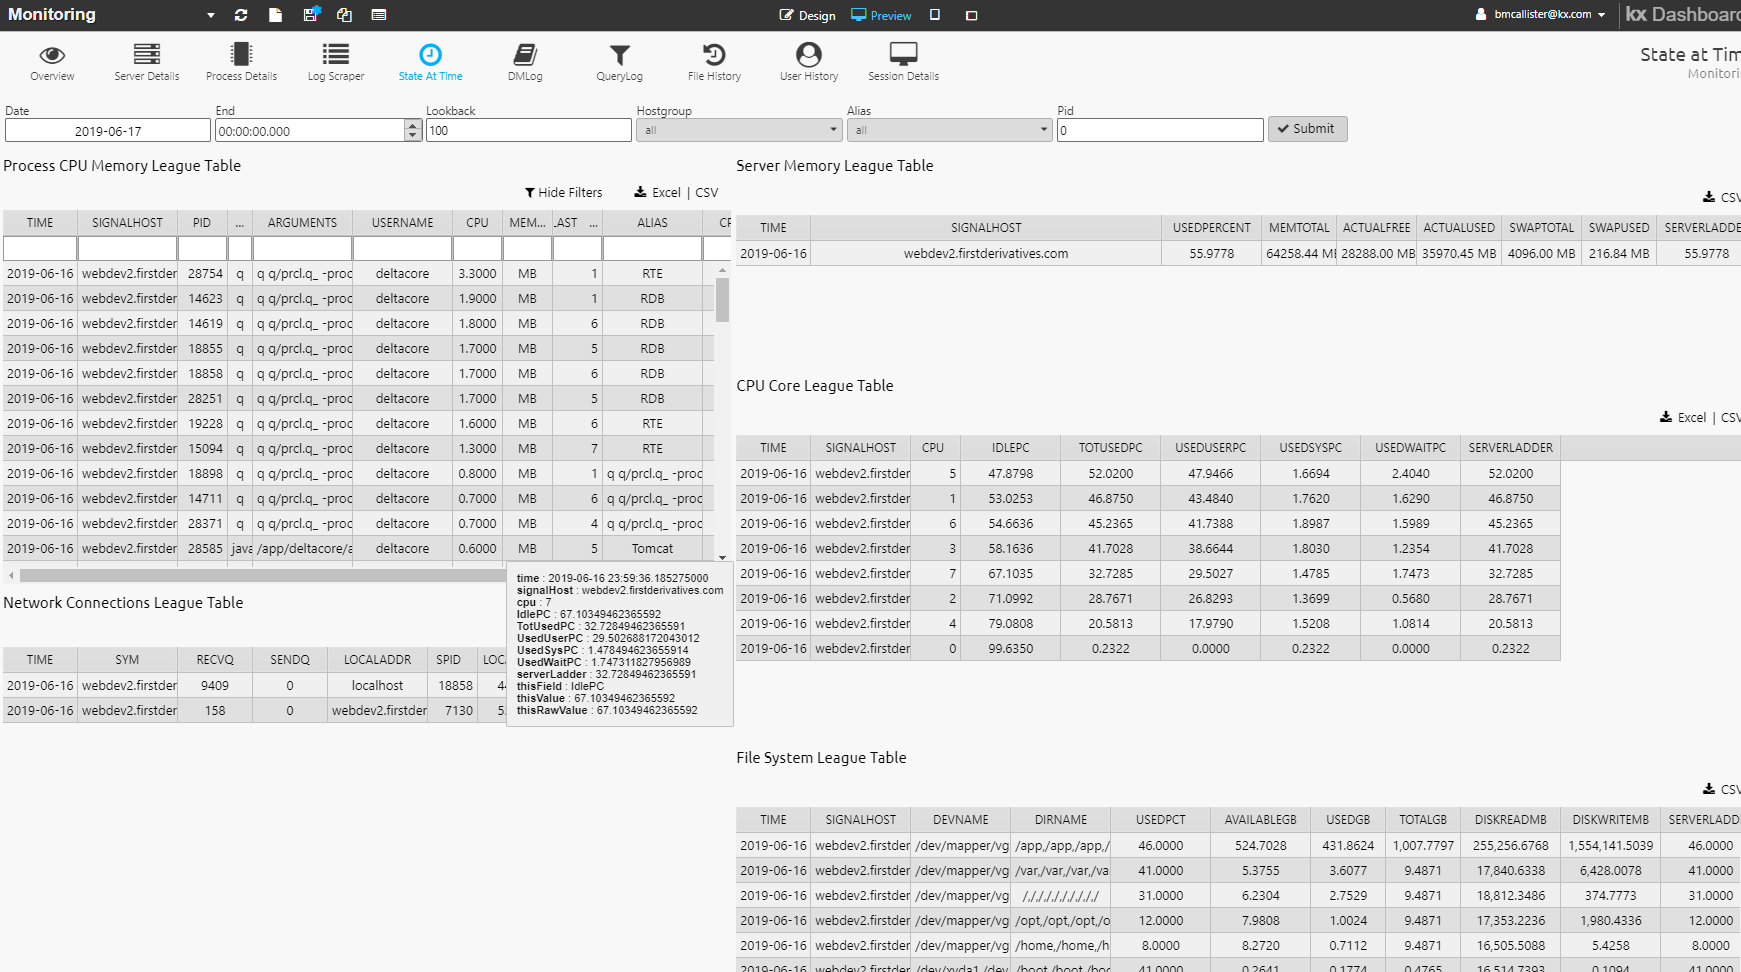
On the Monitoring dashboard the State at Time tab displays an overview of the state of the system for any time in the past – useful for interrogating the system state before or during a process or system failure.
Its league tables
can be filtered by Date, Lookback (in seconds), Host Group, Alias and PID. Lookback averages data values over the lookback period. Specify the filter values and click Submit to update the display.
Sort table rows by any column by clicking on its heading.
Process CPU memory league table
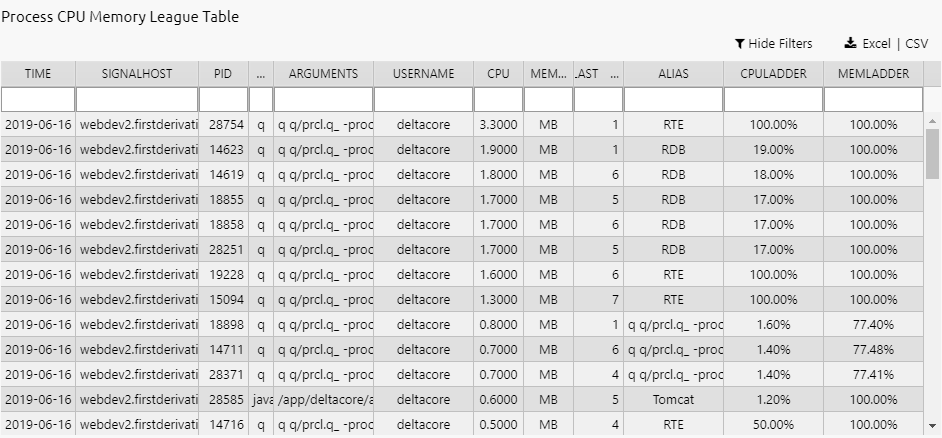
This table displays details of the processes using the most CPU and memory. (Processes using nominal levels are ignored.)
Information displayed:
| column | content |
|---|---|
| Time | Time the snapshot was taken. The frequency of updates is controlled by the Lookback seconds specified in the filters |
| SignalHost | Name of the host group |
| PID | Process ID |
| Name | Type of process, e.g. q, Java |
| UserName | User running the process |
| CPU | Percentage of CPU being used by the process |
| Memory | Amount of memory, in Mb, being used by the process |
| lastCore | Last CPU core the process was recorded to have run on |
| alias | Identifier for the connection: in many cases, a work station to the Tomcat, for which you will see a machine name |
Network connections league table
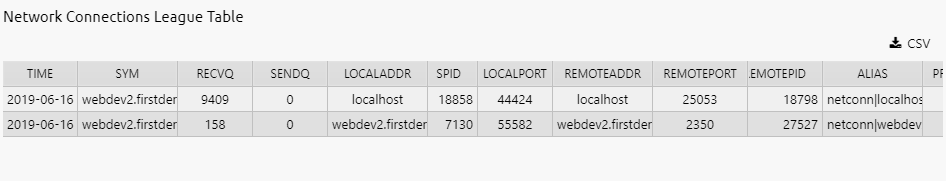
This table shows all network connections on the monitored hosts. This includes the source and remote address, ports, the length of their send and receive queues, and alias information.
| column | content |
|---|---|
| Time | Time the network connections snapshot was taken |
| sym | Host name |
| recvQ | Receive queue size |
| sendQ | Send queue size |
| localaddr | Local address |
| spid | Process ID associated with the queues |
| localport | Local port connection point |
| remoteaddr | Remote address |
| remoteport | Remote port connection point |
| alias | A combination of fields to identify the connection to the process instance displayed: in many cases, a work station to the Tomcat, for which you will see a machine name |
| state | State of the connection, usually established |
| processAlias | Process connection name or an alias that it is known by |
Server memory league table
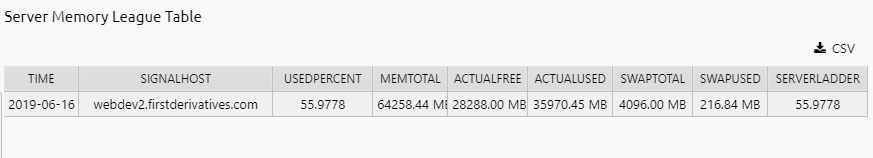
This table displays server memory stats for all servers in the system – useful for identifying the servers using the most memory.
The information displayed:
| column | content |
|---|---|
| Time | Time memory server table was updated |
| signalHost | Name of the host |
| UsedPercent | Amount used |
| memTotal | Total memory (Mb) |
| actualFree | Actual free memory (Mb) including buffer cache |
| actualUsed | Actual amount of memory used (Mb), including allocated cache |
| swapTotal | Size of the swap memory partition (Mb), the virtual memory stored on disk |
| swapUsed | Amount of swap memory used (Mb) |
CPU core league table
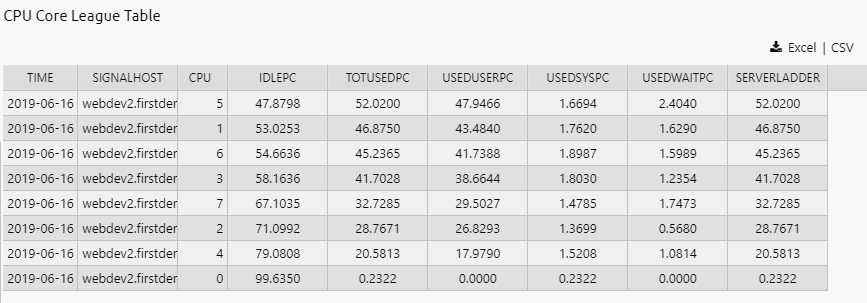
Ths table displays the CPU cores used most actively for all servers defined within the system, displaying individual statistics for all CPUs in each server.
The information displayed:
| column | content |
|---|---|
| Time | Time the CPU core league table was updated |
| signalHost | Host name that the cpu data applies to |
| cpu | CPU |
| IdlePC | Percentage of CPU capacity idle |
| TotUsedPC | Percentage of CPU capacity in use |
| UsedUserPC | Percentage of CPU capacity in use by users |
| UsedSysPC | Percentage of CPU capacity in use by the system |
| UsedWaitPC | Percentage of CPU capacity in wait state, idle with at least one input or output operation in progress |
File system league table
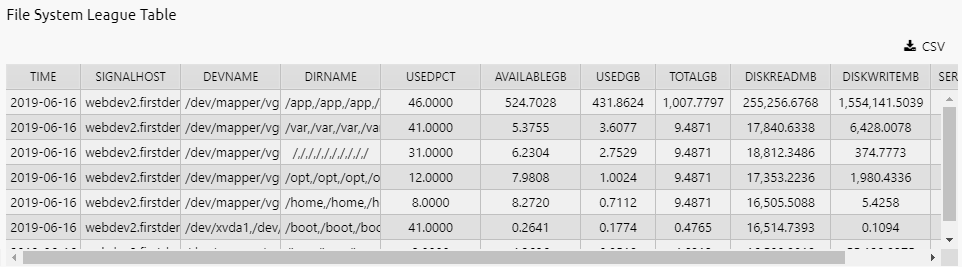
This table displays file-system usage statistics for all servers defined within the system.
The information displayed:
| column | content |
|---|---|
| Time | Time the file-system league table snapshot was taken |
| signalHost | Host this item relates to |
| devName | File system being analyzed |
| usedPct | Percentage of the file system used |
| availableGB | Space available on the filesystem (Gb) |
| usedGB | Space used on the file system (Gb) |
| totalGB | Space on the file system (Gb) |
| diskReadMB | Read-only space on the file system (Mb) |
| diskWriteMB | Read-write space on the file system (Mb) |