Query log
On the KX Monitoring dashboard the DeltaOps dxQueryLog screen shows summary statistics on queries running on each kdb+ process in the system that has the query logging turned on.
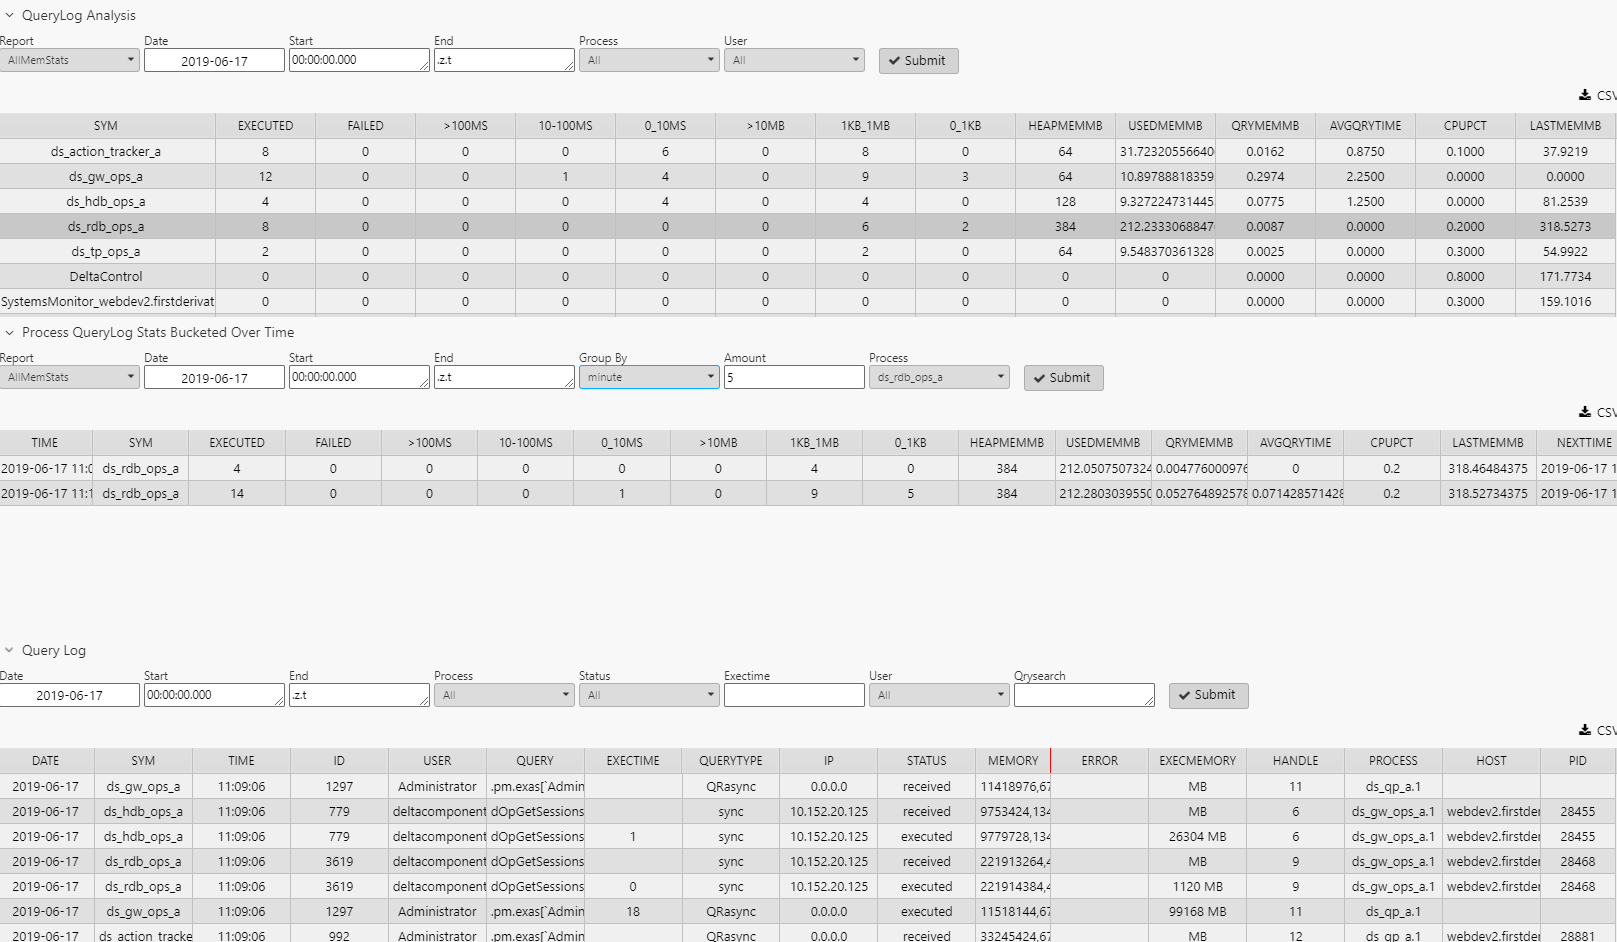
QueryLog analysis
The QueryLog analysis displays queries that have been received by processes. Filter the tabulated information with the following controls:
| control | filters |
|---|---|
| Report | a report from the dxQueryLog table |
| Date | date of log |
| Start | start time |
| End | end time |
| Process | process name |
| User | user name |
Set all filter criteria and click Submit. Among the information displayed:
| column | content |
|---|---|
| sym | process name |
| Executed | number of executed queries |
| Failed | number of failed queries |
| >100ms | number of queries taking more than 100ms to return |
| 10-100ms | number of queries taking between 10 to 100 ms to return |
| 0-10ms | number of queries taking between 0 to 10 ms to return |
| >10MB | number of queries taking more that 10Mb memory |
| 1kb_1MB | number of queries taking between 1kb and 1Mb of memory |
| 0_1KB | number of queries taking less than 1kb memory |
Process querylog stats bucketed over time
The Process QueryLog Stats Bucketed Over Time displays process-level statistics for all queries received by processes. Statistics are shown in a time-series grid, bucketed according to the grouping selected. this populates when a process is selected from the QueryLog Analysis section.
One Report option is TimeAndMemProfile, which displays QryTime (ms) and QryMemMB (Mb) grouped into small, medium and large buckets.
Filter the information displayed with the following controls:
| control | filters |
|---|---|
| Report | a report from the dxQueryLog table |
| Date | date of log |
| Start | start time |
| End | end time |
| Group By | hour, minute, or second |
| Amount | corresponding number for Group By; e.g. to group by 5 minutes, set Group By to minute, and Amount to 5 |
| Process | process name |
Among the information displayed:
| column | content |
|---|---|
| time | time the reading was taken |
| sym | process name |
| Executed | number of executed queries |
| Failed | number of failed queries |
| >100ms | number of queries taking more than 100ms to return |
| 10-100ms | number of queries taking 10 to 100 ms to return |
| 0-10ms | number of queries taking between 0 to 10 ms to return |
| >10MB | number of queries taking more that 10Mb memory |
| 1kb_1MB | number of queries taking between 1Kb and 1Mb of memory |
| 0_1KB | number of queries taking less than 1Kb memory |
Query log
Details of all queries made for the selected period.
Filter the information displayed with the following controls:
| control | filters |
|---|---|
| Date | date of query |
| Start | start time of query peiod |
| End | end time of query period |
| Process | process instance name |
| Status | Success/Failure of the query |
| Exectime | minumum execution time for queries (ms) |
| User | user name |
| QrySearch | string to be found in queries |
Set filter criteria and click Submit. The information displayed:
| column | content |
|---|---|
| date | date query was made |
| sym | process instance queried |
| time | time query was made |
| id | query ID |
| user | user who made the query |
| query | query that was made against process instance |
| exectime | execution time for the query |
| querytype | async or sync |
| ip | IP address from which the query was made |
| status | status of the query |
| memory | memory in bytes required to execute the query |
| error | if status is failed, the error message |
| execmemory | memory required for the result set |
| handle | handle query executed over |
| process | name of process instance |
| host | host name of the process instance |
| pid | process ID |