Architecture
KX Monitoring runs on a central server and monitors the status of satellite servers.
A KX Monitoring installation has
- a single KX Control host, which runs KX Stream, storing and processing statistical information;
- a Control Daemon on the central server and each satellite server for stats collection
- a KX Dashboards installation for the UI layer, (it can share the central server) providing visualizations of Monitoring data
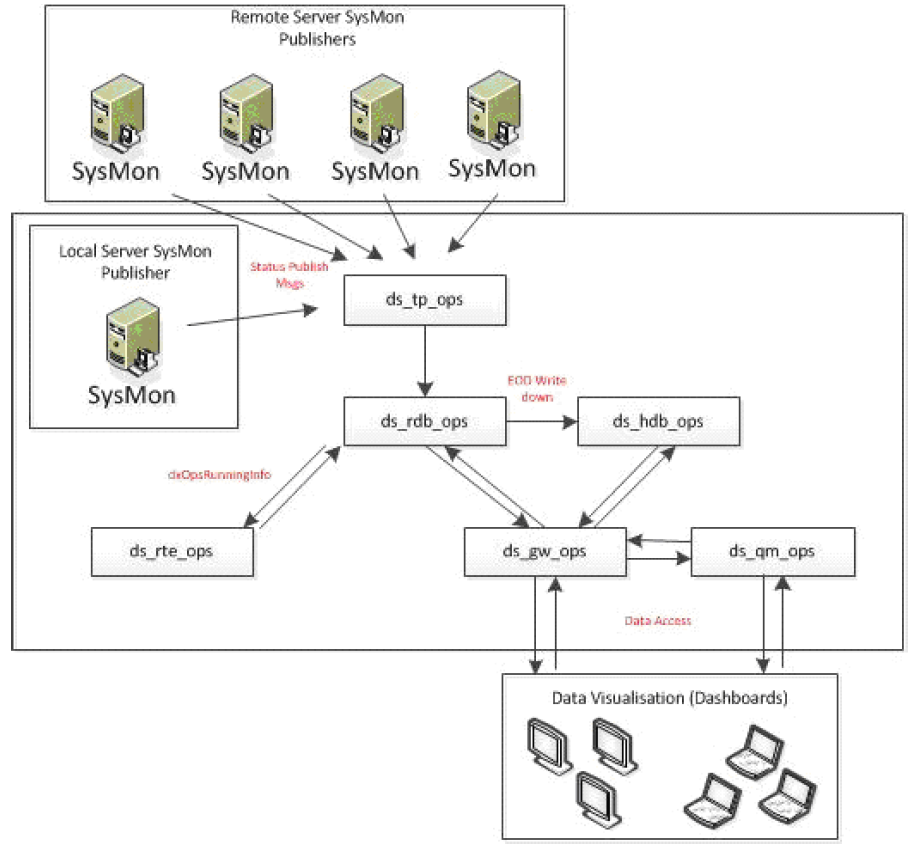
SysMon
Each server requires a SysMon Java application installed and running to collect server and process stats.
SysMon is part of the Control Daemon package. It is run from a start script and is a Java-based executable that collects server and process information.
It requires a valid KX Delta Platform license to run.
On a timer basis, it publishes table information to the Ops Tickerplant, the details of which are obtained from the DM_SYSMON_CONFIG parameter, which has no default value. This parameter can be viewed and updated from the KX Control UI or a Dashboard within KX Monitoring.
Any functionality detailed in the Monitoring dashboards that relates to server memory or CPU utilization statistics requires a running SysMon process publishing relevant stats to the Ops Tickerplant process.
SysMon libraries
SysMon can be configured to use one of two libraries for gathering server and process information.
DM_SYSMON_CONFIG parameter monAgent field allows the user to configure the default of OSHI or SIGAR.
OSHI
OSHI is an Operating System and Hardware information library. From version 4.6.0 it has become the default library used for SysMon to gather server and process information.
OSHI is seen by many as a one-to-one replacement of SIGAR. With a range of features and API available, it is able to retrieve information at a server and process level across multiple operating systems.
SIGAR
Alternatively SysMon may be configured to use the SIGAR library. The shell and commands are implemented in Java and include implementations of well-known commands such as:
arp, df, du, free, ifconfig, iostat, netstat, nfsstat, ps, route, top, ulimit, uptime, who
| Linux command | action |
|---|---|
arp -an |
display system ARP cache |
df -h –a /(df –i) |
report filesystem disk space usage/(inode) |
du -s –b |
display usage for a directory recursively |
netstat –r or route |
kernel IP routing table |
top or iostat |
CPU statistics |
cat /proc/cpuinfo |
CPU info |
free |
system memory |
cat /proc/mtrr | head -1 |
system random access memory (in Mb) |
netstat |
net connections and statistics |
ifconfig |
network interface configuration and statistics |
route –n |
network routing |
top & ps |
process credentials, statistics, state, time and memory |
ls -l /proc/<PID>/exe |
process execution instructions |
lsof |
process file descriptors |
free |
swap |
vmstat |
swap page in/out |
uptime |
server uptime |
who & w |
users logged on and what they are doing |
License and warranty
SIGAR is free software; it can be redistributed and/or modified under the terms of version 2 of the GNU General Public License as published by the Free Software Foundation. SIGAR is distributed in the hope that it will be useful, but without any warranty; not even the implied warranty of merchantability or fitness for a particular purpose.
SIGAR Maintenance
SIGAR library has not been actively maintained since 2010. Because of this, SIGAR has been known to have issues with recent Operating System and JAVA versions
Installation
KX Monitoring is installed as part of a KX Delta Platform installation and when licensed will automatically run the necessary workflows to capture all monitoring data. To install the KX Delta Platform review the Deployment guides.
For full environment coveage as well as the main KX Monitoring installation, a satellite daemon will need to be installed on all servers wishing to be monitored. This can be done via a Daemon Only install, again review the Deployment guides for full details.
Disabling Monitoring
You can disable KX Monitoring, by setting delta.daemon.sysmon to false in the config parameter systemProperties:DEFAULT using the Control UI.
Post-installation checks
- Is the Control Daemon process running on all the satellite servers?
-
Are the processes in the following workflows running? Check through the Process Library Status view in the KX Control UI
- DS_launch_ALERT_A
- DS_launch_OPS_A
- DS_launch_ALERT_B
- DS_launch_OPS_B for redundancy
-
Check the Monitoring dashboard shows the Control Daemon running on each satellite server.
- Check the Server Memory League Table pane on the State At Time tab within the Monitoring dashboard shows each of the server groups that have been set up.
-
Check that the following tabs are populating for all satellite servers:
- Server Details
- Process Details
- State At Time
Users
At initialization there is a single Monitor administrator user; DeltaMonAdministrator, which can be used to log in and view data. After installation, remove this user and create new administrator users.
Add further Monitoring users through the KX Control UI. To ensure access to the Monitoring dashboards and data, include new users in the DeltaMonUsers user group.
Further permissions can be granted these users. For example, you can use permissions to specify whether or not users have the ability to view or edit the Monitoring configuration.
Monitoring dashboard
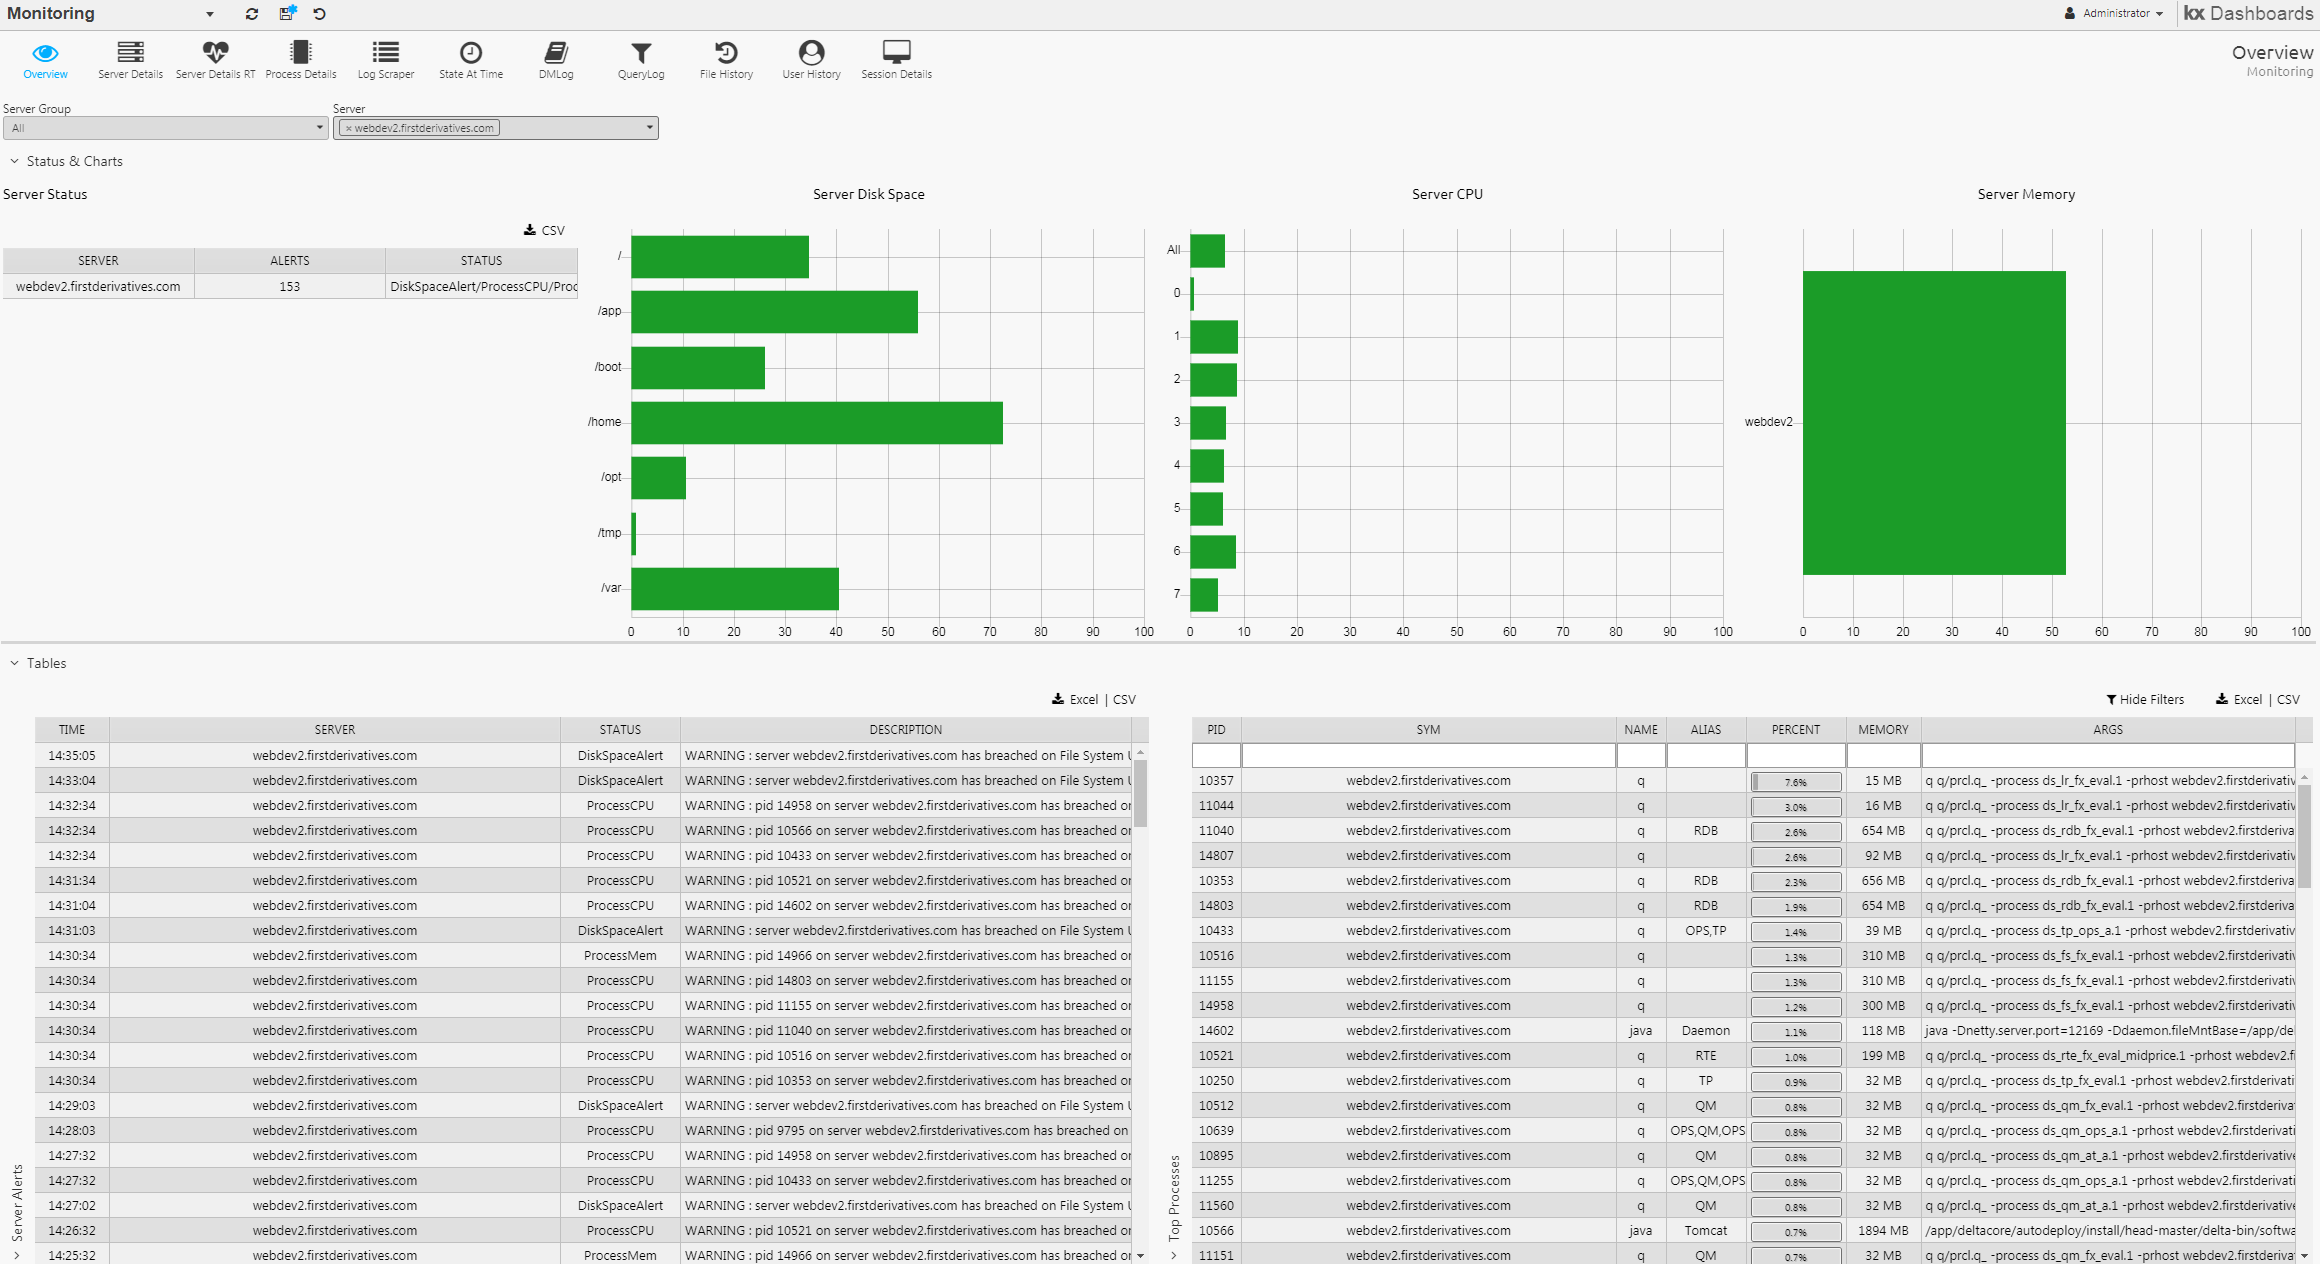
The main dashboard loads on login. It has the following tabs.
| tab | content |
|---|---|
| Overview | Current state of the system, an aggregated view across all processes running on all servers |
| Server Details | Tools for the investigation of a problem with a server, specifically CPU usage, memory usage and network cards |
| Process Details | Tools for the investigation of a problem with a process, specifically CPU usage, memory usage and network connection issues |
| State at Time | Where Overview displays an overview of the current state of the system, this displays it for any point in the past |
| DMLog | Manages queries on the dxLog and dxAccessLog tables (requires that you have turned publishing on for them) |
| QueryLog | Summary statistics on queries running on each kdb+ process within the system which has the query logging turned on |
| Log Scraper | Log scraping is configured through the Monitoring_Config dashboard and is used to specify the files and directories to be scraped, and the search pattern to be used |
Monitoring config dashboard
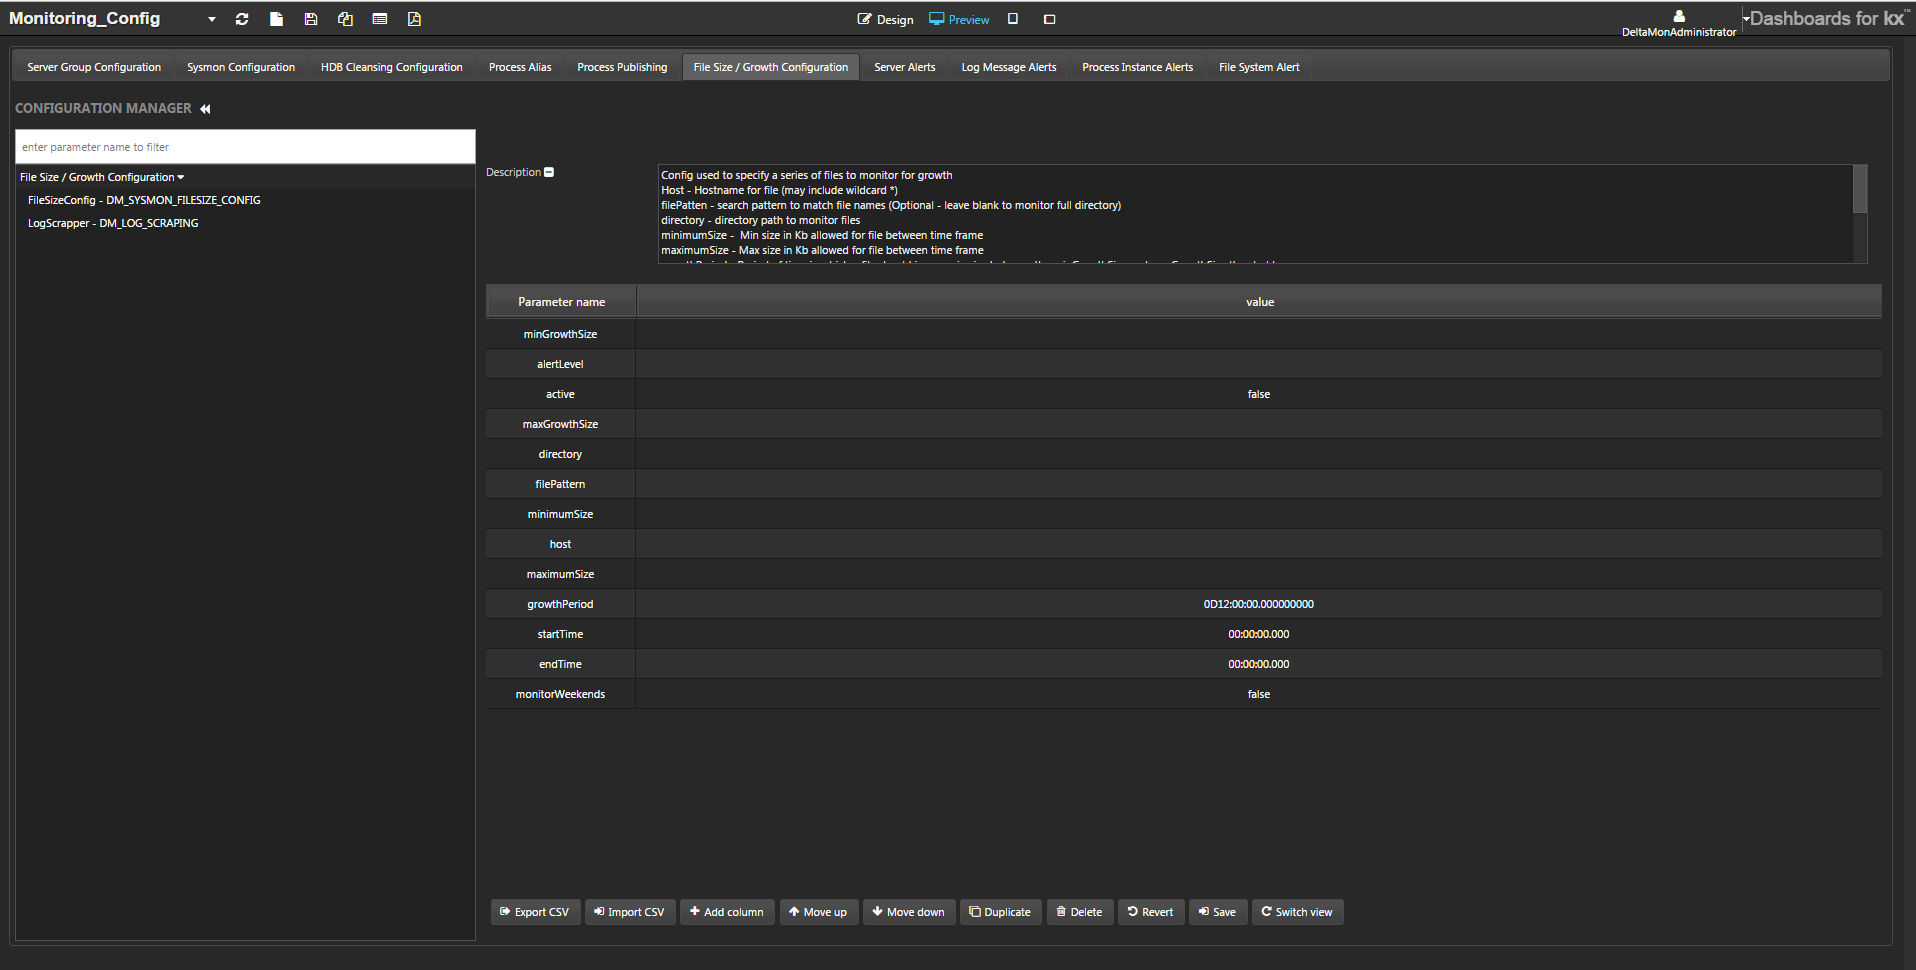
The Monitoring Config dashboard provides the tools to configure KX Monitoring and is used to configure the alerts to receive.