DMLog
On the KX Monitoring dashboard the DMLog screen manages queries on the dxLog and dxAccessLog tables. (You must have turned on publishing of dxLog and dxAccessLog.)
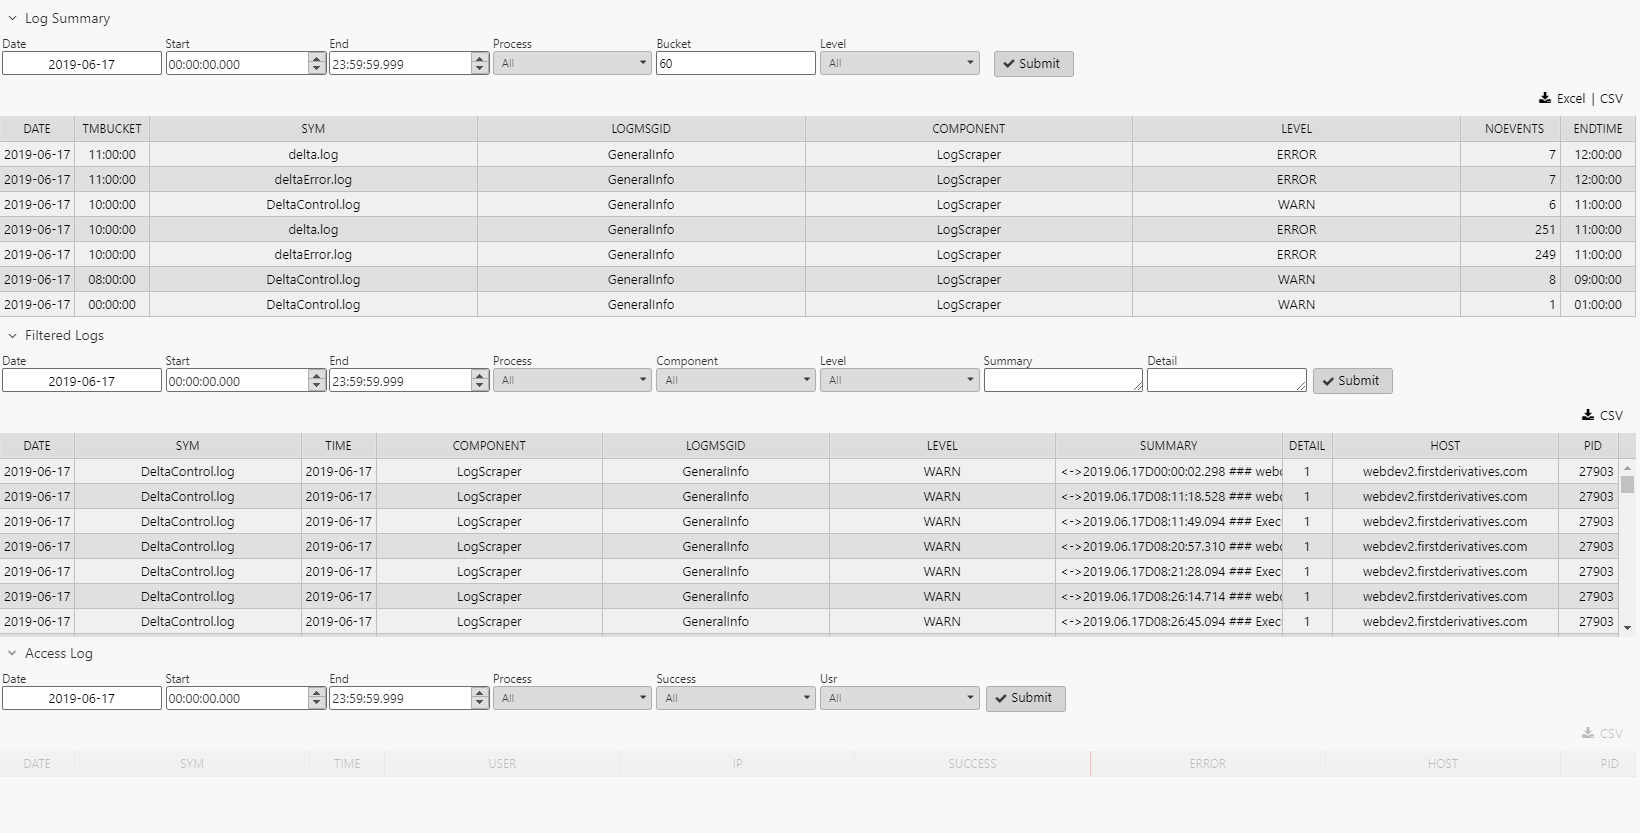
Log summary
This panel summarizes the number of log events per hour for each process. dxAccessLog messages are published from processes that have accesslog configured.
Process Publishing
Refine the displayed results with filters:
| control | filter |
|---|---|
| Date | date for which to query dxLog |
| Start Time | start time of the query |
| End Time | end time of the query |
| Process | process that would publish the log messages. |
| Bucket (mins) | size of the time buckets in which to group the returned dataset |
| Level | (optional) view all messages or just WARN, ERROR or INFO |
Set filter criteria and click Submit. The following information is tabulated:
| column | content |
|---|---|
| date | date the messages were written |
| TmBucket | start time of the bucket |
| sym | process instance that created the log message |
| logmsgId | log message ID |
| component | where the message was created |
| level | level of logging: warning, error, or info |
| NoEvents | number of log messages |
| endtime | end time of the bucket |
Filtered logs
This table displays log messages based on the filters specified.
Results can be refined with the filters:
| control | filters |
|---|---|
| Date | date of log messages |
| Start | starting time of query period |
| End | end time of query period |
| Process | process that published log messages |
| Component | component that published log messages (varies by component) |
| Level | (optional) view all messages or just WARN, ERROR or INFO |
| Summary | string to be found in the summary field of dxLog |
| Detail | string to be found in the detail field of dxLog |
Set filter criteria and click Submit. The following information is tabulated:
| column | content |
|---|---|
| date | date message was written |
| sym | process instance that wrote the message |
| time | time message was written |
| component | component that wrote the message |
| logmsgId | message ID |
| level | level of logging: WARN, ERROR, or INFO |
| summary | log message |
| detail | detail that triggered the message |
| host | host name of the process instance |
| pid | process ID |
Access log
Details of all connections made or attempted in the selected period. Select connections using the filters:
| control | filters |
|---|---|
| Date | date of connection |
| Start | starting time of query period |
| End | end time of query period |
| Process | process that was connected to |
| Success | All, Successful, or Unsuccessful attempts to connect |
| User | user attempting connection |
Set filter criteria and click Submit. The following information is tabulated:
| column | content |
|---|---|
| date | date of connection attempt |
| sym | process instance |
| time | time of access attempt |
| user | user |
| ip | user’s IP address |
| success | success or failure |
| error | if failure, the error message |
| host | host name of the process instance. |
| pid | process ID |