Process details
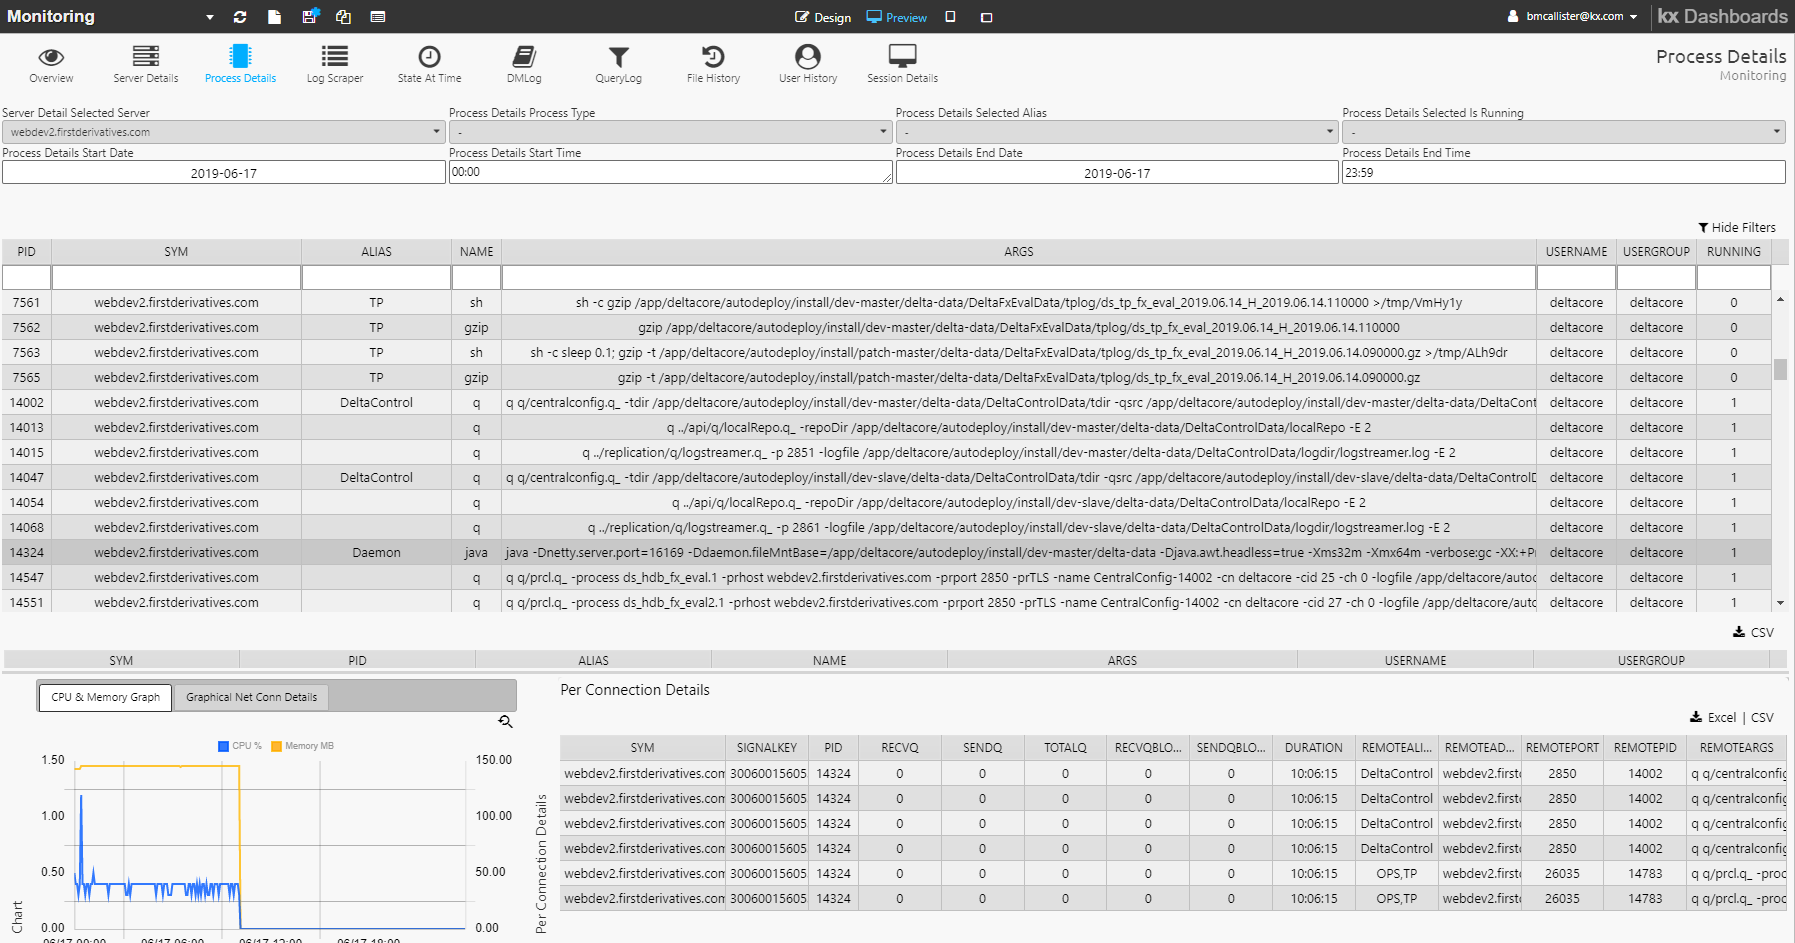
On the KX Monitoring dashboard the Process Details tab provides tools for the investigation of problems with a process, specifically with regard to CPU usage, memory usage or network connection issues.
On this dashboard:
- Process Details selector, used to filter processes
- Process Details, information about the selected process
- CPU, Memory & Network Info, detailed process information
Process details selector
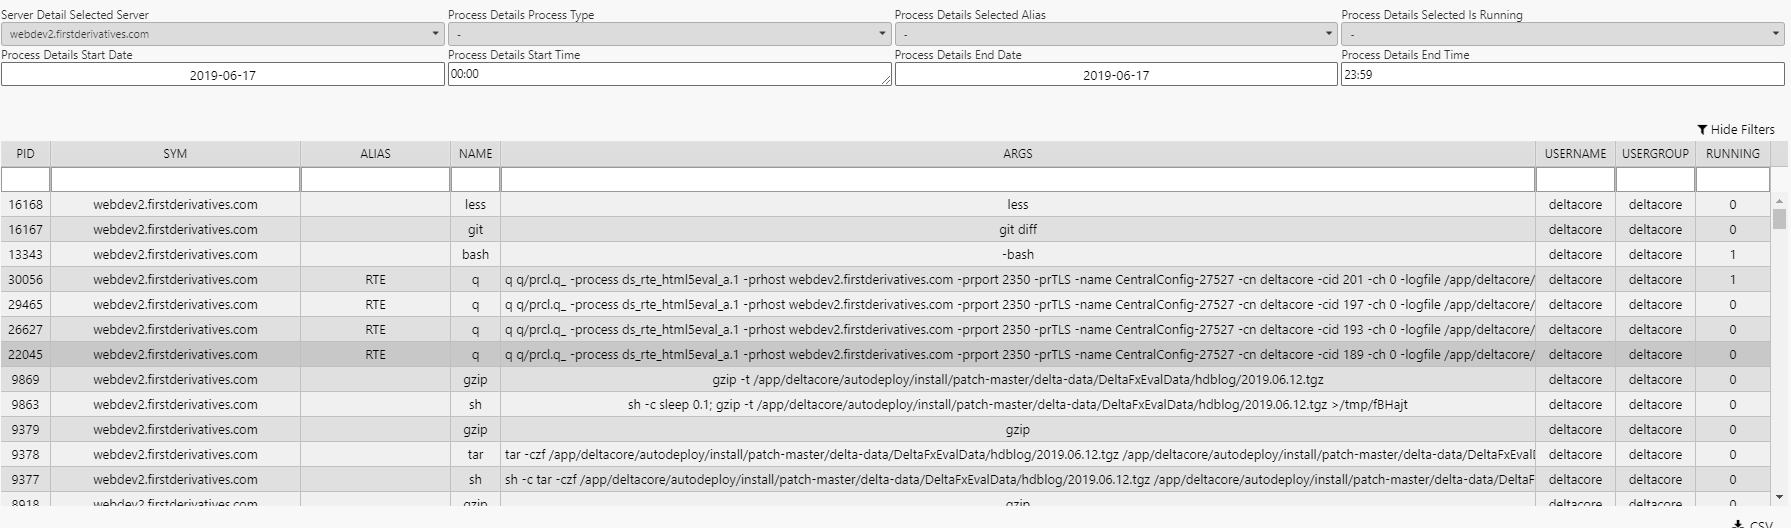
Use the selector table at the top of the dashboard to find processes of interest.
Double-click on any process in the table to populate the other sections of the dashboard.
The information displayed:
| column | content |
|---|---|
| SYM | Name of the host group |
| NAME | Type of process:,e.g. q, java, fix, run.sh |
| USERNAME | User who started the process |
| USERGROUP | User group the user belongs to |
Selecting a process from the table will populate the screen with further information on the process for the time range.
CPU and memory graph
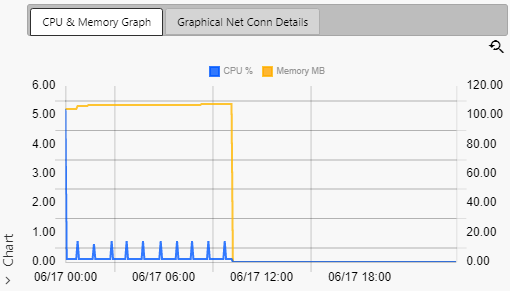
Displays a historical time-bucketed view of the process memory and CPU usage
Graphical net conn details
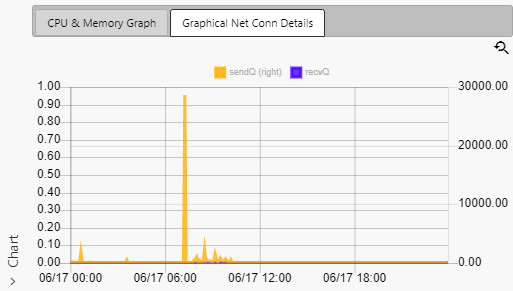
Displays a historical time-bucketed view of the number and aggregate queue size of the network connection details
Per connection details
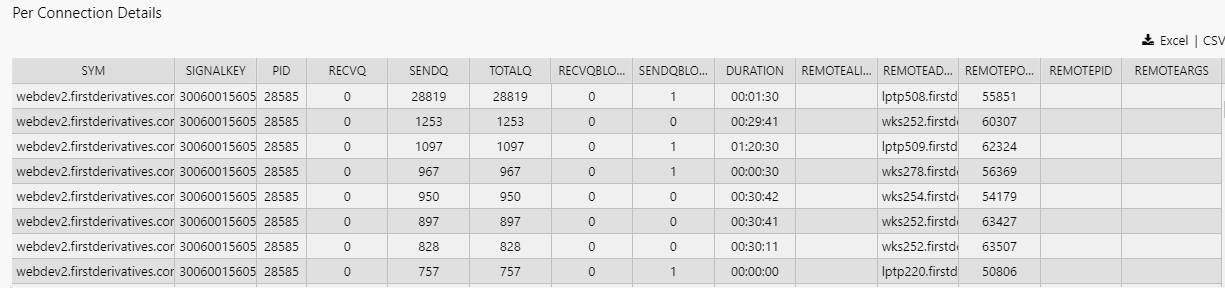
Displays the following details of the connections a process has open.
| column | content |
|---|---|
| RECVQ | Receive queue size |
| SENDQ | Send queue size |
| TOTALQ | Total queue size |
| RECVQBLOCKED | Number of times the receive queue has been blocked: a connection is deemed blocked if the queue size exceeds a threshold determined by the Queue Size parameter |
| SENDQBLOCKED | Number of times the send queue has been blocked |
| PID | Process ID |
| REMOTEARGS | Process arguments, which provide additional details about the running process |