Add a Map to a View
This section takes you through the steps to add a Map to your View to visualize weather data.*
Prerequisite
You need a Google Maps API Map Key to use the Maps component. Learn more about {Google Map Keys}(https://developers.google.com/maps/documentation/javascript/get-api-key).
1. Add Map component
To add a Map to a View:
-
Create the view
insights-demo-view, as described in the Views walkthrough. -
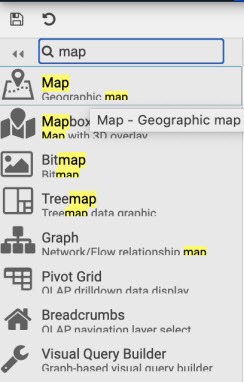
Search for the Map component in the left-hand list of components and drag into the workspace.
-
With the map component selected, (it has a light blue border when active), update the properties of the Map section:
-
Click set Google Maps JavaScript API Key in
Map KeyProperty. This allows you to save the map key as a View State inside your Map component.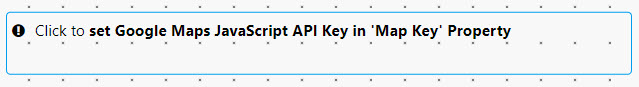
-
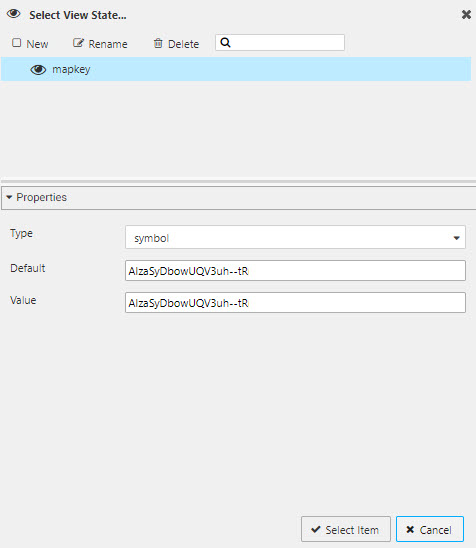
Provide a Google Maps API Map Key. This is saved as a View State parameter in your view.
-
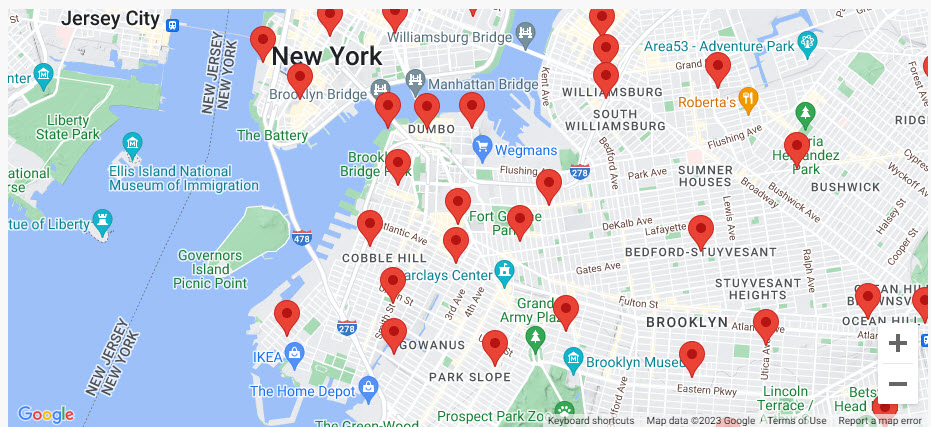
Centralize the map on New York with the following Map properties:
Setting Value CenterX 40.75CenterY -73.98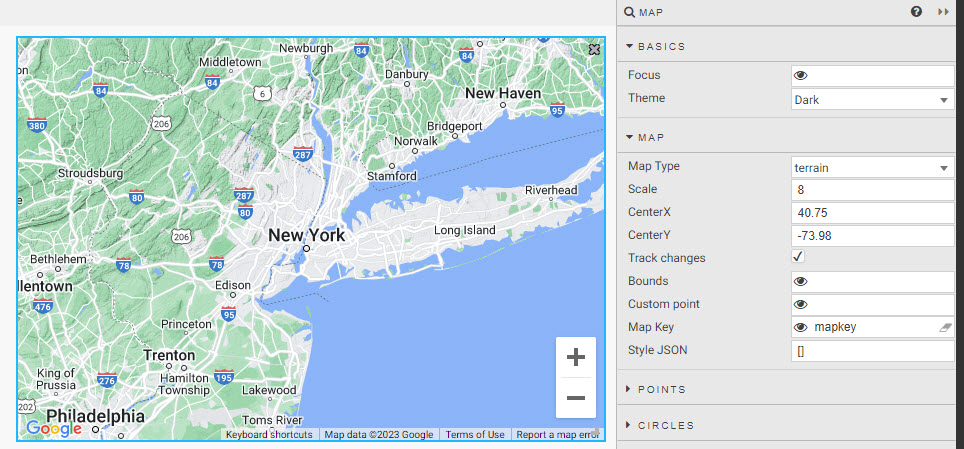
-
2. Configure the Data Source
Expand the Points properties and click Data Source.
-
Create a New data source.
-
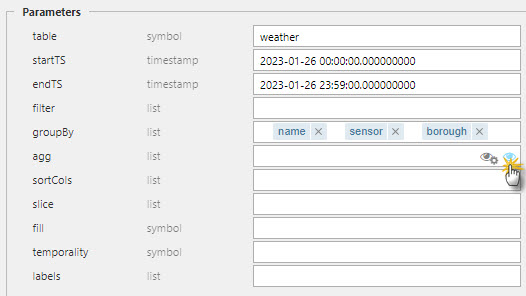
Click API in the data editor, and set:
Setting Value table weatherstartTS midnight of deployment date endTS 23:59 of deployment date groupBy name,sensor,borough. Must be of type List.agg see next step to create a View State -
Within agg, create a View State by rolling over the text input and clicking on the small, blue eye icon to the right.
-
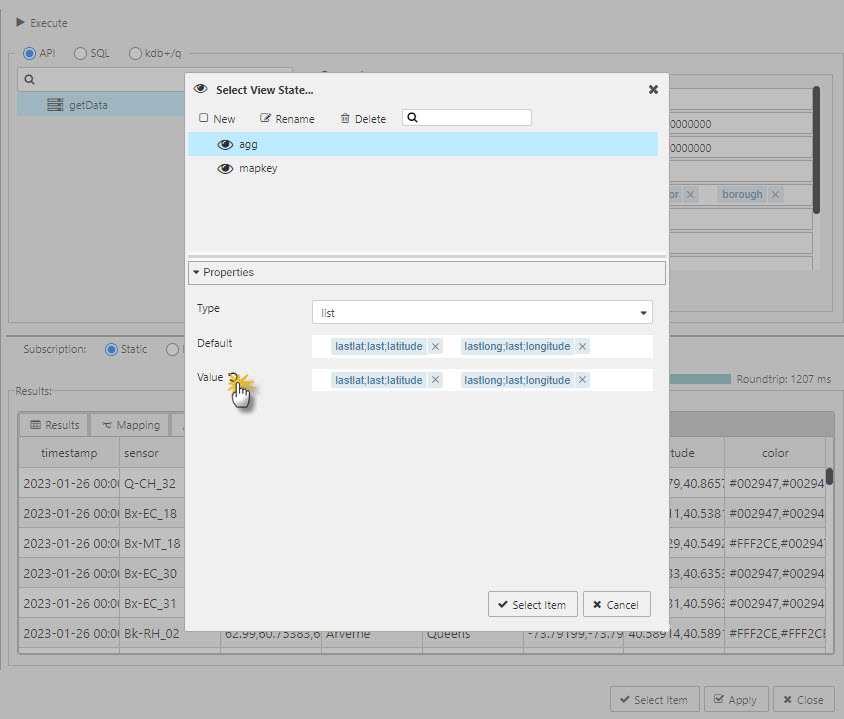
In the view state dialog, create a New view state and set type to List.
-
Set Default to
lastlat;last;latitudeandlastlon;last;longitude; tab across to add the second filter. -
Click the refresh icon next to Value to copy the default values to the Value property.
-
Click Select Item to apply the View State.
-
-
Click Apply and Select Item to apply the data source change to the map.
3. Configure the Map component
-
In the Points properties set:
Setting Value Latitude Data lastlat Longitude Data lastlong
The following Map showing sensor locations in New York is displayed.