Troubleshooting
Accessing Logs
Logs and diagnostics are easily viewable from within kdb Insights Enterprise.
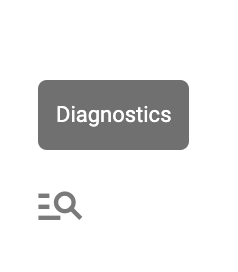
To access click the magnifying glass in the bottom left hand corner.
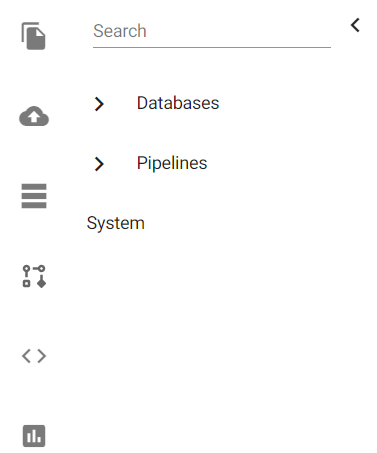
From here you have the option of viewing logs for specific Databases, Pipelines or System errors.
Databases & Pipelines
Let's start by taking a look at how you can troubleshoot issues within a database or pipeline.
This is particularly useful when a user is first building a database and also when you have a pipeline that is writing to a database that has errored.
Select the database or pipeline on the left hand side - in this example we select insights-demo database. You will see two tabs appear:
- Diagnostic Events
- Application Logs
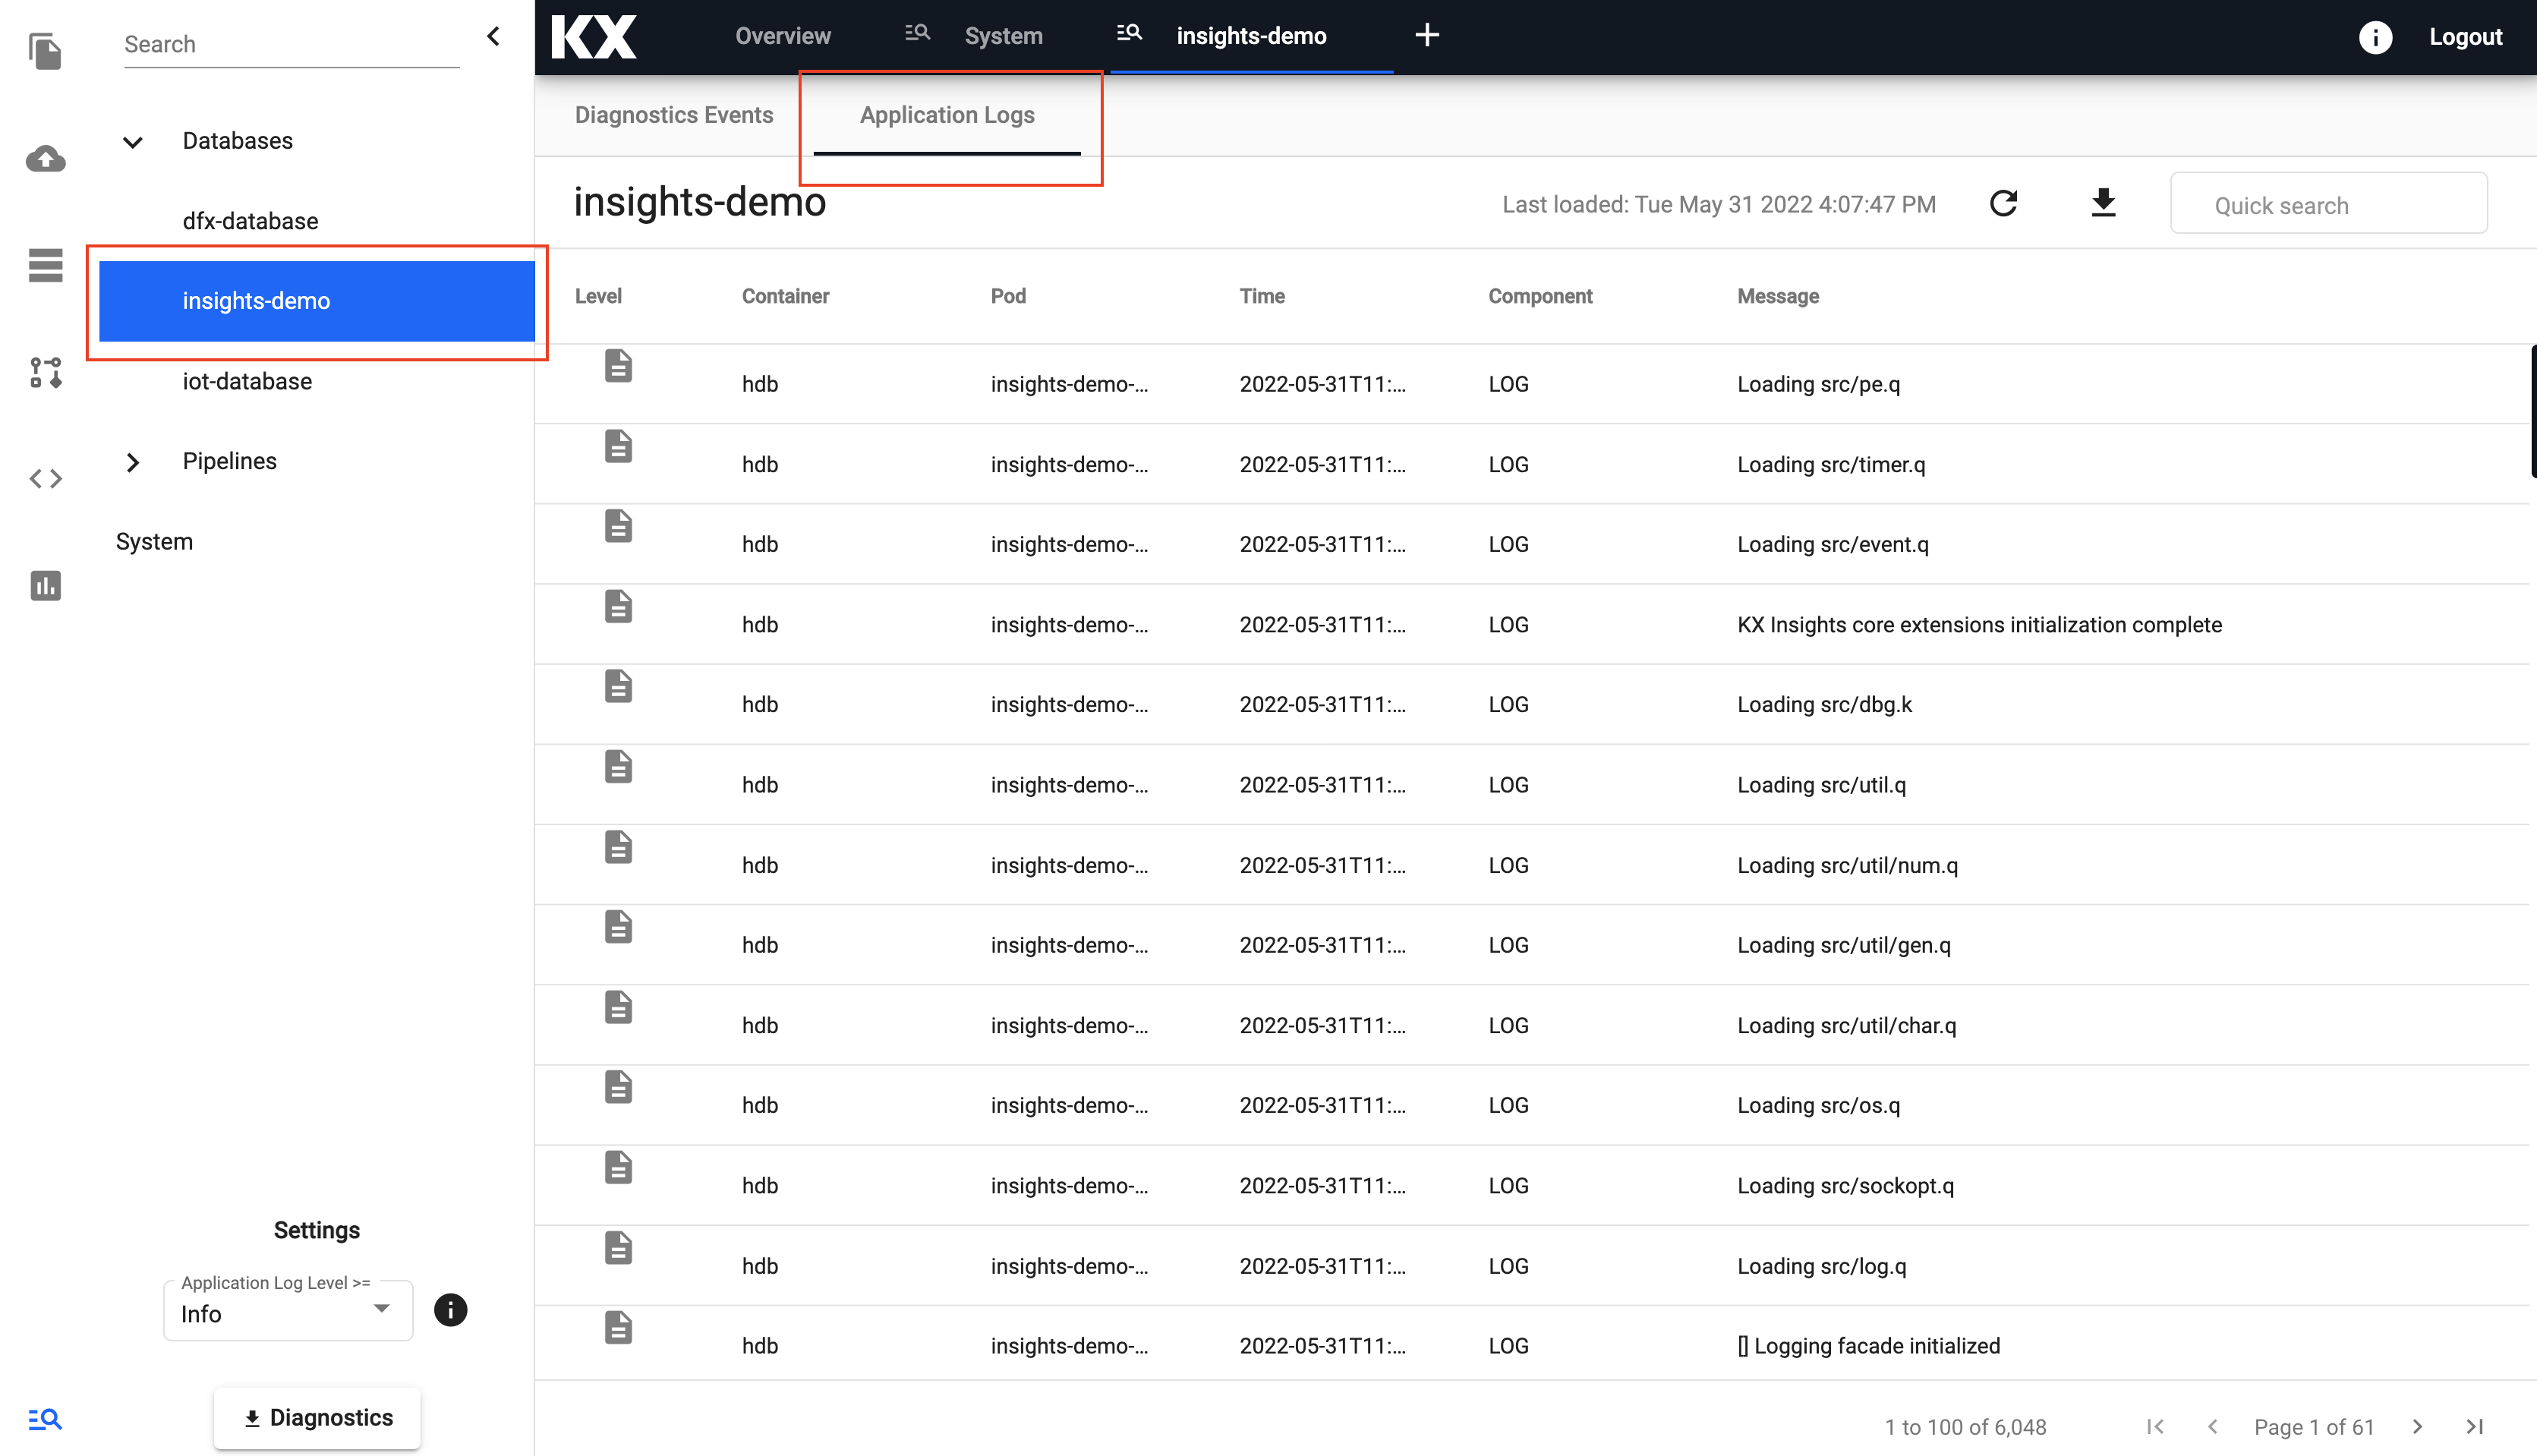
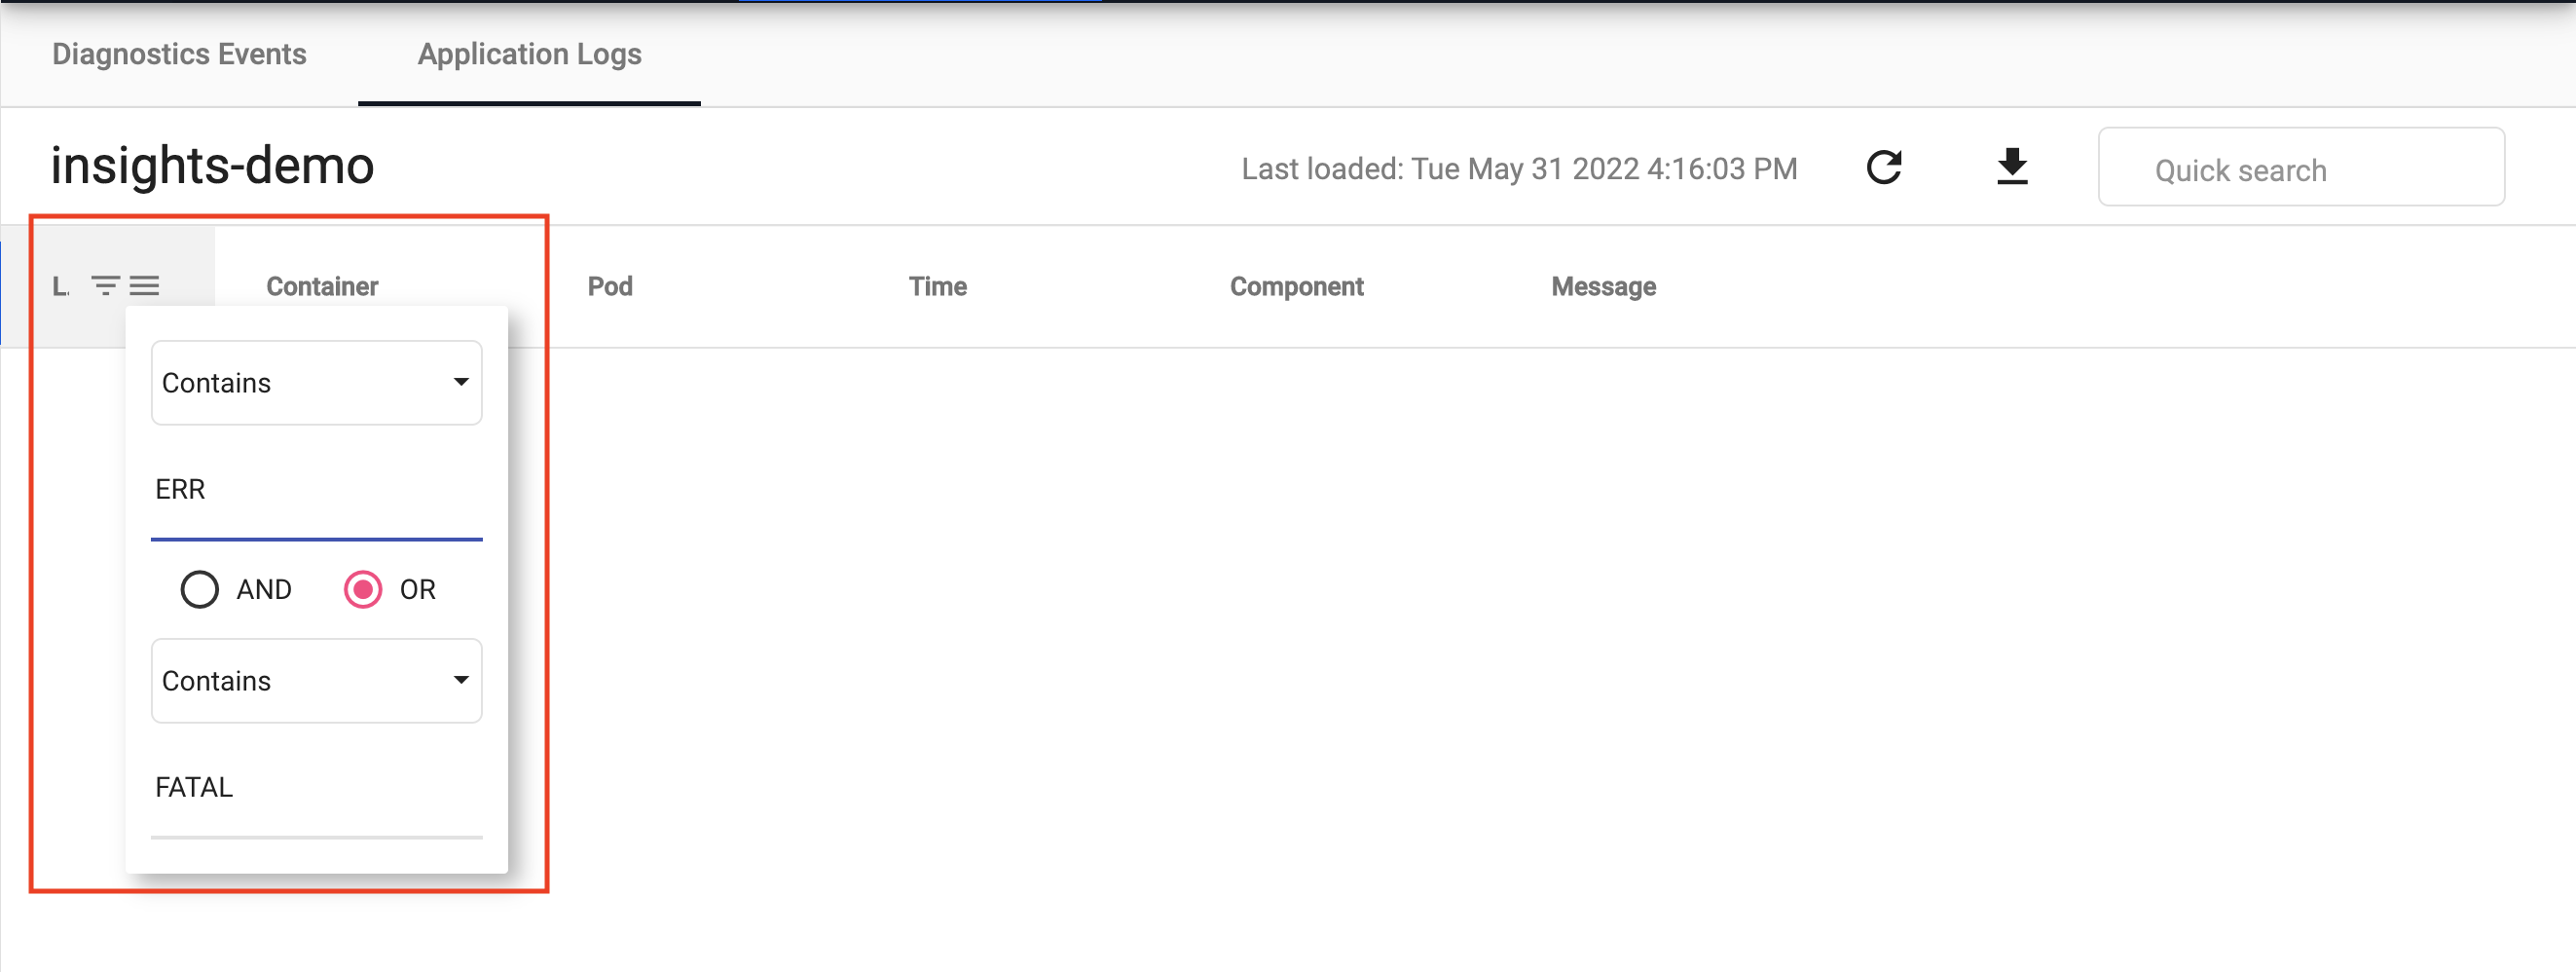
Click on Application Logs to investigate any existing errors. You can then hover over the name of the first column Level to filter only keywords that indicate errors.
ERR, FATAL and WARN are useful keywords to search on. You can tick OR to retrieve multiple types at once.
If there are any errors they will now appear in the screen. From this view you can also do useful things like:
- Copy error message to clipboard for easier viewing and sharing
- Download and export errors
- Search all messages in the database using the search bar
- Refresh messages to get the latest
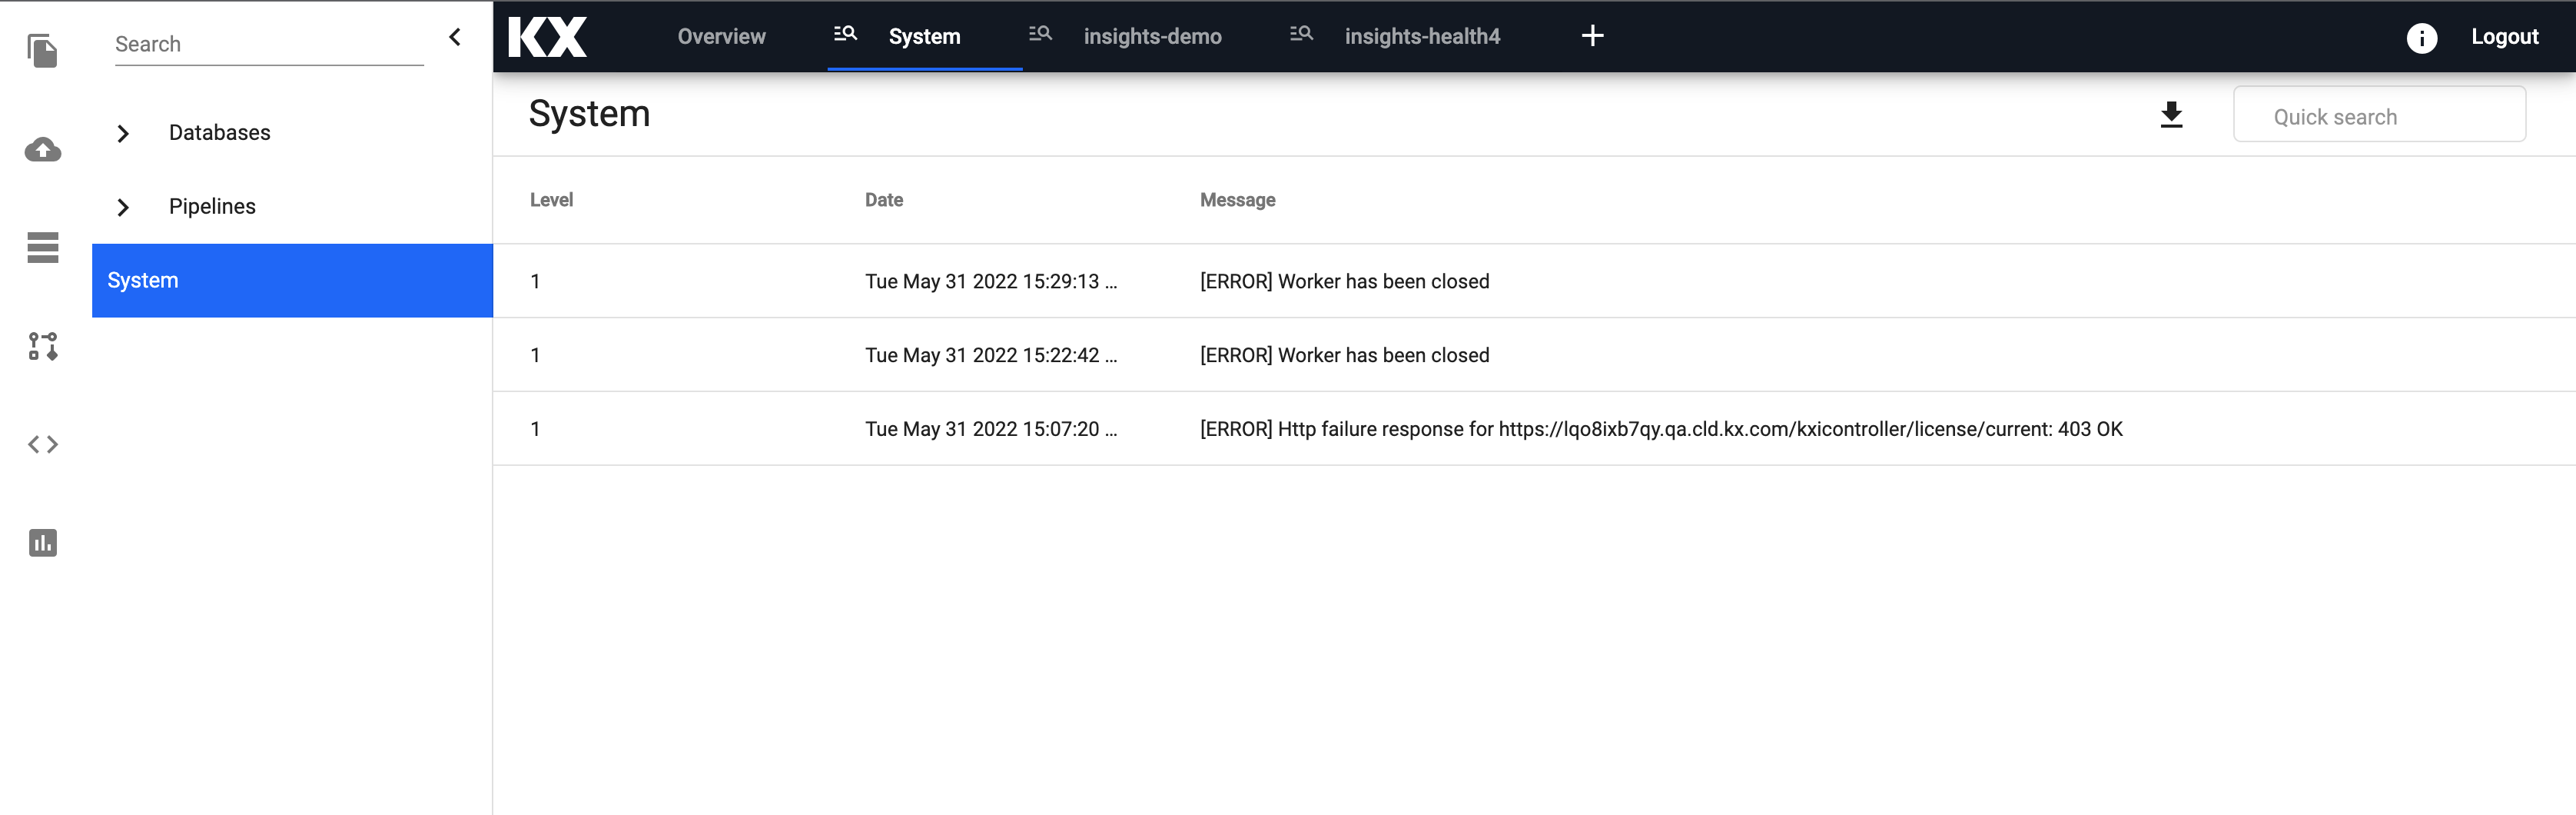
System Errors
System Errors appear as popups on the bottom of the screen. These are stored for easy retrieval in the System section of Diagnostics.