Playback
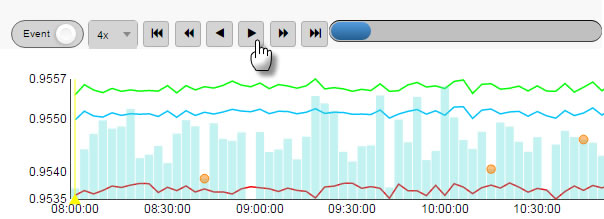
A Bar Chart with a Playback component
Replays time-series data in Data Grid and charting components
Set up
-
Set a data source with a time series component.
-
Assign a view state to Selected Value for selected time.
-
Set the Time Column from the data source.
-
Set the Interval Time to define update frequency on playback.
Basics
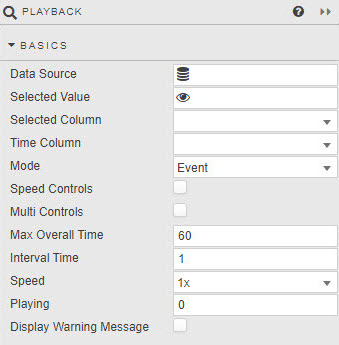
- Data Source
- A data source containing a time series (number, dates or timestamps), shared with the component being played back.
- Selected Value
- A View State Parameter for the time series.
- Selected Column
- An Integer or temporal column from the Data Source, used in playback sequence.
- Time Column
- A temporal column from the Data Source (can be the Selected Column).
- Mode
- Governs the rate of replay: in
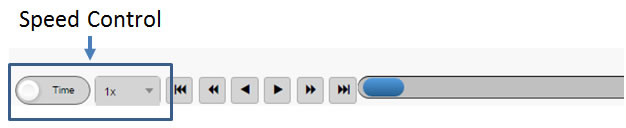
Eventmode, each event is one unit; inTimemode, units are temporal. - Speed Controls
-
When checked, offers a choice of replay speeds.
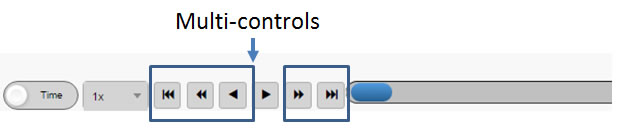
- Multi Controls
-
When checked, offers fast-forward and rewind.
- Max Overall Time
- Upper limit in data points (of the Time Column, e.g. seconds, nanaoseconds) for replay based on Selected Value View State Parameter.
- Interval Time
- Sampling interval of the Selected Value View State Parameter: values above
1will skip data points; e.g. a value of2will use every second data point of the Selected Value View State Parameter. - Speed
- Define default speed for playback.
- Playing
- Define for playback:
0is static,1plays forward,-1plays backwards. Multiples, e.g.4will play at x4 speed. - Display Warning Message
- Support messaging enabled.
Margins, Style and Format
Style for common settings