Machine Learning
Machine learning is a subset of Artificial Intelligence (AI) which focuses on using statistical techniques to build intelligent computer systems that can learn from data. This is done by training a model to identify patterns in input data Which it can use to assign a label to each data record.
The below are details of the nodes that may be required to perform machine learning efficiently. This includes nodes to perform the modeling itself and nodes to preprocess and re-arrange the data into a format that is conducive to modeling and gaining insights.
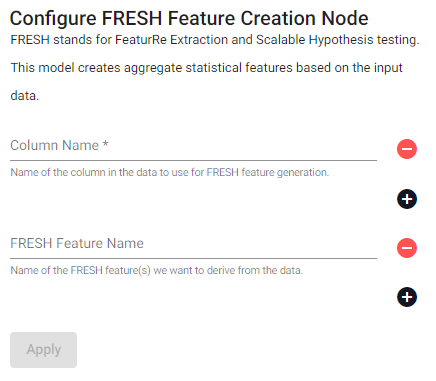
FRESH
FRESH stands for FeatuRe Extraction and Scalable Hypothesis testing.
FRESH Create
This model creates aggregate statistical features based on the input data; click [+] to add respective items.
| item | description |
|---|---|
| Column Name | Name of the column(s) in the data to use for FRESH feature generation. |
| FRESH Feature Name | Name of the FRESH feature(s) we want to define from the data. A full list of these features can be found here. |
Classification Models
The below classification models are a group of supervised learning models used to assign a class to a data record. This is done using a user-provided set of labeled data records (the features and their corresponding class values) to guide the model's predictions.
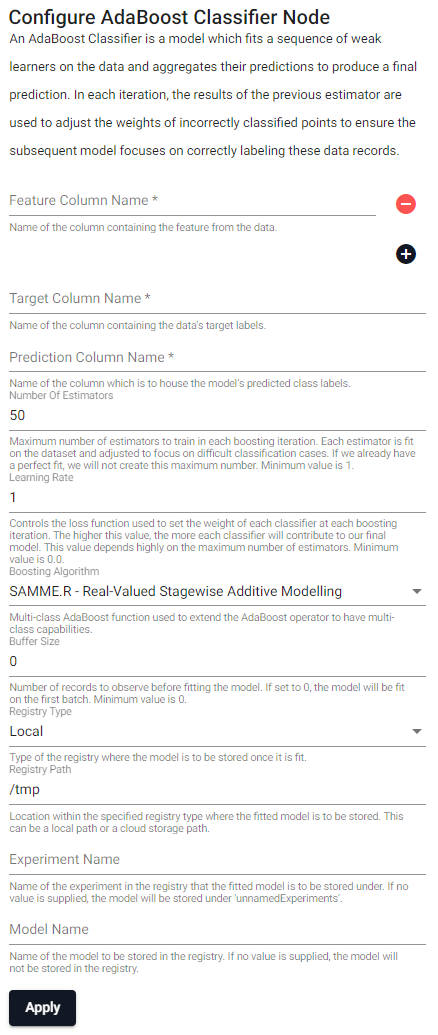
AdaBoost classifier
An AdaBoost classifier is a model which fits a sequence of weak learners on the data and aggregates their predictions to produce a final prediction. In each iteration, the results of the previous estimator are used to adjust the weights of incorrectly classified data records to ensure the subsequent model focuses on correctly labeling these records.
| item | description |
|---|---|
| Feature Column Name (click [+] to add) | Name of the column(s) containing the features from the data. |
| Target Column Name | Name of the column containing the data's target labels. |
| Prediction Column Name | Name of the column which is to house the model's predicted class labels. |
| Number Of Estimators | Maximum number of estimators to train in each boosting iteration. Each estimator is fit on the dataset and adjusted to focus on difficult classification cases. If we already have a perfect fit, we will not create this maximum number. Minimum value is 1. |
| Learning Rate | Controls the loss function used to set the weight of each classifier at each boosting iteration. The higher this value, the more each classifier will contribute to our final model. This value depends highly on the maximum number of estimators. Minimum value is 0.0. |
| Boosting Algorithm | Multi-class AdaBoost function used to extend the AdaBoost operator to have multi-class capabilities. |
| Buffer Size | Number of records to observe before fitting the model. If set to 0, the model will be fit on the first batch. Minimum value is 0. |
| Registry Type | Type of the registry where the model is to be stored once it is fit. |
| Registry Path | Location within the specified registry type where the fitted model is to be stored. This can be a local path or a cloud storage path. |
| Experiment Name | Name of the experiment in the registry that the fitted model is to be stored under. If no value is supplied, the model will be stored under unnamedExperiments. |
| Model Name | Name of the model to be stored in the registry. If no value is supplied, the model will not be stored in the registry. |
AdaBoost, Understanding the Adaboost Classification Algorithm
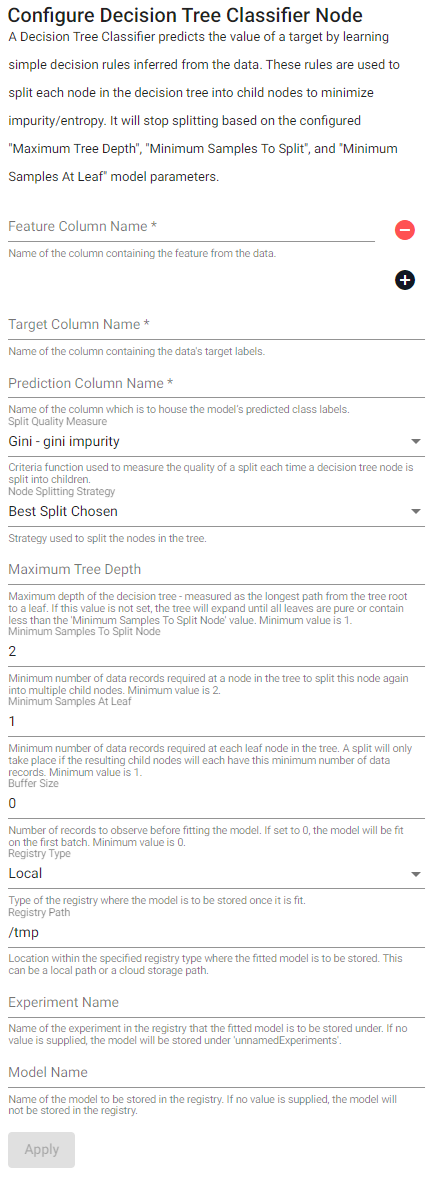
Decision tree classifier
A decision tree classifier predicts the value of a target by learning simple decision rules inferred from the data. These rules are used to split each node in the decision tree into child nodes to minimize impurity/entropy. It will stop splitting based on the configured Maximum Tree Depth, Minimum Samples To Split, and Minimum Samples At Leaf model parameters.
| item | description |
|---|---|
| Feature Column Name (click [+] to add) | Name of the column(s) containing the features from the data. |
| Target Column Name | Name of the column containing the data's target labels. |
| Prediction Column Name | Name of the column which is to house the model's predicted class labels. |
| Split Quality Measure | Criteria function used to measure the quality of a split each time a decision tree node is split into children. |
| Node Splitting Strategy | Strategy used to split the nodes in the tree. |
| Maximum Tree Depth | Maximum depth of the decision tree - measured as the longest path from the tree root to a leaf. If no value is supplied, the tree will expand until all leaves are pure or contain less than the Minimum Samples To Split Node value. Minimum value is 1. |
| Minimum Samples To Split Node | Minimum number of data records required at a node in the tree to split this node again into multiple child nodes. Minimum value is 2. |
| Minimum Samples At Leaf | Minimum number of data records required at each leaf node in the tree. A split will only take place if the resulting child nodes will each have this minimum number of data records. Minimum value is 1. |
| Buffer Size | Number of records to observe before fitting the model. If set to 0, the model will be fit on the first batch. Minimum value is 0. |
| Registry Type | Type of the registry where the fitted model is to be stored. |
| Registry Path | Location within the specified registry type where the fitted model is to be stored. This can be a local path or a cloud storage path. |
| Experiment Name | Name of the experiment in the registry that the fitted model is to be stored under. If no value is supplied, the model will be stored under unnamedExperiments |
| Model Name | Name of the model to be stored in the registry. If no value is supplied, the model will not be stored in the registry. |
Decision Tree Classifier explained in real-life: picking a vacation destination.
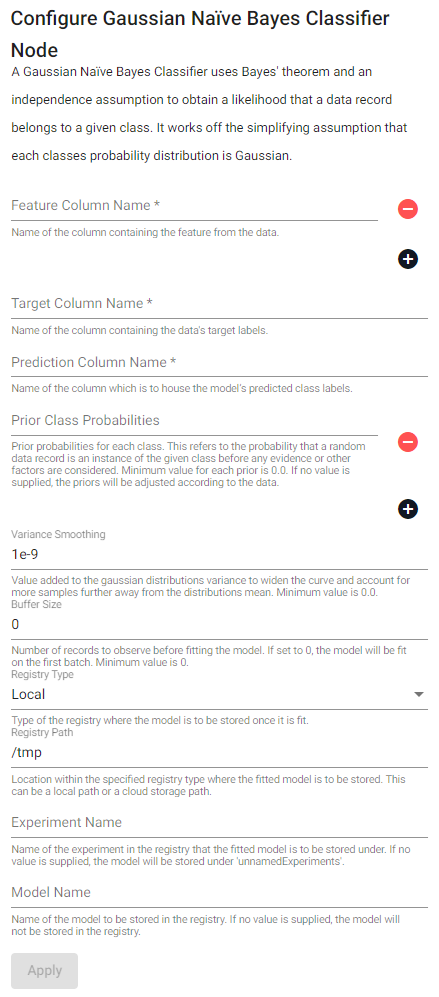
Gaussian naïve bayes classifier
A gaussian naïve bayes classifier uses Bayes' theorem and an independence assumption to obtain a likelihood that a data record belongs to a given class. It works off the simplifying assumption that each classes probability distribution is Gaussian.
| item | description |
|---|---|
| Feature Column Name (click [+] to add) | Name of the column(s) containing the features from the data. |
| Target Column Name | Name of the column containing the data's target labels. |
| Prediction Column Name | Name of the column which is to house the model's predicted class labels. |
| Prior Class Probabilities (click [+] to add) | Prior probabilities for each class. This refers to the probability that a random data record is an instance the given class before any evidence or other factors are considered. Minimum value for each prior is 0.0. If no value is supplied, the priors will be adjusted according to the data. |
| Variance Smoothing | Value added to the Gaussian distributions variance to widen the curve and account for more samples further away from the distributions mean. Minimum value is 0.0. |
| Buffer Size | Number of records to observe before fitting the model. If set to 0, the model will be fit on the first batch. Minimum value is 0. |
| Registry Type | Type of the registry where the fitted model is to be stored. |
| Registry Path | Location within the specified registry type where the fitted model is to be stored. This can be a local path or a cloud storage path. |
| Experiment Name | Name of the experiment in the registry that the fitted model is to be stored under. If no value is supplied, the model will be stored under unnamedExperiments. |
| Model Name | Name of the model to be stored in the registry. If no value is supplied, the model will not be stored in the registry. |
Gaussian Naive Bayes: What you need to know?
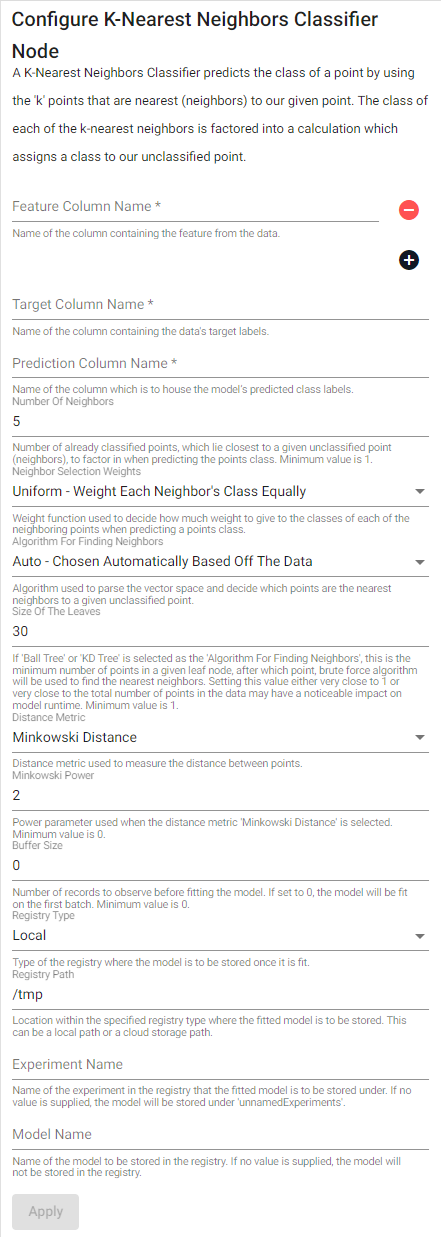
K-nearest neighbors classifier
A k-nearest neighbors classifier predicts the class of a point by using the 'k' points that are nearest (neighbors) to our given point. The class of each of the k-nearest neighbors is factored into a calculation which assigns a class to our unclassified point.
| item | description |
|---|---|
| Feature Column Name (click [+] to add) | Name of the column(s) containing the features from the data. |
| Target Column Name | Name of the column containing the data's target labels. |
| Prediction Column Name | Name of the column which is to house the model's predicted class labels. |
| Number Of Neighbors | Number of already classified points, which lie closest to a given unclassifier point (neighbors), to factor in when predicting the points class. Minimum value is 1. |
| Neighbor Selection Weights | Weight function used to decide how much weight to give to the classes of each of the neighboring points when predicting a points class. |
| Algorithm For Finding Neighbors | Algorithm used to parse the vector space and decide which points are the nearest neighbors to a given unclassified point. |
| Size Of The Leaves | If Ball Tree or KD Tree is selected as the Algorithm For Finding Neighbors, this is the minimum number of points in a given leaf node, after which point, brute force algorithm will be used to find the nearest neighbors. Setting this value either very close to 1 or very close to the total number of points in the data may have a noticeable impact on model runtime. Minimum value is 1. |
| Distance Metric | Distance metric used to measure the distance between points. |
| Minkowski Power | Power parameter used when the distance metric Minkowski Distance is selected. Minimum value is 0. |
| Buffer Size | Number of records to observe before fitting the model. If set to 0, the model will be fit on the first batch. Minimum value is 0. |
| Registry Type | Type of the registry where the fitted model is to be stored. |
| Registry Path | Location within the specified registry type where the fitted model is to be stored. This can be a local path or a cloud storage path. |
| Experiment Name | Name of the experiment in the registry that the fitted model is to be stored under. If no value is supplied, the model will be stored under unnamedExperiments. |
| Model Name | Name of the model to be stored in the registry. If no value is supplied, the model will not be stored in the registry. |
Quick Introduction to K-Nearest Neighbors Classifier
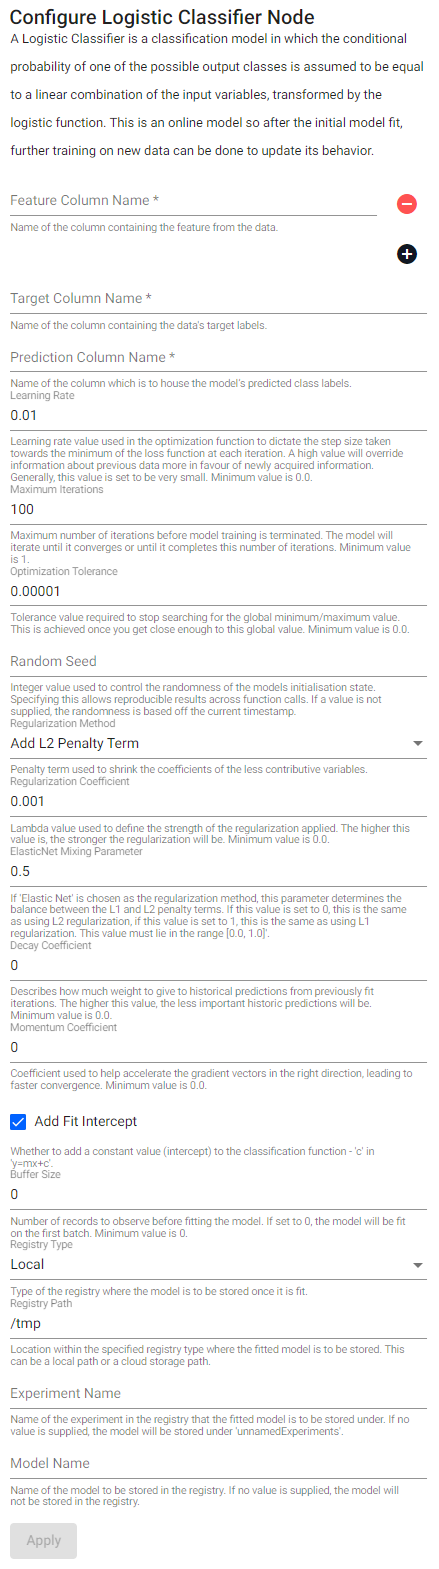
Logistic classifier
A logistic classifier is a classification model in which the conditional probability of one of the possible output classes is assumed to be equal to a linear combination of the input variables, transformed by the logistic function. This is an online model so after the initial model fit, further training on new data can be done to update its behavior.
| item | description |
|---|---|
| Feature Column Name (click [+] to add) | Name of the column(s) containing the features from the data. |
| Target Column Name | Name of the column containing the data's target labels. |
| Prediction Column Name | Name of the column which is to house the model's predicted class labels. |
| Learning Rate | Learning rate value used in the optimization function to dictate the step size taken towards the minimum of the loss function at each iteration. A high value will override information about previous data more in favor of newly acquired information. Generally, this value is set to be very small. Minimum value is 0.0. |
| Maximum Iterations | Maximum number of iterations before model training is terminated. The model will iterate until it converges or until it completes this number of iterations. Minimum value is 1. |
| Optimization Tolerance | Tolerance value required to stop searching for the global minimum/maximum value. This is achieved once you get close enough to this global value. Minimum value is 0.0. |
| Random Seed | Integer value used to control the randomness of the model's initialization state. Specifying this allows for reproducible results across function calls. If a value is not supplied, the randomness is based off the current timestamp. |
| Regularization Method | Penalty term used to shrink the coefficients of the less contributive variables. |
| Regularization Coefficient | Lambda value used to define the strength of the regularization applied. The higher this value is, the stronger the regularization will be. Minimum value is 0.0. |
| ElasticNet Mixing Parameter | If Elastic Net is chosen as the regularization method, this parameter determines the balance between the L1 and L2 penalty terms. If this value is set to 0, this is the same as using L2 regularization, if this value is set to 1, this is the same as using L1 regularization. This value must lie in the range (0.0, 1.0]. |
| Decay Coefficient | Describes how much weight to give to historical predictions from previously fit iterations. The higher this value, the less important the historic predictions will be. Minimum value is 0.0. |
| Momentum Coefficient | Coefficient used to help accelerate the gradient vectors in the right direction, leading to faster convergence. Minimum value is 0.0. |
| Add Fit Intercept | Whether to add a constant value (intercept) to the classification function - c in the y=mx+c. |
| Buffer Size | Number of records to observe before fitting the model. If set to 0, the model will be fit on the first batch. Minimum value is 0. |
| Registry Type | Type of the registry where the fitted model is to be stored. |
| Registry Path | Location within the specified registry type where the fitted model is to be stored. This can be a local path or a cloud storage path. |
| Experiment Name | Name of the experiment in the registry that the fitted model is to be stored under. If no value is supplied, the model will be stored under unnamedExperiments. |
| Model Name | Name of the model to be stored in the registry. If no value is supplied, the model will not be stored in the registry. |
Logistic Classification using SGD, Logistic Regression Classifier
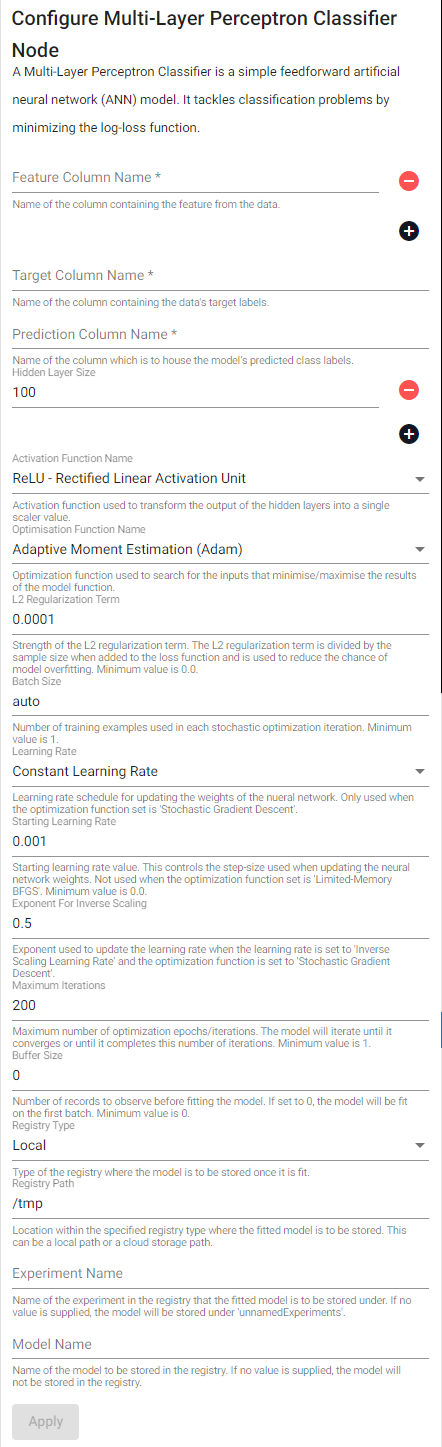
Multi-layer perceptron classifier
A multi-layer perceptron classifier is a simple feedforward artificial neural network (ANN) model. It tackles classification problems by minimizing the log-loss function.
| item | description |
|---|---|
| Feature Column Name | Name of the column(s) containing the features from the data. |
| Target Column Name | Name of the column containing the data's target labels. |
| Prediction Column Name | Name of the column which is to house the model's predicted class labels. |
| Hidden Layer Sizes | List of the number of neurons in each hidden layer in the neural network. Minimum size of each layer is 1. |
| Activation Function Name | Activation function used to transform the output of the hidden layers into a single scalar value. |
| Optimization Function Name | Optimization function used to search for the inputs that minimize/maximize the results of the model function. |
| L2 Regularization Term Strength | Strength of the L2 regularization term. The L2 regularization term is divided by the sample size when added to the loss function and is used to reduce the chance of model overfitting. Minimum value is 0.0. |
| Batch Size | Number of training examples used in each stochastic optimization iteration. Minimum value is 1. |
| Learning Rate | Learning rate schedule for updating the weights of the neural network. Only used when the optimization function set is Stochastic Gradient Descent. |
| Starting Learning Rate | Starting learning rate value. This controls the step-size used when updating the neural network weights. Not used when the optimization function is set to Limited-Memory BFGS. Minimum value is 0.0. |
| Exponent For Inverse Scaling | Exponent used to update the learning rate when the learning rate is set to Inverse Scaling Learning Rate and the optimization function is set to Stochastic Gradient Descent. |
| Maximum Iterations | Maximum number of optimization epochs/iterations. The model will iterate until it converges or until it completes this number of iterations. Minimum value is 1. |
| Buffer Size | Number of records to observe before fitting the model. If set to 0, the model will be fit on the first batch. Minimum value is 0. |
| Registry Type | Type of the registry where the fitted model is to be stored. |
| Registry Path | Location within the specified registry type where the fitted model is to be stored. This can be a local path or a cloud storage path. |
| Experiment Name | Name of the experiment in the registry that the fitted model is to be stored under. If no value is supplied, the model will be stored under unnamedExperiments. |
| Model Name | Name of the model to be stored in the registry. If no value is supplied, the model will not be stored in the registry. |
Multilayer Perceptron, Multilayer Perceptron: A simple multilayer neural network
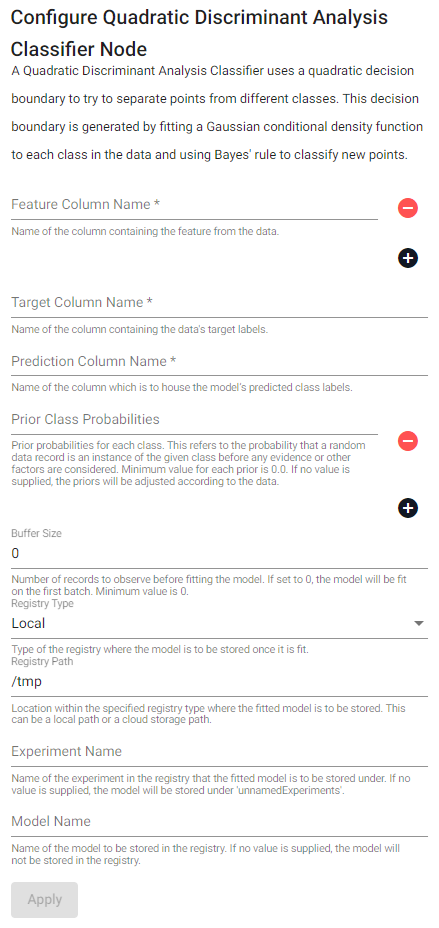
Quadratic discriminant analysis classifier
A Quadratic discriminant analysis classifier uses a quadratic decision boundary to try to separate points from different classes. This decision boundary is generated by fitting a Gaussian conditional density function to each class in the data and using Bayes' rule to classify new points.
| item | description |
|---|---|
| Feature Column Name (click [+] to add) | Name of the column(s) containing the features from the data. |
| Target Column Name | Name of the column containing the data's target labels. |
| Prediction Column Name | Name of the column which is to house the model's predicted class labels. |
| Prior Class Probabilities (click [+] to add) | Prior probabilities for each class. This refers to the probability that a random data record is an instance of the given class before any evidence or other factors are considered. Minimum value for each prior is 0.0. If no value is supplied, the priors will be adjusted according to the data. |
| Buffer Size | Number of records to observe before fitting the model. If set to 0, the model will be fit on the first batch. Minimum value is 0. |
| Registry Type | Type of the registry where the fitted model is to be stored. |
| Registry Path | Location within the specified registry type where the fitted model is to be stored. This can be a local path or a cloud storage path. |
| Experiment Name | Name of the experiment in the registry that the fitted model is to be stored under. If no value is supplied, the model will be stored under unnamedExperiments |
| Model Name | Name of the model to be stored in the registry. If no value is supplied, the model will not be stored in the registry. |
Quadratic Discriminant Analysis
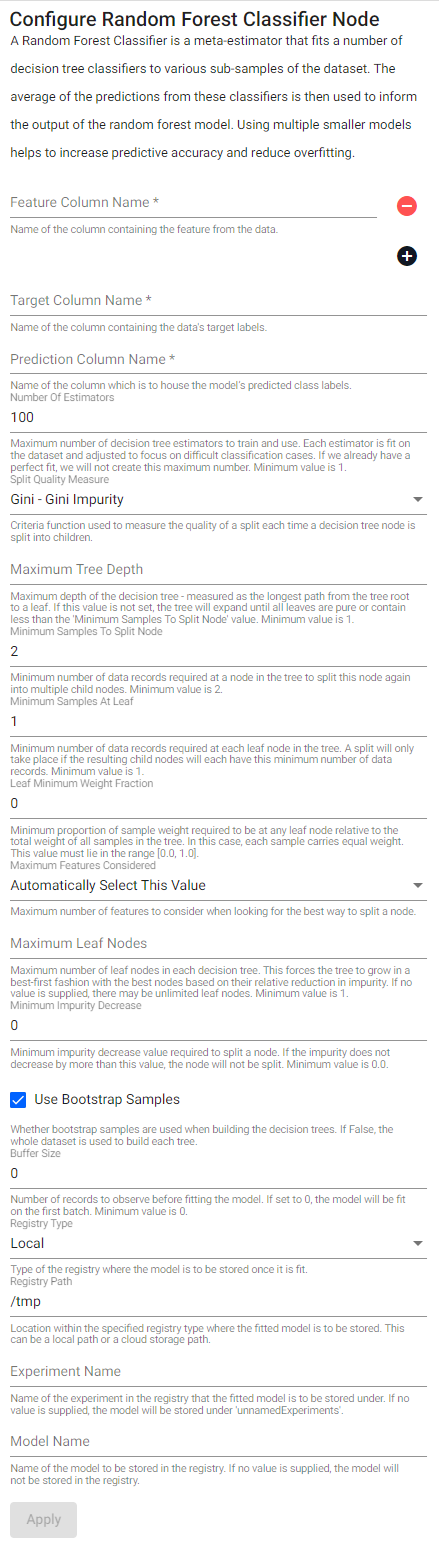
Random forest classifier
A random forest classifier is a meta-estimator that fits a number of decision tree classifiers to various sub-samples of the dataset. The average of the predictions from these classifiers is then used to inform the output of the random forest model. Using multiple smaller models helps to increase predictive accuracy and reduce overfitting.
| item | description |
|---|---|
| Feature Column Name (click [+] to add) | Name of the column(s) containing the features from the data. |
| Target Column Name | Name of the column containing the data's target labels. |
| Prediction Column Name | Name of the column which is to house the model's predicted class labels. |
| Number Of Estimators | Maximum number of decision tree estimators to train and use. Each estimator is fit on the dataset and adjusted to focus on difficult classification cases. If we already have a perfect fit, we will not create this maximum number. Minimum value is 1. |
| Split Quality Measure | Criteria function used to measure the quality of a split each time a decision tree node is split into children. |
| Maximum Tree Depth | Maximum depth of the decision tree - measured as the longest path from the tree root to a leaf. If no value is supplied, the tree will expand until all leaves are pure or contain less than the Minimum Samples To Split Node value. Minimum value is 1. |
| Minimum Samples To Split Node | Minimum number of data records required at a node in the tree to split this node again into multiple child nodes. Minimum value is 2. |
| Minimum Samples At Leaf | Minimum number of data records required at each leaf node in the tree. A split will only take place if the resulting child nodes will each have this minimum number of data records. Minimum value is 1. |
| Leaf Minimum Weight Fraction | Minimum proportion of sample weight required to be at any leaf node relative to the total weight of all samples in the tree. In this case, each sample carries equal weight. This value must lie in the range [0.0, 1.0]. |
| Maximum Features Considered | Maximum number of features to consider when looking for the best way to split a node. |
| Maximum Leaf Nodes | Maximum number of leaf nodes in each decision tree. This forces the tree to grow in a best-first fashion with the best nodes based on their relative reduction in impurity. If no value is supplied, there may be unlimited leaf nodes. Minimum value is 1. |
| Minimum Impurity Decrease | Minimum impurity decrease value required to split a node. If the tree impurity would not decrease by more than this value, the node will not be split. Minimum value is 0.0. |
| Use Bootstrap Samples | Whether bootstrap samples are used when building the decision trees. If this box is unchecked, the whole dataset is used to build each tree. |
| Buffer Size | Number of records to observe before fitting the model. If set to 0, the model will be fit on the first batch. Minimum value is 0. |
| Registry Type | Type of the registry where the fitted model is to be stored. |
| Registry Path | Location within the specified registry type where the fitted model is to be stored. This can be a local path or a cloud storage path. |
| Experiment Name | Name of the experiment in the registry that the fitted model is to be stored under. If no value is supplied, the model will be stored under unnamedExperiments. |
| Model Name | Name of the model to be stored in the registry. If no value is supplied, the model will not be stored in the registry. |
Clustering models
The below clustering models are a group of unsupervised learning models used to group similar data records together into clusters. These models do not need direction from the user but will define these groups using the features in the input data.
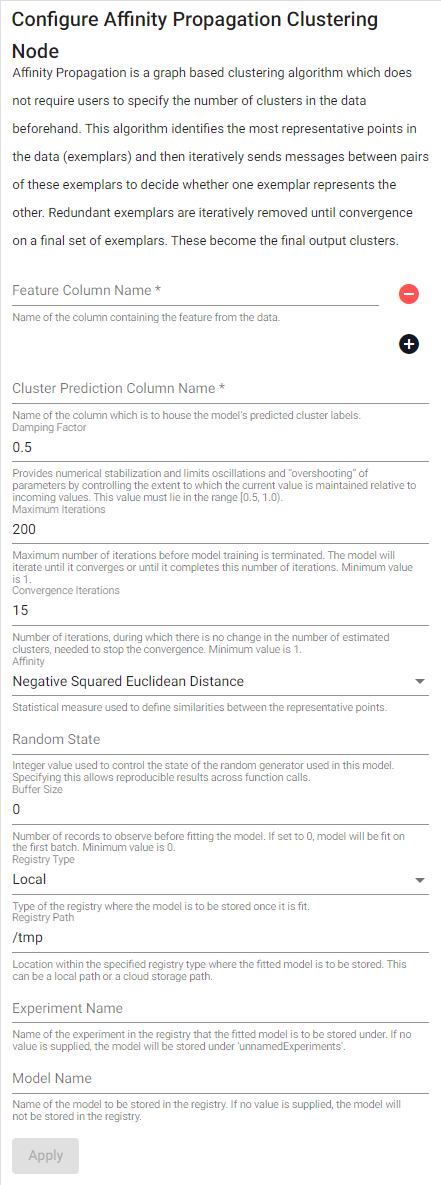
Affinity propagation
Affinity propagation is a graph based clustering algorithm which does not require users to specify the number of clusters in the data beforehand. This algorithm identifies the most representative points in the data (exemplars) and then iteratively sends messages between pairs of these exemplars to decide whether one exemplar represents the other. Redundant exemplars are iteratively removed until there is convergence on a final set of exemplars. These become the final output clusters.
| item | description |
|---|---|
| Feature Column Name (click [+] to add) | Name of the column(s) containing the features from the data. |
| Cluster Prediction Column Name | Name of the column which is to house the model's predicted cluster labels. |
| Damping Factor | Provides numerical stabilization and limits oscillations and “overshooting” of parameters by controlling the extent to which the current value is maintained relative to incoming values. This value must lie in the range [0.5, 1.0). |
| Maximum Iterations | Maximum number of iterations before model training is terminated. The model will iterate until it converges or until it completes this number of iterations. Minimum value is 1. |
| Convergence Iterations | Number of iterations, during which there is no change in the number of estimated clusters, needed to stop the convergence. Minimum value is 1. |
| Affinity | Statistical measure used to define similarities between the representative points. |
| Random State | Integer value used to control the state of the random generator used in this model. Specifying this allows for reproducible results across function calls. If a value is not supplied, the randomness is based off the current timestamp. |
| Buffer Size | Number of records to observe before fitting the model. If set to 0, the model will be fit on the first batch. Minimum value is 0. |
| Registry Type | Type of the registry where the fitted model is to be stored. |
| Registry Path | Location within the specified registry type where the fitted model is to be stored. This can be a local path or a cloud storage path. |
| Experiment Name | Name of the experiment in the registry that the fitted model is to be stored under. If no value is supplied, the model will be stored under unnamedExperiments. |
| Model Name | Name of the model to be stored in the registry. If no value is supplied, the model will not be stored in the registry. |
Affinity Propagation Clustering, How Affinity Propagation works
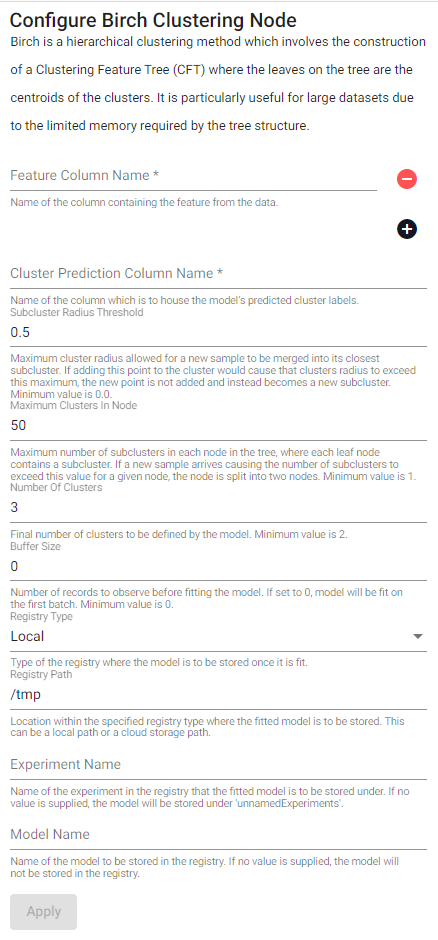
Birch Clustering
Birch is a hierarchical clustering method which involves the construction of a Clustering Feature Tree (CFT) where the leaves on the tree are the centroids of the clusters. It is particularly useful for large datasets due to the limited memory required by the tree structure.
| item | description |
|---|---|
| Feature Column Name (click [+] to add) | Name of the column(s) containing the features from the data. |
| Cluster Prediction Column Name | Name of the column which is to house the model's predicted cluster labels. |
| Subcluster Radius Threshold | Maximum cluster radius allowed for a new sample to be merged into its closest subcluster. If adding this point to a cluster would cause that clusters radius to exceed this maximum, the new point is not added and instead becomes a new subcluster. Minimum value is 0.0. |
| Maximum Clusters In Node | Maximum number of subclusters in each node in the tree, where each leaf node contains a subcluster. If a new sample arrives causing the number of subclusters to exceed this value for a given node, the node is split into two nodes. Minimum value is 1. |
| Number Of Clusters | Final number of clusters to be defined by the model. Minimum value is 2. |
| Buffer Size | Number of records to observe before fitting the model. If set to 0, the model will be fit on the first batch. Minimum value is 0. |
| Registry Type | Type of the registry where the fitted model is to be stored. |
| Registry Path | Location within the specified registry type where the fitted model is to be stored. This can be a local path or a cloud storage path. |
| Experiment Name | Name of the experiment in the registry that the fitted model is to be stored under. If no value is supplied, the model will be stored under unnamedExperiments. |
| Model Name | Name of the model to be stored in the registry. If no value is supplied, the model will not be stored in the registry. |
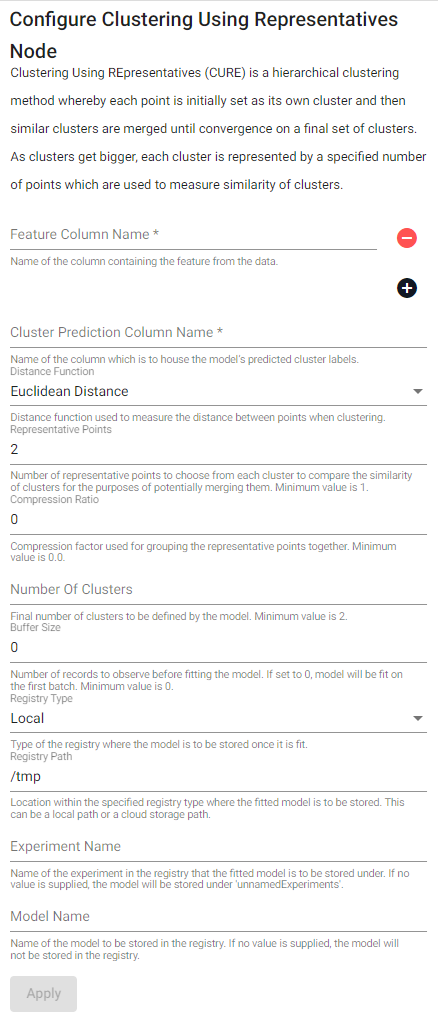
Clusting Using Representatives (CURE)
Clustering Using REpresentatives (CURE) is a hierarchical clustering method whereby each point is initially set as its own cluster and then similar clusters are merged until convergence on a final set of clusters. As clusters get bigger, each cluster is represented by a specified number of points which are used to measure similarity of clusters.
| item | description |
|---|---|
| Feature Column Name (click [+] to add) | Name of the column(s) containing the features from the data. |
| Cluster Prediction Column Name | Name of the column which is to house the model's predicted cluster labels. |
| Distance Function | Distance function used to measure the distance between points when clustering. |
| Representative Points | Number of representative points to choose from each cluster to compare the similarity of clusters for the purposes of potentially merging them. Minimum value is 1. |
| Compression Ratio | Compression factor used for grouping the representative points together. Minimum value is 0.0. |
| Number Of Clusters | Final number of clusters to be defined by the model. Minimum value is 2. |
| Buffer Size | Number of records to observe before fitting the model. If set to 0, the model will be fit on the first batch. Minimum value is 0. |
| Registry Type | Type of the registry where the fitted model is to be stored. |
| Registry Path | Location within the specified registry type where the fitted model is to be stored. This can be a local path or a cloud storage path. |
| Experiment Name | Name of the experiment in the registry that the fitted model is to be stored under. If no value is supplied, the model will be stored under unnamedExperiments. |
| Model Name | Name of the model to be stored in the registry. If no value is supplied, the model will not be stored in the registry. |
CURE Algorithm, Clustering in Machine Learning
DBSCAN Clustering
Density-Based Spatial Clustering of Applications with Noise (DBSCAN) is a clustering algorithm that initially finds core samples of high-density points and expands clusters out from these samples. This works well when the data contains clusters of a similar density.
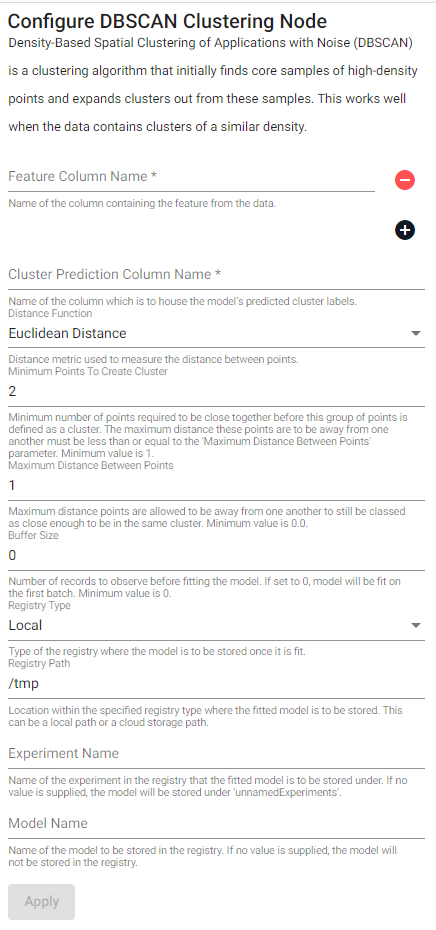
| item | description |
|---|---|
| Feature Column Name (click [+] to add) | Name of the column(s) containing the features from the data. |
| Cluster Prediction Column Name | Name of the column which is to house the model's predicted cluster labels. |
| Distance Function | Distance function used to measure the distance between points when clustering. |
| Minimum Points To Create Cluster | Minimum number of points required to be close together before this group of points is defined as a cluster. The distance away from one another must be less than or equal to the Maximum Distance Between Points parameter. Minimum value is 1. |
| Maximum Distance Between Points | Maximum distance points are allowed to be away from one another to still be classed as close enough to be in the same cluster. Minimum value is 0.0. |
| Buffer Size | Number of records to observe before fitting the model. If set to 0, the model will be fit on the first batch. Minimum value is 0. |
| Registry Type | Type of the registry where the fitted model is to be stored. |
| Registry Path | Location within the specified registry type where the fitted model is to be stored. This can be a local path or a cloud storage path. |
| Experiment Name | Name of the experiment in the registry that the fitted model is to be stored under. If no value is supplied, the model will be stored under unnamedExperiments. |
| Model Name | Name of the model to be stored in the registry. If no value is supplied, the model will not be stored in the registry. |
DBSCAN, DBSCAN Clustering - Explained
Sequential k-means
Sequential k-Mmans is a clustering algorithm which sets out to minimize the distance between each point and its respective cluster centroid. Once an initial set of cluster centroids are determined, the algorithm first assigns each value to a cluster, and then updates the cluster centroids, so they are in the center of their respective data points. This is done iteratively until convergence. This is an online model so after the initial model fit, further training on new data can be done to update its behavior.
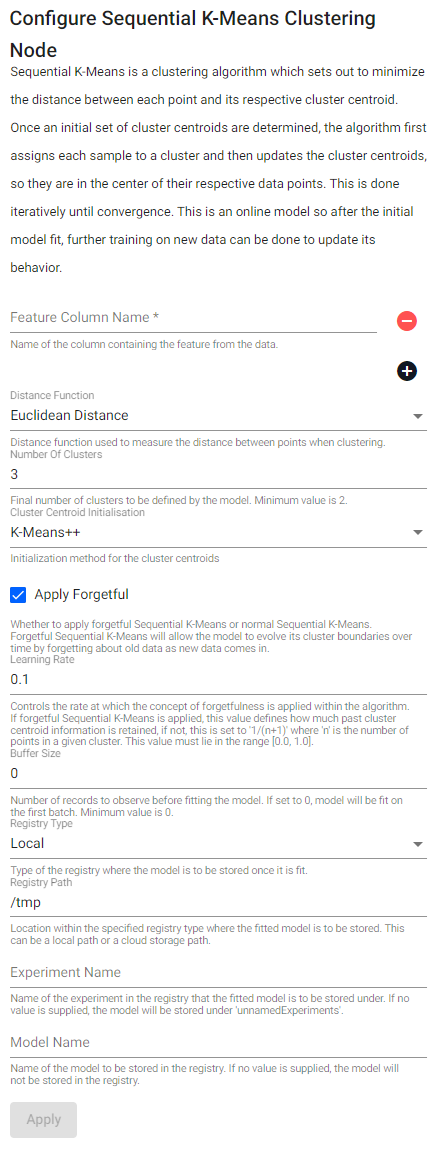
| item | description |
|---|---|
| Feature Column Name (click [+] to add) | Name of the column(s) containing the features from the data. |
| Distance Function | Distance function used to measure the distance between points when clustering. |
| Number Of Clusters | Final number of clusters to be defined by the model. Minimum value is 2. |
| Cluster Centroid Initialization | Initialization method for the cluster centroids. This value can either be K-means++ or randomized initialization. |
| Apply Forgetful | Whether to apply forgetful Sequential K-Means or normal Sequential K-Means. Forgetful Sequential K-Means will allow the model to evolve its cluster boundaries over time by forgetting about old data as new data comes in. |
| Learning Rate | Controls the rate at which the concept of forgetfulness is applied within the algorithm. If forgetful Sequential K-Means is applied, this value defines how much past cluster centroid information is retained, if not, this is set to 1/(n+1) where n is the number of points in a given cluster. This value must lie in the range [0.0, 1.0]. |
| Buffer Size | Number of records to observe before fitting the model. If set to 0, the model will be fit on the first batch. Minimum value is 0. |
| Registry Type | Type of the registry where the fitted model is to be stored. |
| Registry Path | Location within the specified registry type where the fitted model is to be stored. This can be a local path or a cloud storage path. |
| Experiment Name | Name of the experiment in the registry that the fitted model is to be stored under. If no value is supplied, the model will be stored under unnamedExperiments. |
| Model Name | Name of the model to be stored in the registry. If no value is supplied, the model will not be stored in the registry. |
Regression models
The below regression models are a group of supervised models used to predict a target value for each data record. This is done by using a user-provided set of labeled data records (the features and their corresponding target values) to guide the model's predictions.
AdaBoost regressor
An AdaBoost regressor fits a sequence of weak learners on the data and aggregates their predictions to produce a final prediction. In each iteration, the results of the previous estimator are used to adjust the weights of incorrectly predicted records to ensure the subsequent model focuses on correctly labeling these data records.
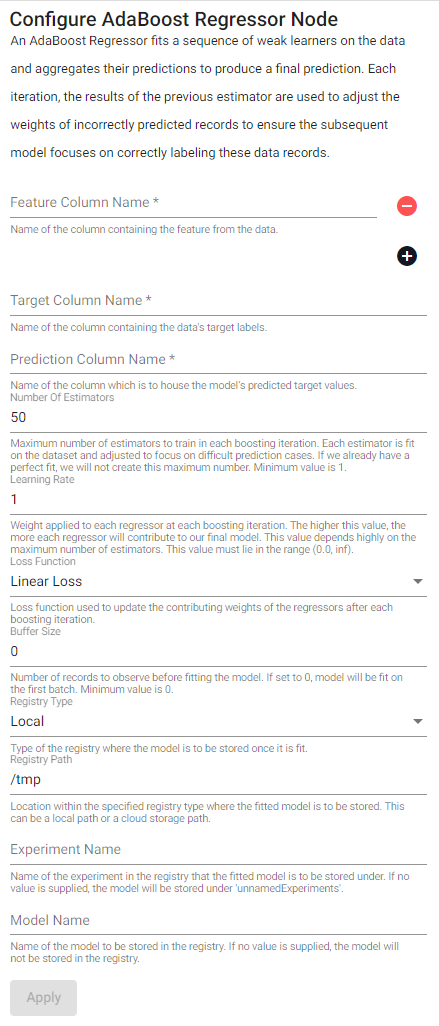
| item | description |
|---|---|
| Feature Column Name (click [+] to add) | Name of the column(s) containing the features from the data. |
| Target Column Name | Name of the column containing the data's target labels. |
| Prediction Column Name | Name of the column which is to house the model's predicted target values. |
| Number Of Estimators | Maximum number of estimators to train in each boosting iteration. Each estimator is fit on the dataset and adjusted to focus on difficult prediction cases. If we already have a perfect fit, we will not create this maximum number. Minimum value is 1. |
| Learning Rate | Weight applied to each regressor at each boosting iteration. The higher this value, the more each regressor will contribute to our final model. This value depends highly on the maximum number of estimators. Minimum value is 0.0. |
| Loss Function | Loss function used to update the contributing weights of the regressors after each boosting iteration. |
| Buffer Size | Number of records to observe before fitting the model. If set to 0, the model will be fit on the first batch. This value must lie in the range (0.0, inf). |
| Registry Type | Type of the registry where the fitted model is to be stored. |
| Registry Path | Location within the specified registry type where the fitted model is to be stored. This can be a local path or a cloud storage path. |
| Experiment Name | Name of the experiment in the registry that the fitted model is to be stored under. If no value is supplied, the model will be stored under unnamedExperiments. |
| Model Name | Name of the model to be stored in the registry. If no value is supplied, the model will not be stored in the registry. |
Understanding the Adaboost Regressor Algorithm
Decision tree regressor
A decision tree regressor predicts the value of a target by learning simple decision rules inferred from the data. These rules are used to split each node in the decision tree into child nodes to minimize a given loss function. It will stop splitting based on the configured Maximum Tree Depth, Minimum Samples To Split, and Minimum Samples At Leaf model parameters.
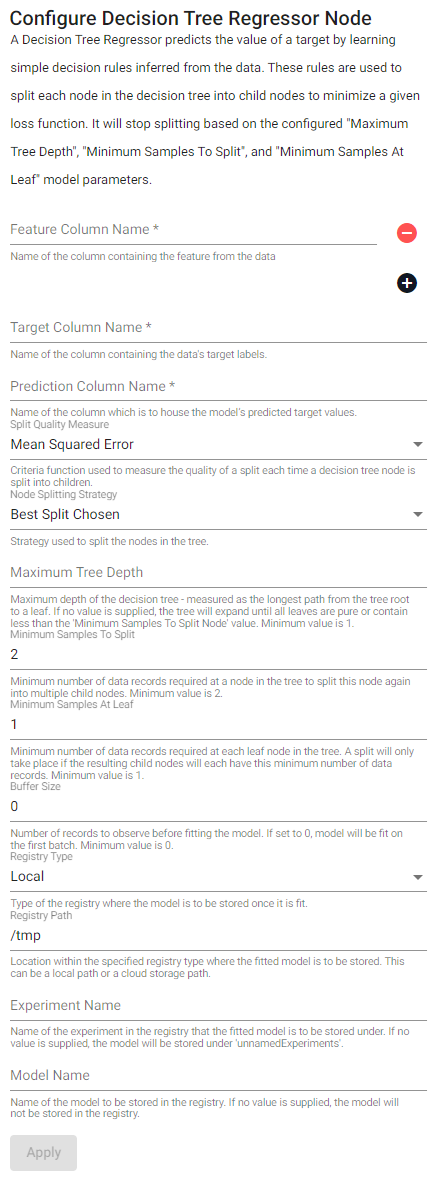
| item | description |
|---|---|
| Feature Column Name (click [+] to add) | Name of the column(s) containing the features from the data. |
| Target Column Name | Name of the column containing the data's target labels. |
| Prediction Column Name | Name of the column which is to house the model's predicted target values. |
| Split Quality Measure | Criteria function used to measure the quality of a split each time a decision tree node is split into children. |
| Node Splitting Strategy | Strategy used to split the nodes in the tree. |
| Maximum Tree Depth | Maximum depth of the decision tree - measured as the longest path from the tree root to a leaf. If no value is supplied, the tree will expand until all leaves are pure or contain less than the Minimum Samples To Split Node value. Minimum value is 1. |
| Minimum Samples To Split | Minimum number of data records required at a node in the tree to split this node again into multiple child nodes. Minimum value is 2. |
| Minimum Samples At Leaf | Minimum number of data records required at each leaf node in the tree. A split will only take place if the resulting child nodes will each have this minimum number of data records. Minimum value is 1. |
| Buffer Size | Number of records to observe before fitting the model. If set to 0, the model will be fit on the first batch. Minimum value is 0. |
| Registry Type | Type of the registry where the fitted model is to be stored. |
| Registry Path | Location within the specified registry type where the fitted model is to be stored. This can be a local path or a cloud storage path. |
| Experiment Name | Name of the experiment in the registry that the fitted model is to be stored under. If no value is supplied, the model will be stored under unnamedExperiments. |
| Model Name | Name of the model to be stored in the registry. If no value is supplied, the model will not be stored in the registry. |
Decision Tree Regressor Explained in Depth
Gradient boosting regressor
A gradient boosting regressor is an additive model that is built using a sequence of sparce regression estimators. It allows for the optimization of an arbitrary differentiable loss function. At each stage, a regression tree is fit on the negative gradient of a given loss function.
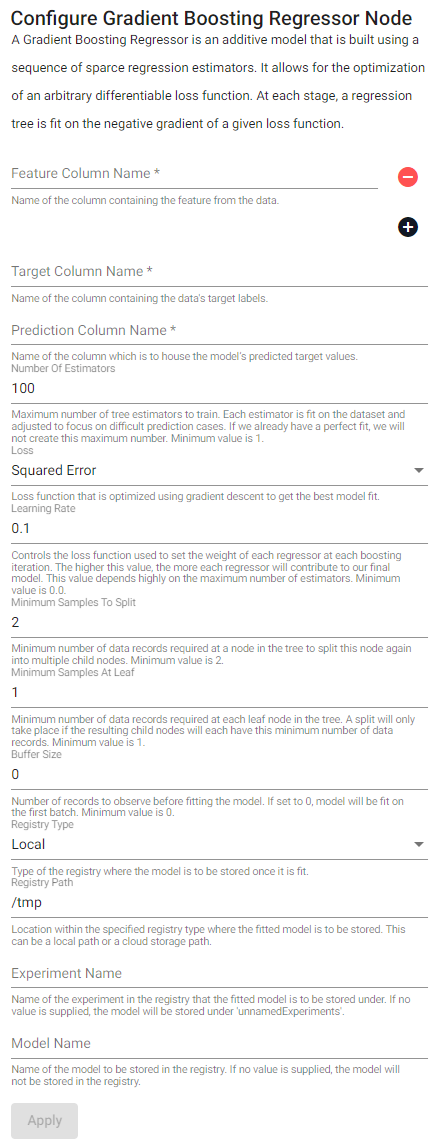
| item | description |
|---|---|
| Feature Column Name (click [+] to add) | Name of the column(s) containing the features from the data. |
| Target Column Name | Name of the column containing the data's target labels. |
| Prediction Column Name | Name of the column which is to house the model's predicted target values. |
| Number Of Estimators | Maximum number of tree estimators to train. Each estimator is fit on the dataset and adjusted to focus on difficult prediction cases. If we already have a perfect fit, we will not create this maximum number. Minimum value is 1. |
| Loss Function | Loss function that is optimized using gradient descent to get the best model fit. |
| Learning Rate | Controls the loss function used to set the weight of each regressor at each boosting iteration. The higher this value, the more each regressor will contribute to our final model. This value depends highly on the maximum number of estimators. Minimum value is 0.0. |
| Minimum Samples To Split | Minimum number of data records required at a node in the tree to split this node again into multiple child nodes. Minimum value is 2. |
| Minimum Samples At Leaf | Minimum number of data records required at each leaf node in the tree. A split will only take place if the resulting child nodes will each have this minimum number of data records. Minimum value is 1. |
| Buffer Size | Number of records to observe before fitting the model. If set to 0, the model will be fit on the first batch. Minimum value is 0. |
| Registry Type | Type of the registry where the fitted model is to be stored. |
| Registry Path | Location within the specified registry type where the fitted model is to be stored. This can be a local path or a cloud storage path. |
| Experiment Name | Name of the experiment in the registry that the fitted model is to be stored under. If no value is supplied, the model will be stored under unnamedExperiments. |
| Model Name | Name of the model to be stored in the registry. If no value is supplied, the model will not be stored in the registry. |
Gradient Boosting for Beginners
K-nearest neighbors regressor
A k-nearest neighbors regressor predicts the target value for a given point by using the 'k' points that are nearest (neighbors) to our given point. The target associated with each of the k-nearest neighbors is factored into an interpolation calculation which assigns a target prediction to our point.
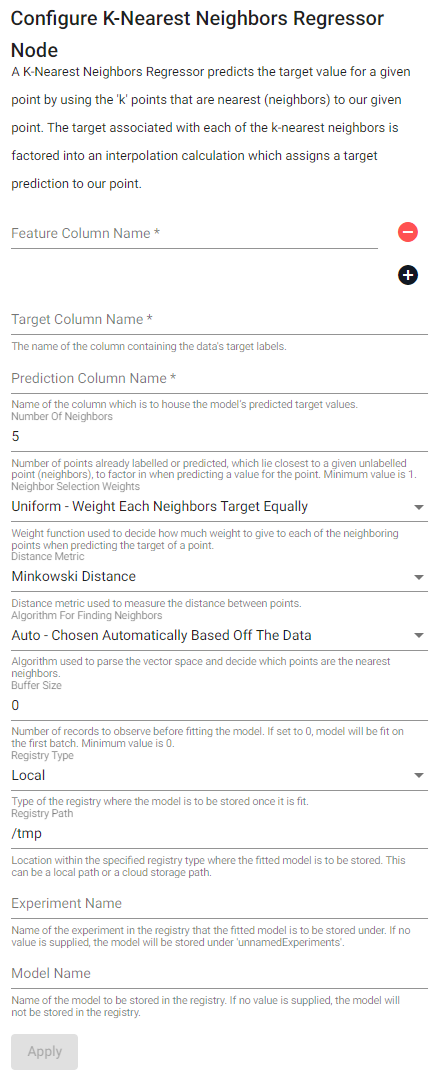
| item | description |
|---|---|
| Feature Column Name (click [+] to add) | Name of the column(s) containing the features from the data. |
| Target Column Name | Name of the column containing the data's target labels. |
| Prediction Column Name | Name of the column which is to house the model's predicted target values. |
| Number Of Neighbors | Number of points already labeled or predicted, which lie closest to a given unclassified point (neighbors), to factor in when predicting the points class. Minimum value is 1. |
| Neighbor Selection Weights | Weight function used to decide how much weight to give to each of the neighboring points when predicting the target of a point. |
| Distance Metric | Distance metric used to measure the distance between points. |
| Algorithm For Finding Neighbors | Algorithm used to parse the vector space and decide which points are the nearest neighbors. |
| Buffer Size | Number of records to observe before fitting the model. If set to 0, the model will be fit on the first batch. Minimum value is 0. |
| Registry Type | Type of the registry where the fitted model is to be stored. |
| Registry Path | Location within the specified registry type where the fitted model is to be stored. This can be a local path or a cloud storage path. |
| Experiment Name | Name of the experiment in the registry that the fitted model is to be stored under. If no value is supplied, the model will be stored under unnamedExperiments. |
| Model Name | Name of the model to be stored in the registry. If no value is supplied, the model will not be stored in the registry. |
k-nearest neighbors algorithm, also
Lasso regressor
A lasso regressor is a linear model using L1 as the regularization term. If the L1 Regularization Coefficient parameter is set to 0, hence removing the L1 regularization term, this is the same as running a Linear Regression model.
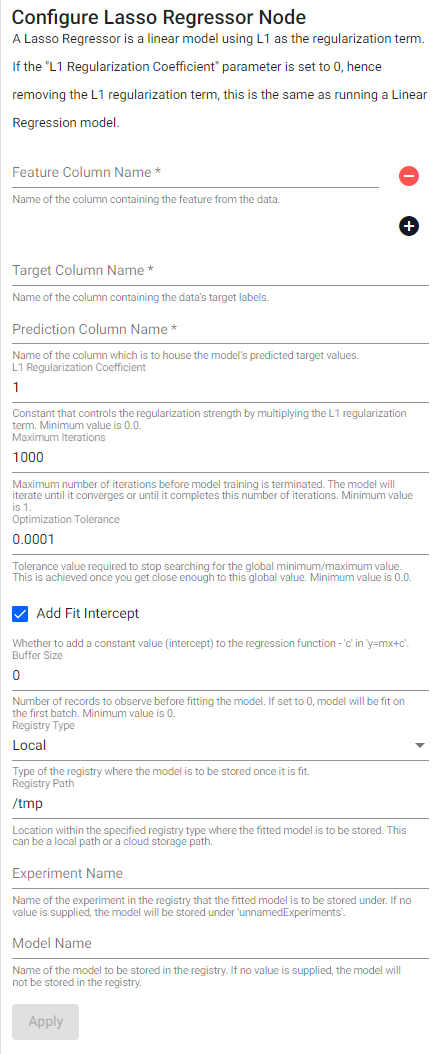
| item | description |
|---|---|
| Feature Column Name (click [+] to view) | Name of the column(s) containing the features from the data. |
| Target Column Name | Name of the column containing the data's target labels. |
| Prediction Column Name | Name of the column which is to house the model's predicted target values. |
| L1 Regularization Coefficient | Constant that controls the regularization strength by multiplying the L1 regularization term. Minimum value is 0.0. |
| Maximum Iterations | Maximum number of iterations before model training is terminated. The model will iterate until it converges or until it completes this number of iterations. Minimum value is 1. |
| Optimization Tolerance | Tolerance value required to stop searching for the global minimum/maximum value. This is achieved once you get close enough to this global value. Minimum value is 0.0. |
| Add Fit Intercept | Whether to add a constant value (intercept) to the regression function - c in y=mx+c. |
| Buffer Size | Number of records to observe before fitting the model. If set to 0, the model will be fit on the first batch. Minimum value is 0. |
| Registry Type | Type of the registry where the fitted model is to be stored. |
| Registry Path | Location within the specified registry type where the fitted model is to be stored. This can be a local path or a cloud storage path. |
| Experiment Name | Name of the experiment in the registry that the fitted model is to be stored under. If no value is supplied, the model will be stored under unnamedExperiments. |
| Model Name | Name of the model to be stored in the registry. If no value is supplied, the model will not be stored in the registry. |
Linear regressor
A linear regressor is a regression model in which the target value for a data record is assumed to be equal to a linear combination of the input variables. This is an online model so after the initial model fit, further training on new data can be done to update its behavior.
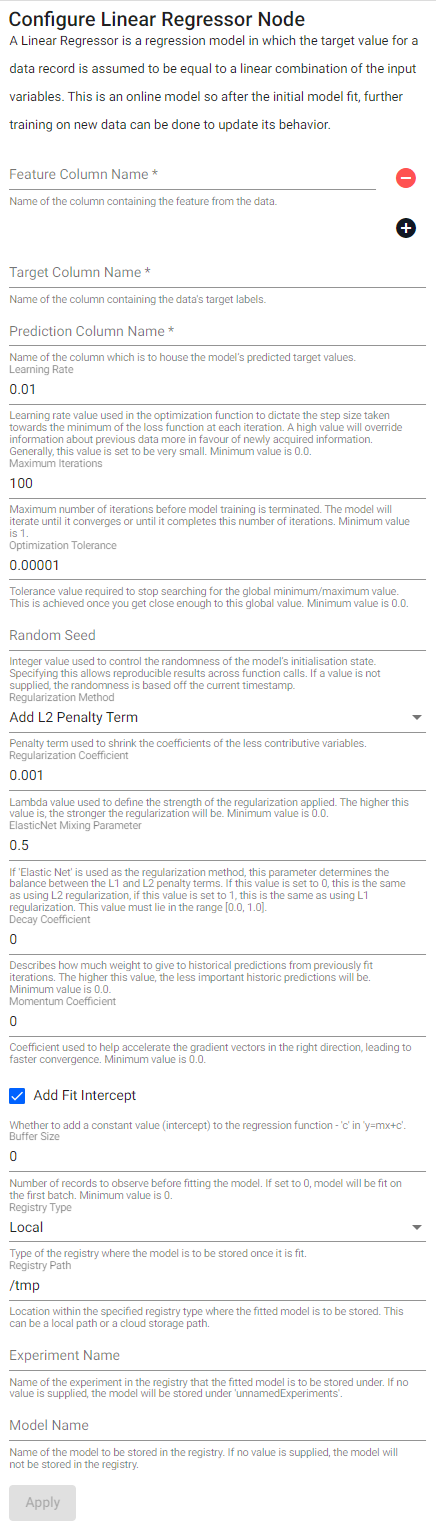
| item | description |
|---|---|
| Feature Column Name (click [+] to add) | Name of the column(s) containing the features from the data. |
| Target Column Name | Name of the column containing the data's target labels. |
| Prediction Column Name | Name of the column which is to house the model's predicted target values. |
| Learning Rate | Learning rate schedule used during model training to control how the model’s coefficients are changed each time the model is updated. Minimum value is 0.0. |
| Maximum Iterations | Maximum number of iterations before model training is terminated. The model will iterate until it converges or until it completes this number of iterations. Minimum value is 1. |
| Optimization Tolerance | Tolerance value required to stop searching for the global minimum/maximum value. This is achieved once you get close enough to this global value. Minimum value is 0.0. |
| Random Seed | Integer value used to control the randomness of the model's initialization state. Specifying this allows for reproducible results across function calls. If a value is not supplied, the randomness is based off the current timestamp. |
| Regularization Method | Penalty term used to shrink the coefficients of the less contributive variables. |
| Regularization Coefficient | Lambda value used to define the strength of the regularization applied. The higher this value is, the stronger the regularization will be. Minimum value is 0.0. |
| Elastic Net Mixing Parameter | If Elastic Net is used as the regularization method, this parameter determines the balance between the L1 and L2 penalty terms. If this value is set to 0, this is the same as using L2 regularization, if this value is set to 1, this is the same as using L1 regularization. This value must lie in the range [0.0, 1.0]. |
| Decay Coefficient | Describes how much weight to give to historical predictions from previously fit iterations. The higher this value, the less important historic predictions will be. Minimum value is 0.0. |
| Momentum Coefficient | Coefficient used to help accelerate the gradient vectors in the right direction, leading to faster convergence. Minimum value is 0.0. |
| Add Fit Intercept | Whether to add a constant value (intercept) to the regression function - c in y=mx+c. |
| Buffer Size | Number of records to observe before fitting the model. If set to 0, the model will be fit on the first batch. Minimum value is 0. |
| Registry Type | Type of the registry where the fitted model is to be stored. |
| Registry Path | Location within the specified registry type where the fitted model is to be stored. This can be a local path or a cloud storage path. |
| Experiment Name | Name of the experiment in the registry that the fitted model is to be stored under. If no value is supplied, the model will be stored under unnamedExperiments. |
| Model Name | Name of the model to be stored in the registry. If no value is supplied, the model will not be stored in the registry. |
Random forest regressor
A random forest regressor is a meta-estimator that fits a number of decision tree regressors to various sub-samples of the dataset. The average of the predictions from these regressors is then used to inform the output of the random forest model. Using multiple smaller models helps to increase predictive accuracy and reduce overfitting.
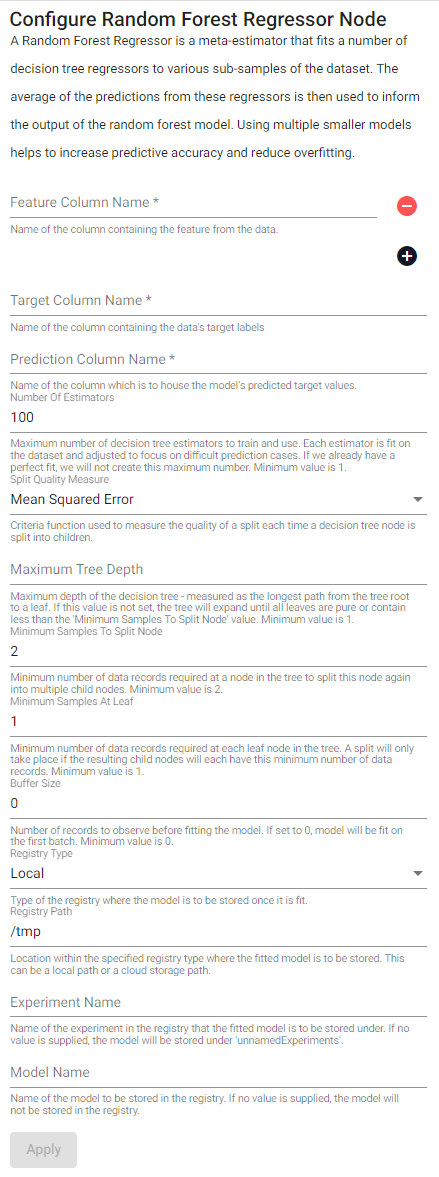
| item | description |
|---|---|
| Feature Column Name (click [+] to add) | Name of the column(s) containing the features from the data. |
| Target Column Name | Name of the column containing the data's target labels. |
| Prediction Column Name | Name of the column which is to house the model's predicted target values. |
| Number Of Estimators | Maximum number of decision tree estimators to train and use. Each estimator is fit on the dataset and adjusted to focus on difficult prediction cases. If we already have a perfect fit, we will not create this maximum number. Minimum value is 1. |
| Split Quality Measure | Criteria function used to measure the quality of a split each time a decision tree node is split into children. |
| Maximum Tree Depth | Maximum depth of the decision tree - measured as the longest path from the tree root to a leaf. If no value is supplied, the tree will expand until all leaves are pure or contain less than the Minimum Samples To Split Node value. Minimum value is 1. |
| Minimum Samples To Split | Minimum number of data records required at a node in the tree to split this node again into multiple child nodes. Minimum value is 2. |
| Minimum Samples At Leaf | Minimum number of data records required at each leaf node in the tree. A split will only take place if the resulting child nodes will each have this minimum number of data records. Minimum value is 1. |
| Buffer Size - | Number of records to observe before fitting the model. If set to 0, the model will be fit on the first batch. Minimum value is 0. |
| Registry Type | Type of the registry where the fitted model is to be stored. |
| Registry Path | Location within the specified registry type where the fitted model is to be stored. This can be a local path or a cloud storage path. |
| Experiment Name | Name of the experiment in the registry that the fitted model is to be stored under. If no value is supplied, the model will be stored under unnamedExperiments. |
| Model Name | Name of the model to be stored in the registry. If no value is supplied, the model will not be stored in the registry. |
Registry functions
The below registry functions are a group of functions that deal with models in the registry.
Predict Using Registry Model
Make a prediction using a model that is stored in the registry. This model is loaded from the registry, the input features are run through the model, and the model returns a target prediction.
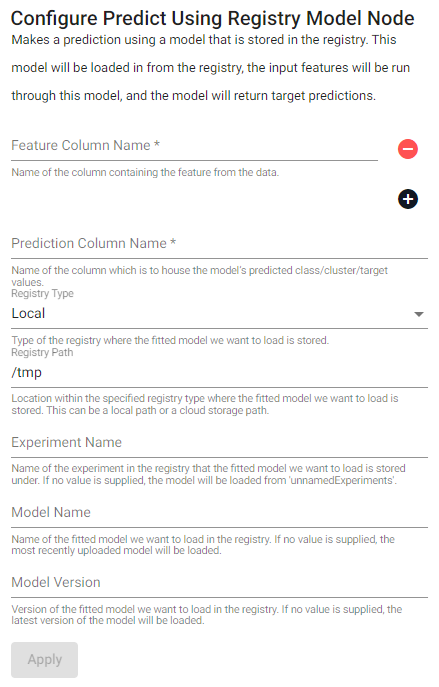
| item | description |
|---|---|
| Feature Column Name | Name of the column(s) containing the features from the data. |
| Prediction Column Name | Name of the column which is to house the model's predicted class/cluster/target values. |
| Registry Type | Type of the registry where the fitted model we want to load is stored. |
| Registry Path | Location within the specified registry type where the fitted model we want to load is stored. This can be a local path or a cloud storage path. |
| Experiment Name | Name of the experiment in the registry that the fitted model we want to load is stored under. If no value is supplied, the model will be loaded from unnamedExperiments. |
| Model Name | Name of the fitted model we want to load in the registry. If no value is supplied, the most recently uploaded model will be loaded. |
| Model Version | Version of the fitted model we want to load in the registry. If no value is supplied, the latest version of the model will be loaded. |
FRESH
FRESH stands for FeatuRe Extraction and Scalable Hypothesis testing.
FRESH create
This model creates aggregate statistical features based on the input data.
| item | description |
|---|---|
| Column Name | Name of the column(s) in the data to use for FRESH feature generation. |
| FRESH Feature Name | Name of the FRESH feature(s) we want to define from the data. |
Preprocessing functions
The below preprocessing functions are a group of functions used to manipulate and restructure the data to get it into a format which will enhance the predictive performance of the models we want to train on this data.
Drop constant
Removes columns that contain a single constant value throughout from an input table.
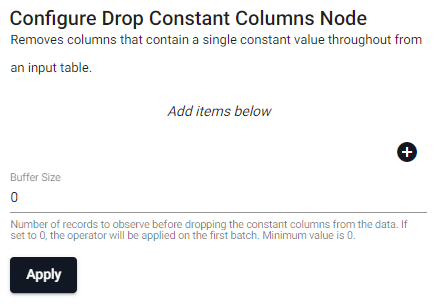
| item | description |
|---|---|
| Column Name (click [+] to add) | Name of the column(s) in the input table to remove because they contain a constant value througout. |
| Buffer Size | Number of records to observe before dropping the constant columns from the data. If set to 0, the operator will be applied on the first batch. Minimum value is 0. |
Label encoder
Encodes symbol or string typed columns in an input table as integer values; for example, if there are 3 symbols in the original categorical column, the labelEncoded column would contain 3 integers with each value corresponding to one of the 3 original symbols.
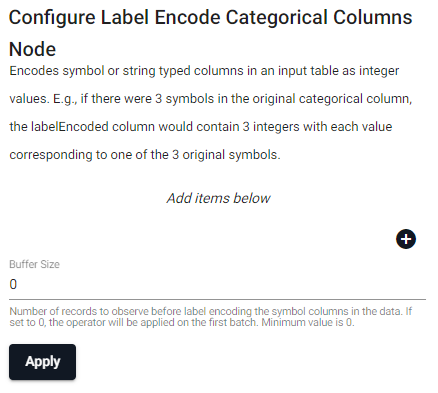
| item | description |
|---|---|
| Column Name (click [+] to add) | Name of the column(s) in the input table whose labels we want to encode. |
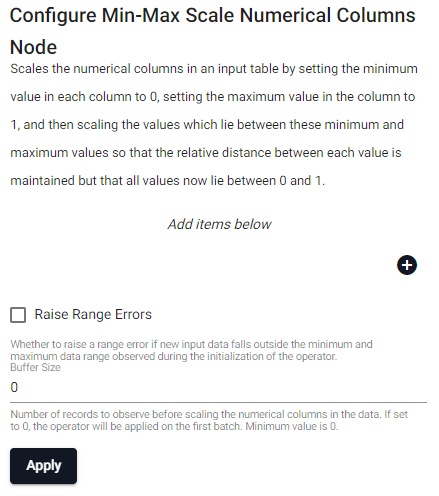
Min-max scaler
Scales the numerical columns in an input table by setting the minimum value in each column to 0, setting the maximum value in the column to 1, and then scaling the values which lie between these minimum and maximum values so that the relative distance between each value is maintained but that all values now lie between 0 and 1.
| item | description |
|---|---|
| Column Name (click [+] to add) | Name of the column(s) in the input table whose values we want to scale. |
| Raise Range Error | Whether to raise a range error if new input data falls outside the minimum and maximum data range observed during the initialization of the operator. |
| Buffer Size | Number of records to observe before scaling the numeric columns in the data. If set to 0, the operator will be applied on the first batch. Minimum value is 0. |
One-hot encoder
Encodes each symbol and string typed column as a number of integer typed columns. If a categorical column has ‘n’ distinct symbols, this will be encoded into ‘n’ individual new columns, one for each symbol. Each of these new columns will be populated by either a 0 or a 1 stating whether a given row in the table was previously populated with the underlying symbol value this column represents.

| item | description |
|---|---|
| Column Name (click [+] to add) | Name of the column(s) in the input table to one-hot encode. |
| Buffer Size | Number of records to observe before one-hot encoding the symbol columns in the data. If set to 0, the operator will be applied on the first batch. Minimum value is 0. |
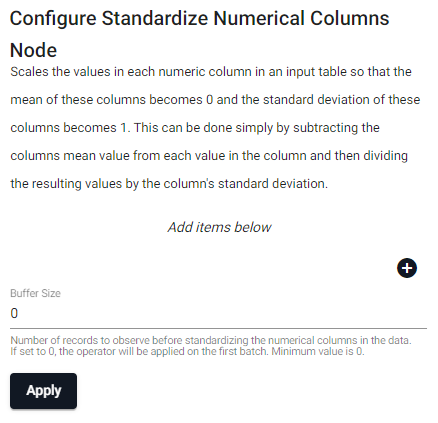
Standardize Numerical Columns
Scales the values in each numeric column in an input table so that the mean of these columns becomes 0 and the standard deviation of these columns becomes 1. This can be done simply by subtracting the columns mean value from each value in the column and then dividing the resulting values by the column’s standard deviation.
| item | description |
|---|---|
| Column Name (click [+] to add) | Name of the column(s) in the input table to standardize. |
| Buffer Size | Number of records to observe before standardizing the numeric columns in the data. If set to 0, the operator will be applied on the first batch. Minimum value is 0. |