Graph
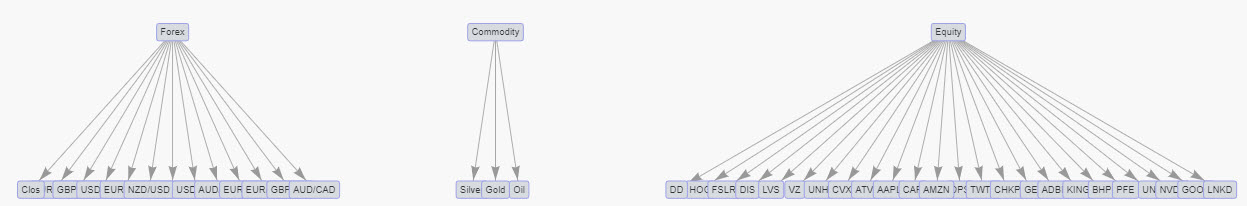
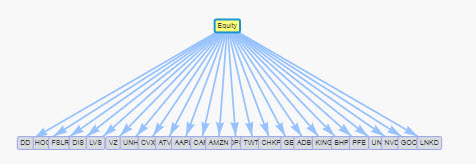
Graph showing membership of three asset groups; Forex, Commodities and Equities
Graph maps associations between parent and child groups.
Set up
-
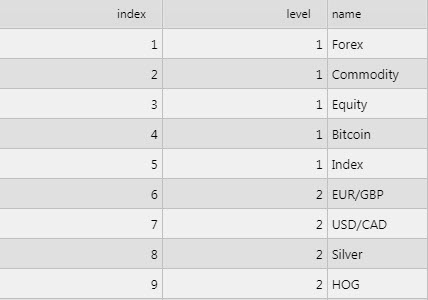
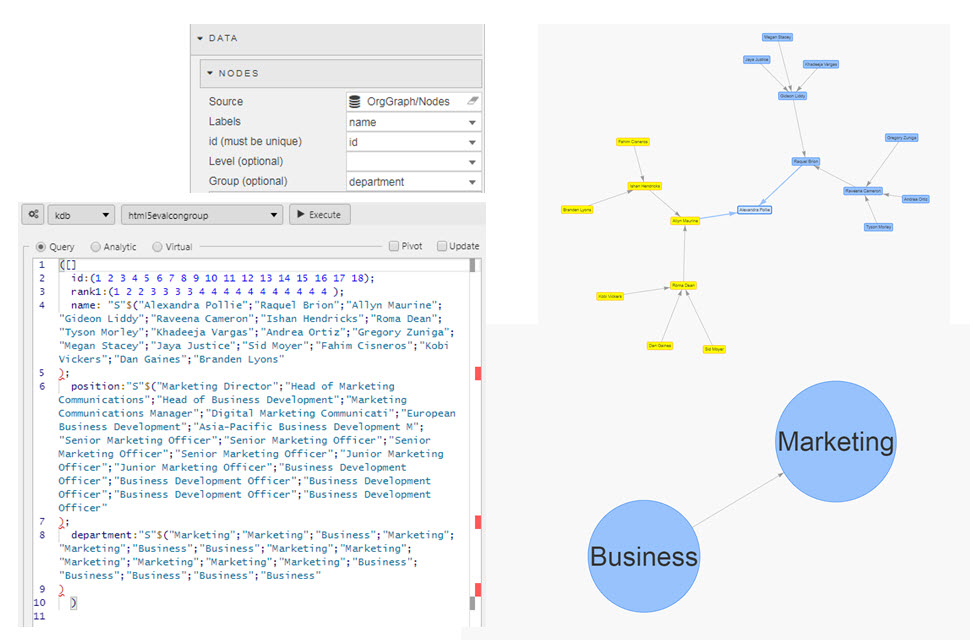
Define the nodes with a data source, each of which must have a unique
id. OptionalLevelandGroupassignments can be defined for each node. -
Map the id column from the data source.
-
Assign an optional view state for the selected node; stores the
idvalue. -
Map the optional Level and Group columns from the data source.
-
Set the edges with a data source, defines the to/from connectors by
id.
Basics
- Selected Node
- Map to a View State Parameter; used as a column identifier. Click on a Graph element to have the underlying value of the id (must be unique) column from the Graph datasource assigned to the viewstate. Use of Selected Node is optional.
- Graph selection: click on a parent or child to assign a Graph variable to the Selected Node view state parameter. Use the Control key to make multiple selections.
- Selected Edge
- Map to a View State Parameter; used as a column identifier. Click on a Graph element to have the underlying value of the id (must be unique) column from the Graph datasource assigned to the viewstate. Use of Selected Edge is optional.
- Graph selection: click on a child element to assign a Graph variable to the Selected Edge view state parameter.
Data
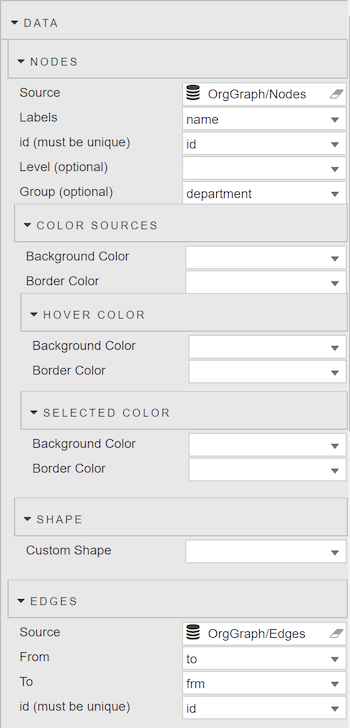
Nodes
Sets organization of graph; vertical or horizontal layout and level identifiers
- Source
-
- Labels
- Data source column to be used for Text labels
- id (must be unique)
- Data source column used as a reference selector; this value will be stored in the Selected Node view state parameter if assigned. Each graph point should have a unique reference ID value.
- Level (optional)
- Group (optional)
-
Optional grouping or level organization, defined by the Source. Group definition required for Cluster Scale.
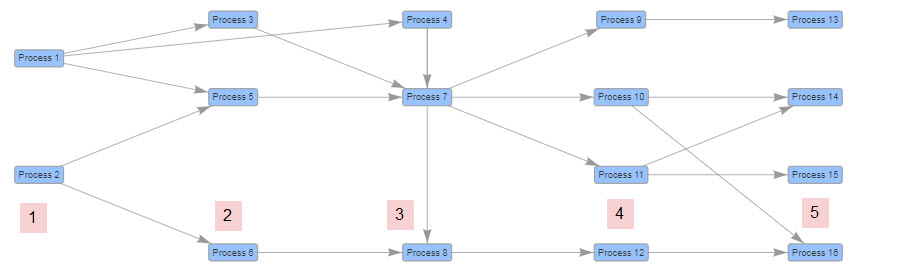 A five level process layout
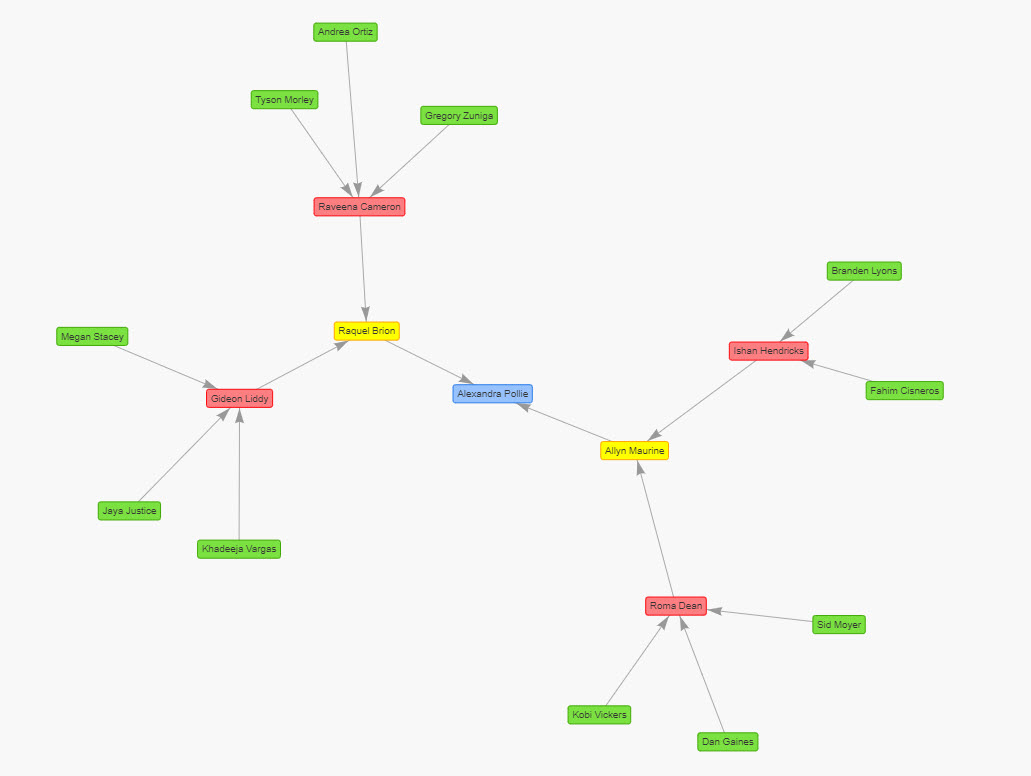 Grouped by rank with color coding
Color sources
- Background Color
- Border Color
- Define colors of nodes; set by Source column
Hover color
- Background Color
- Border Color
- Define colors of nodes; set by Source column
Selected color
- Background Color
- Border Color
- Define colors of nodes; set by Source column
Shape
- Custom Shape
- Define Source column containing shape information; e.g.
circle,database,diamond,square,hexagon,triangle
Edges
Flow of graph; From to To or vice versa
- Source
-
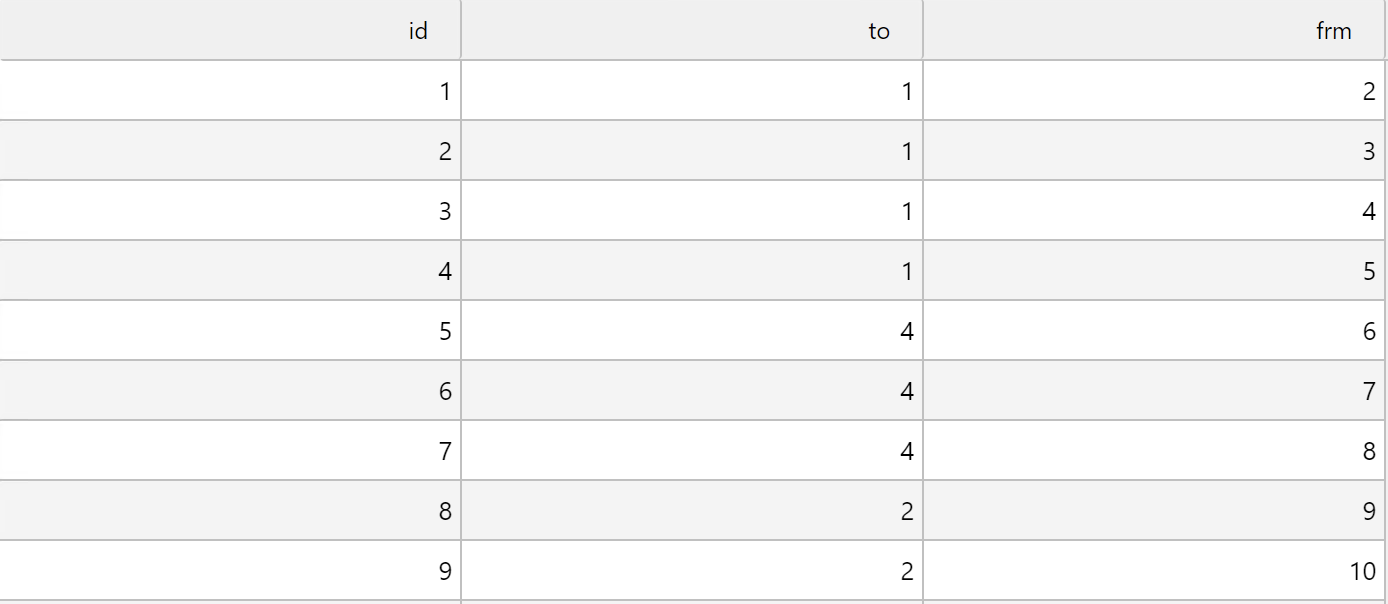
The Data Source should have three columns; for the parent, the children and an assoicated id. Each child will flow to its parent. Parents and children must have unique IDs.
- From
- Data source column for parents
- To
- Data source column for children
- id (must be unique)
- Data source column used as a reference selector; this value will be stored in the Selected Edge view state parameter if assigned. Each graph edge should have a unique reference ID value.
Style
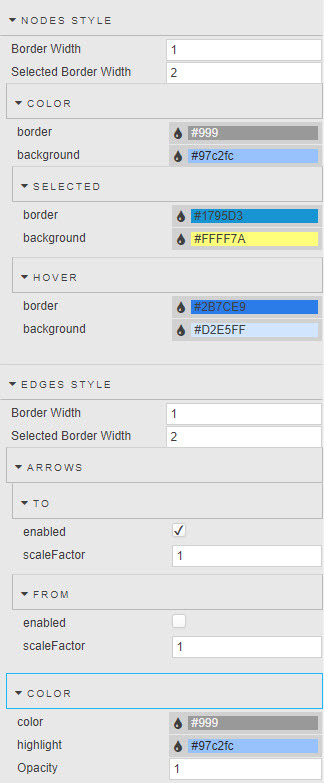
Nodes style
Border Width, Selected Border Width and Colors to use for the connecting graph lines
Edges style
Border Width, Selected Border Width and Colors and whether Arrows are added for the From and To graph connectors
Interaction
- Draggable Nodes
-
Allows user to reposition nodes
- Draggable View
- Supports pan of Graph view
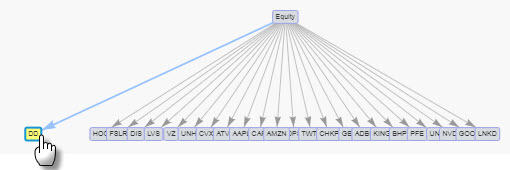
- Select Connected Edges
-
Highlights all connectors to children from selected parent
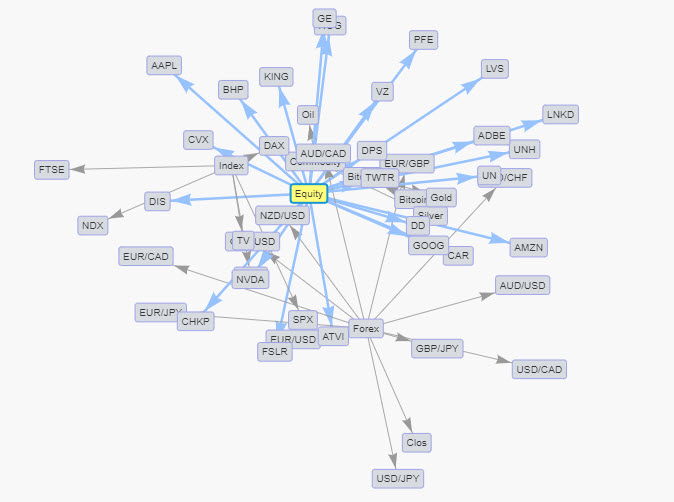
Physics
- Enable Physics Animations
-
Enables a force directed graph with physics animations.
-
When enabled each node can be repositioned and will show the physical effect it has on each other node in the graph.
- Maximum Node Velocity
- The physics model limits the maximum velocity of the nodes to increase the time to stabilization. 50 is the maximum value.
- Minimum Node Velocity
- Once the minimum velocity is reached for all nodes, the network has been stabilized and the simulation stops.
- Gravitational Constant
- The strength of the gravitational forces experienced by each node.
- Central Gravity Attractor
- The strength of a central gravity attractor to pull the entire network back to the center.
- Length of Edges
- The edges of the graph are modelled as springs and this parameter determines their length at rest.
- Edge Stiffness
- Determines the spring constant of each edge.
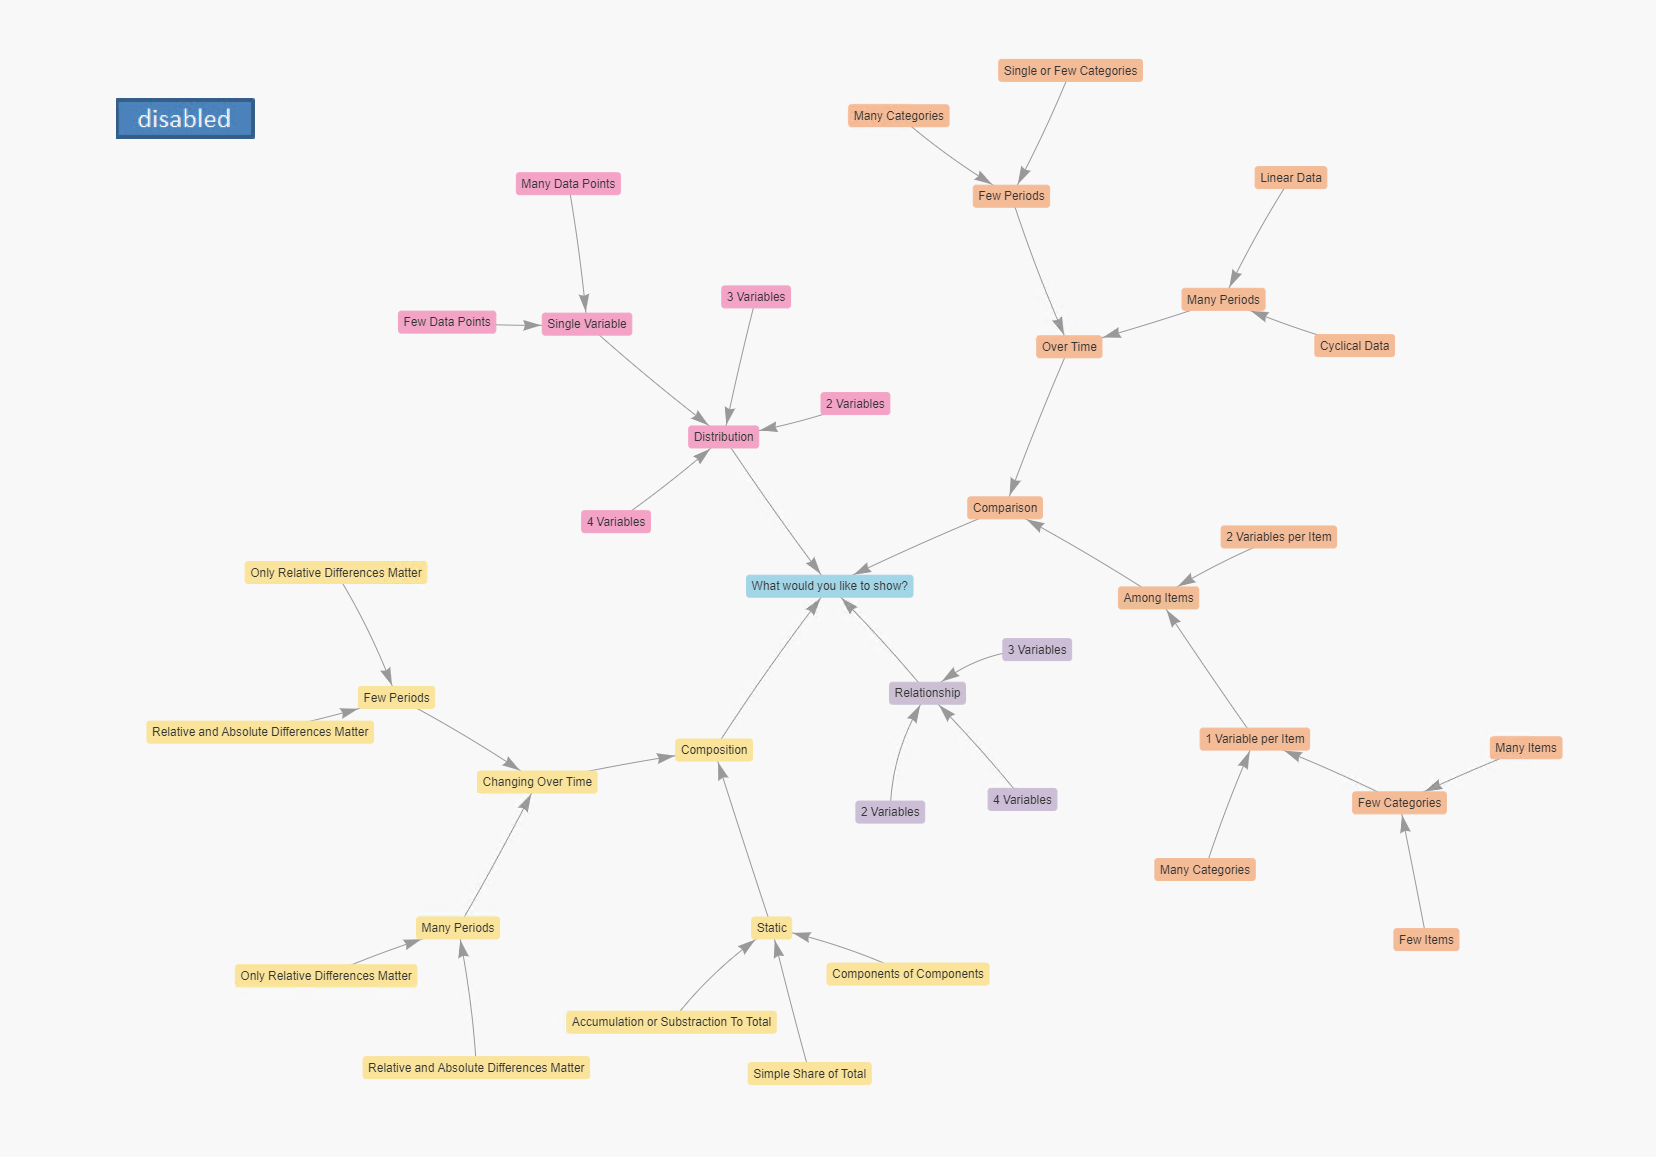
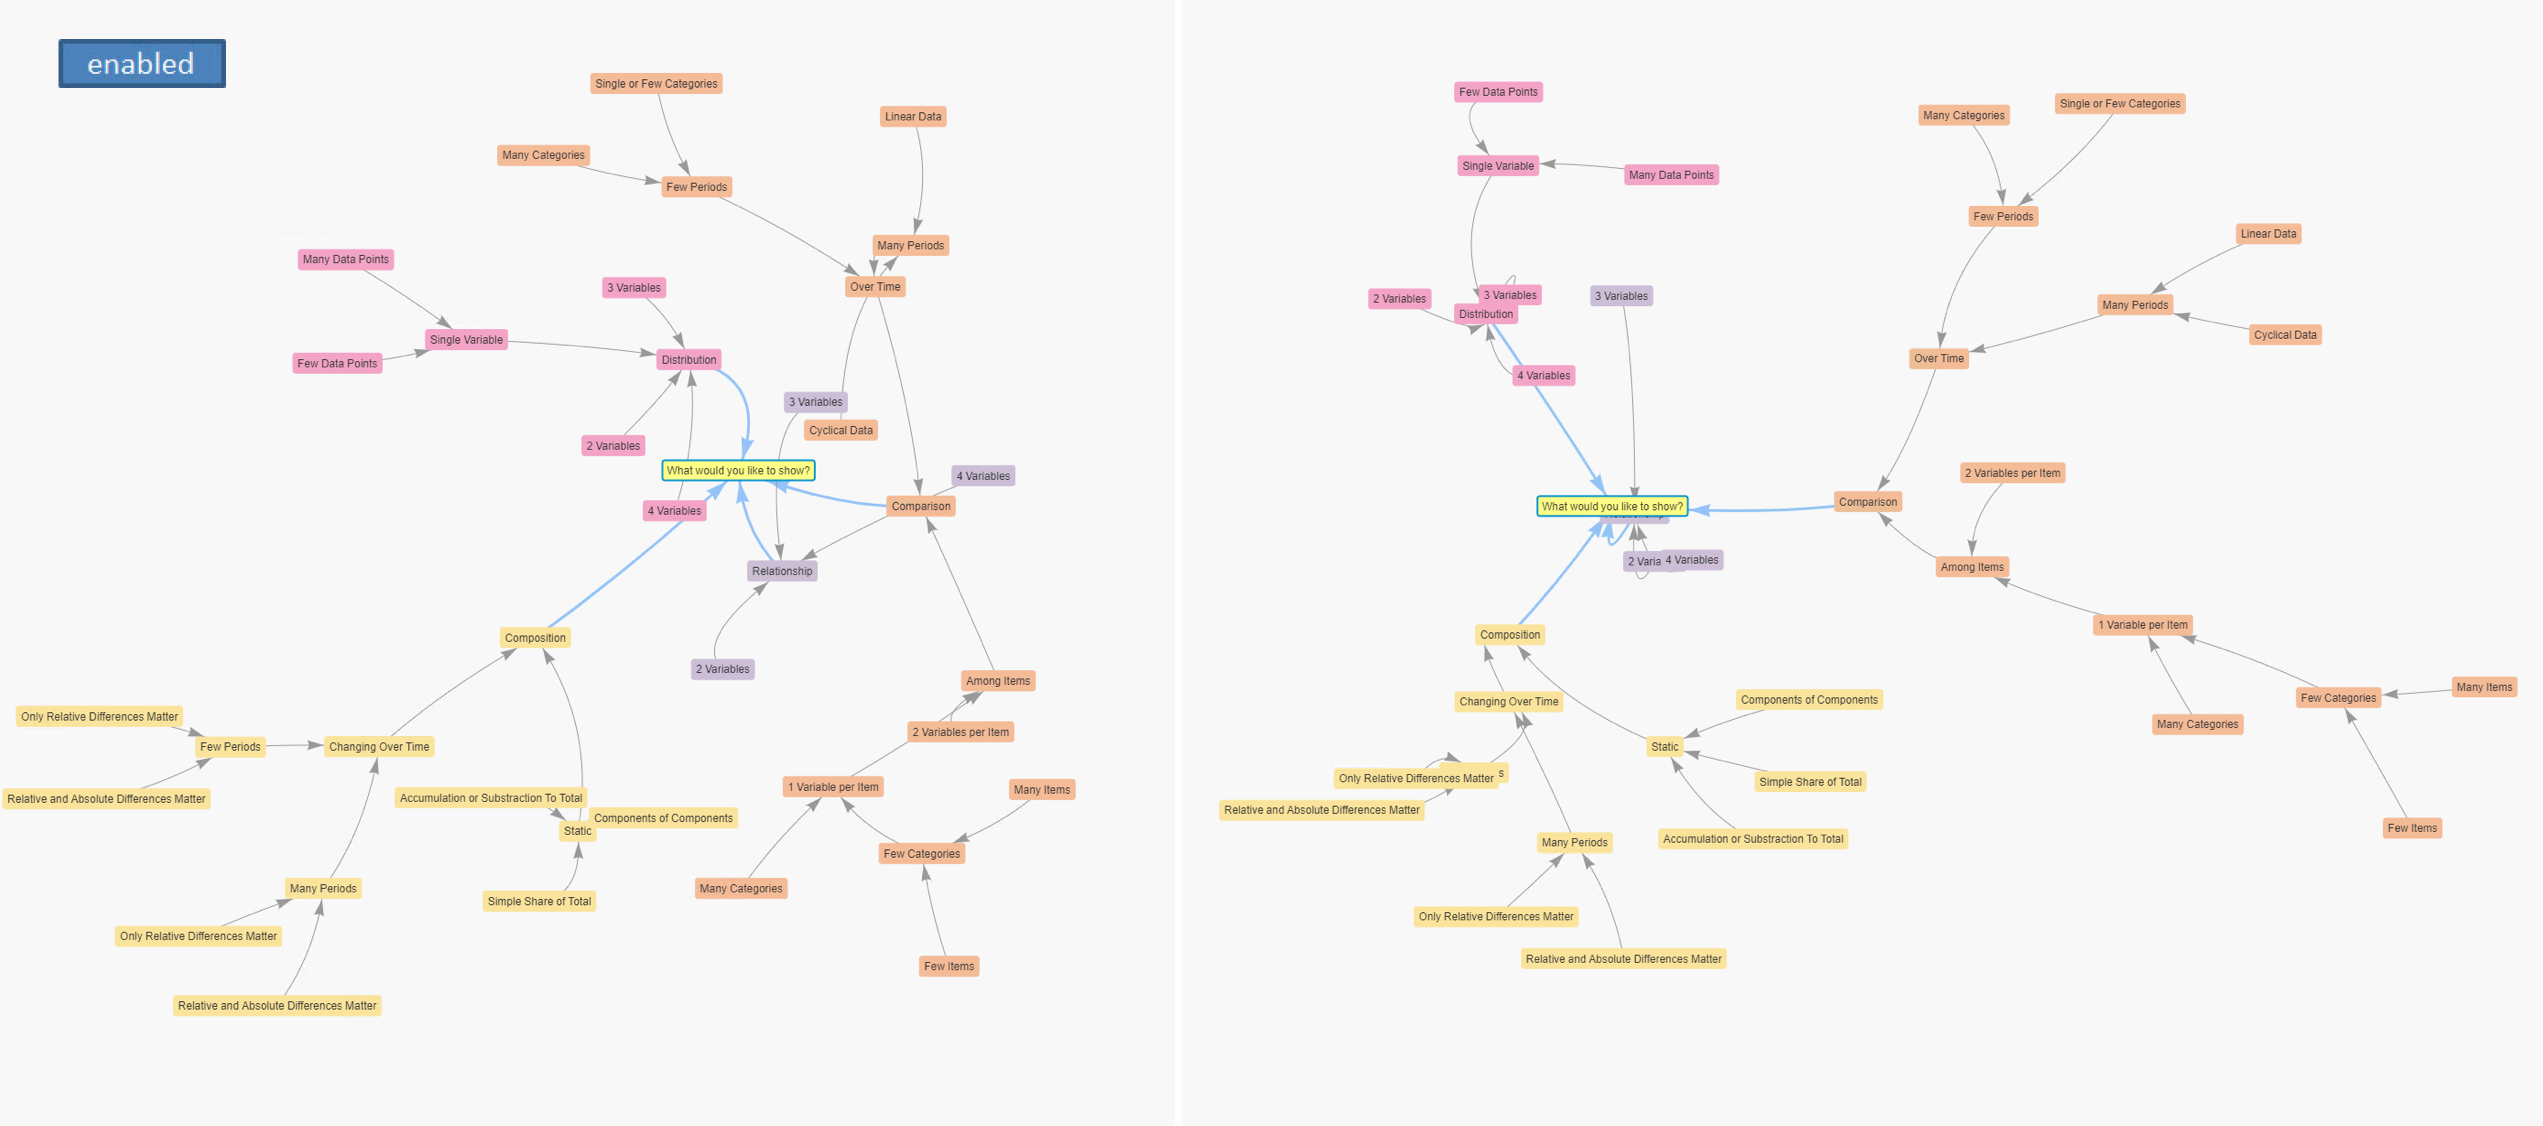
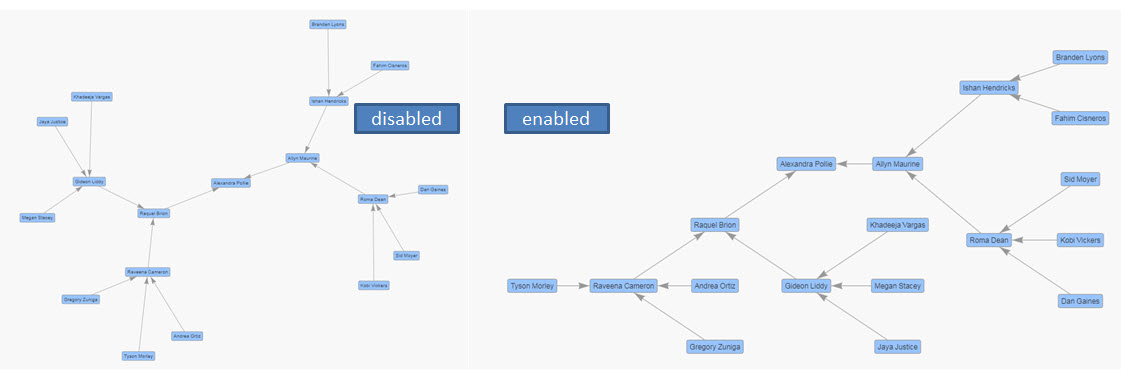
Physical vs Hierarchical Layout
To use the physical layout correctly, ensure Layout > Hierarchical is disabled.
Tooltips
- Show
- Enable tooltips
- Template
- Templates
Actions
Layout
- randomSeed
-
Defines layout when Hierarchical organization is disabled
- Cluster Scale
-
Determines point at which grouped nodes will cluster together. Move slider until desired effect appears.
Hierarchical
- enabled
-
Organize graph relationships by parent-child relationships
- levelSeparation
- pixel height between parent and child levels
- nodeSpacing
- pixel width between children (nodes)
- direction
- Direction of graph flow.
LR: left to right;RL: right to left;UD: up to down;DU: down to up.
Style, Margins, Format
Style for common settings