Tree Map
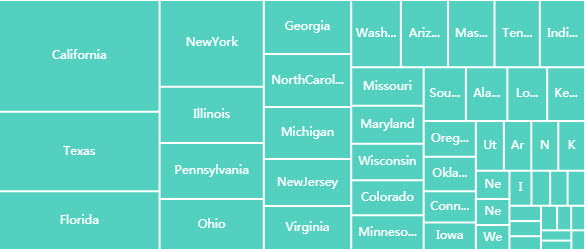
A Tree Map
Tree Map, best used in conjunction with Pivot Queries
Set up
-
Define a data source.
-
Category and box size are assigned from the data source with Column and Size.
-
Choose a color format; options go from single color, color gradient to iterative.
Basics
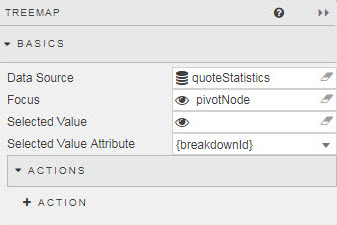
- Data Source
- A data source
- Focus
- A View State Parameter for linking components
- Selected Value
- Set a View State Parameter to store the last (most recent) selected interaction.
Action
Data
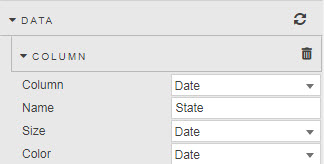
Adding more than one data series
Each Data Source column will stack in the Heat Map.
- Column
- Data source variable for Node label; set to
{breakdownId}for Pivot queries - Name
- Title name for Column; set to set to
{breakdownId}for Pivot queries - Size
- Data source variable for scaling Node size
- Color
- Data source variable to define color shading
Highlight rules
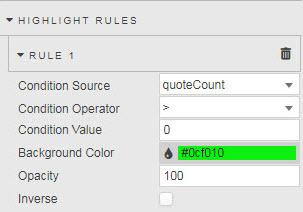
- Opacity
- Strength of highlight rule color; 0 is transparent (retaining underlying treemap color palette), 100 is opaque; 50 offers a hybrid shading of half Background Color and half of the base treemap color palette.
- Inverse
- Inverse application of color palette and highlight color
Color palette
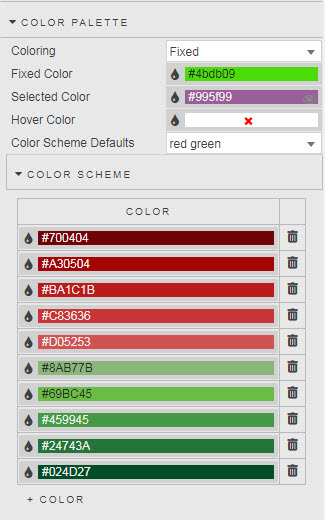
- Coloring
-
Select from
Fixed,Iterative,Iterative Children,Scaled,Gradient,Gradient Percentage.Gradient Percentage
Gradient Percentagerequires a Size range of between 0 and 1. - Fixed Color
- Used when
FixedColoring is selected - Selected Color
- Color of Treemap area on click-selection
- Hover Color
- Color of Treemap area on mouse hover
- Color Scheme
- Palette color selection
Node
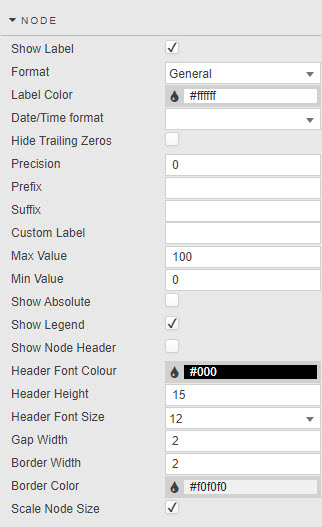
- Show Label
- Toggle display of Treemap data labels
- Show Legend
- Toggle display of gradient or Name legend
- Format
- Select format for Node:
General,Number,Smart Number,Formatted Number,Datetime - Date/Time Format
- Use when
Datetimeis selected for Format - Precision
- Number of decimal places used for
Number,Smart NumberorFormatted Number - Hide Trailing Zeros
- Remove extra zeros at the end of a digit
- Suffix
- Prefix
- Add a symbol before or after Node label.
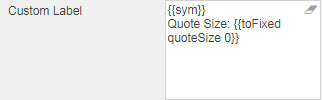
- Custom Label
- Add a Custom Label
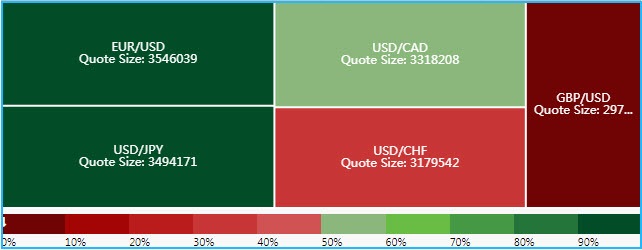
- Additional information displayed on Treemap
- Sample configuration
- Label Color
- Font color for label
- Scale Node Size
- When enabled, nodes scaled by Size variable.
- Min Value
- Max Value
- Defined from Size value range
- Border Color
- Border Width
- Gap Width
- Set pixel width and color of border
- Show Node Header
- Header Font Color
- Header Height
- Header Font Size
- Display Name as header and define Header style
Tooltip
Template for common settings
Group by
Create a heat map layer on top of a heat map
- Use Grouped By
- Grouped By
- Select Data Source column to group Data
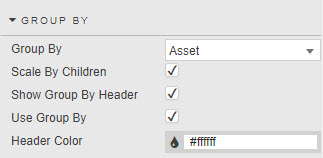
- Show Group By Header
- Displays group header name (from Data Source)
- Scale By Children
- Scale Node by Group By variable
Animation
- Duration
- Set duration in milliseconds to change Treemap animation.
- Animation Effect
- Select animation from:
easeInQuad,easeOutQuad,easeInOutQuad,
easeInCubic,easeOutCubic,easeInOutCubic,
easeInQuart,easeOutQuart,easeInOutQuart,
easeInQuint,easeOutQuint,easeInOutQuint,
easeInSine,easeOutSine,easeInOutSine,
easeInExpo,easeOutExpo,easeInOutExpo,
easeInCirc,easeOutCirc,easeInOutCirc,
easeInElastic,easeOutElastic,easeInOutElastic,
easeInBack,easeOutBack,easeInOutBack,
easeInBounce,easeOutBounce, andeaseInOutBounce.
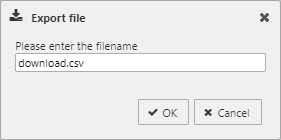
File export
| selection | export |
|---|---|
| Show Export CSV Button | Export display values as CSV file |
| Show Export Excel Button | Export display values as an XLS file |
| Show Screenshot Button | Take an image snapshot (.png) of your treemap |
- Filename
-
Includes variable as part of file save name
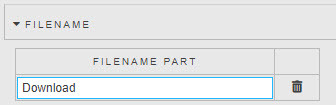
- Filename Part
-
A filename for the exported file, or a View State Parameter which can be linked to a Text Input for user defined file names.
Style
Style and Template for common settings
Format
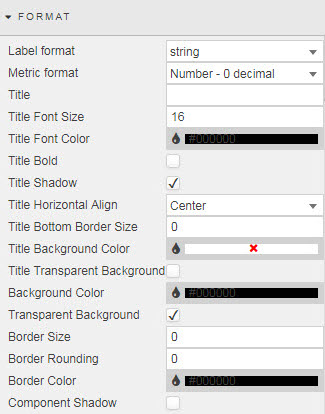
Format for common settings
Margins
Margins for common settings