3D Chart
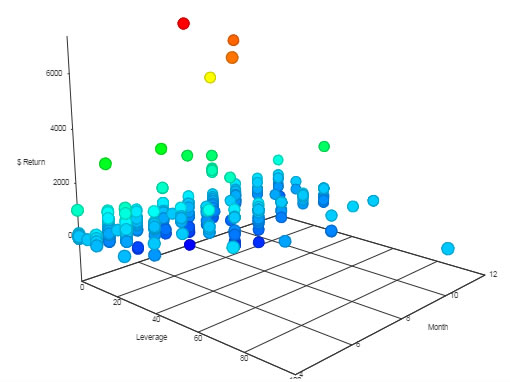
Charts data in three dimensions
Set up
-
Set up a data source.
-
For each x-, y-, and z-axis, define data columns to plot with Data Description.
-
Add Labels for each axis
Basics
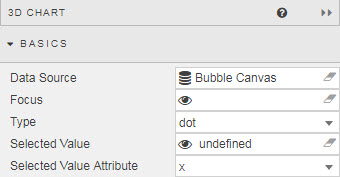
- Data Source
- A query or analytic
- Focus
- Used for linking components. Requires a View State Parameter.
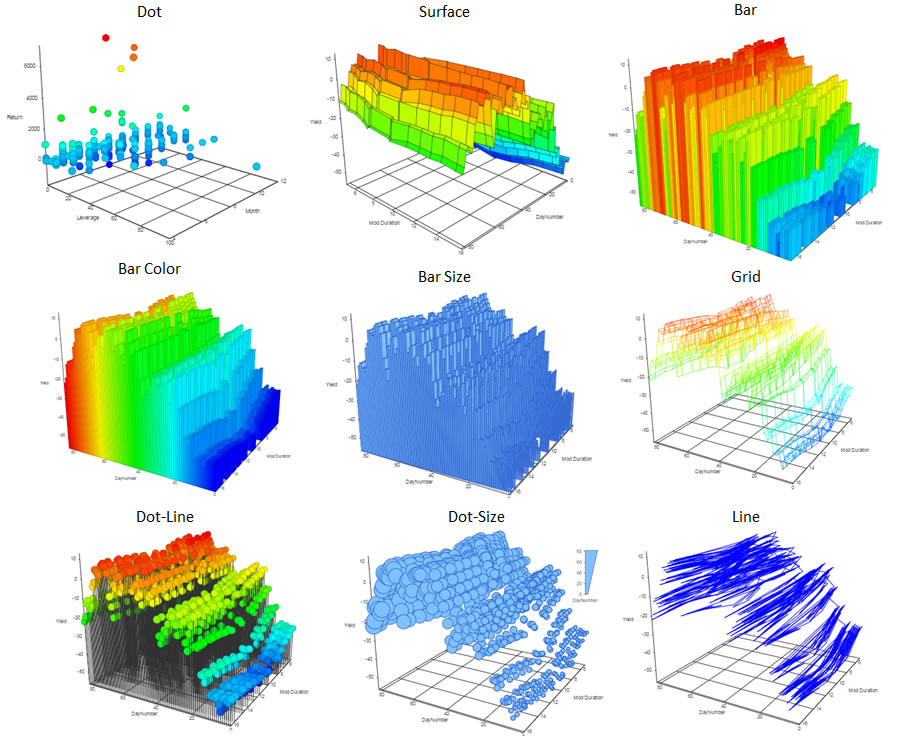
- Type
- Selected Value and Selected Value Attribute
- Selected values
Axis controls
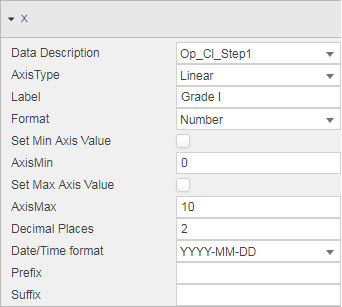
Settings for (each of) the X-, Y- and Z-axes
- Data Description
- The Data Source column to be plotted against the axis
- Axis Type
- Axis scaling; select from
linearorcategory - Label
- Descriptive label for the axis
- Format
- Numeric or date format; select from
General,Number,Smart Number,Formatted NumberorDatetime - Set Min Axis Value
- AxisMin
- Set Max Axis Value
- AxisMax
- Manually define min and max rage of axis
- Decimal Places
- Where a numeric value is used in Format, define the number of decimal places to display
- Date/Time Format
- For
Datetime, define the Date/Time format to use - Prefix
- Character before axis label
- Suffix
- Character after axis label
Volume
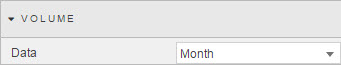
- Data
- The Data Source column for plot size
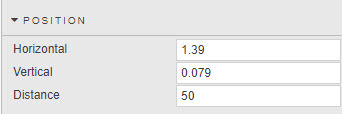
Position
Orientation of the chart: use the sliders or select Preview mode and rotate the chart, using the mouse scroll wheel to zoom in and out.
Style
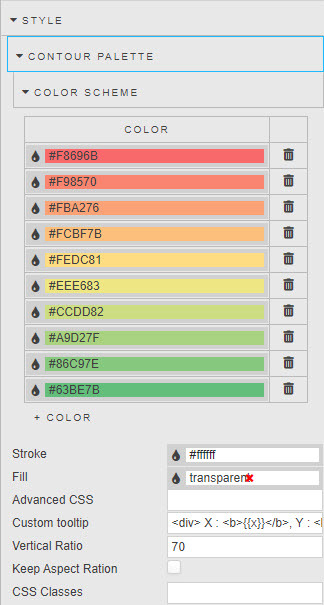
- Stroke
- Define grid-line color
- Fill
- Define background color for component
- Advanced CSS
- Advanced CSS
- Custom tooltip
- Custom tooltip
- Vertical Ratio
- Extends the height of the chart
- Keep Aspect Ratio
- Maintain aspect ratio when interacting with the chart
- CSS Classes
- Can be applied to style the component
Style for common style settings