kdb Insights Enterprise
kdb Insights Enterprise is a cloud based, easy-to-use, data investigation solution which runs inside the browser. Access can be obtained either by registering as a new user and starting the process of building an assembly to store your data, or alternatively trying a guided walkthrough with its pre-configured assembly and sample data sets to quickly get you working with data.
What is an Assembly?
An assembly is how kdb Insights Enterprise manages your data. An assembly is composed of:
- A database to store and access your data.
- A schema to convert the format of imported data to a format compatible with kdb Insights Enterprise (using kdb+ technology)
- A stream to push data into a database.
An assembly can include data pipelines; a pipeline is how kdb Insights Enterprise gets data from its source, e.g. a csv file stored in the cloud, and imports it to kdb Insights Enterprise in a kdb+ compatible format. As an added bonus, assemblies offer labels to be queried against in data investigations; this way, a user can pull data stored in multiple assemblies with just a single data request against an assigned label.
Irrespective of your pathway into kdb Insights Enterprise, upon login, users are greeted with an Overview page which grants access to all the features of kdb Insights Enterprise. This page includes jump points for building an assembly, a facility to import data from a range of storage sources, a query editor to conduct analysis on data stored on kdb Insights Enterprise, and a visualization workspace for displaying your data with tables and charts. Guided walkthrough users also have sample data sets to interact with and get familiar with kdb Insights Enterprise.
Additional options are available from the left-hand icon menu, and top level document bar inside the [+] menu. From these menus you can create data pipelines, import data using a simple wizard, and query your data.
Internal panels on the Overview page offer quick jumps to demo views; views give an example of some of the visualization tools you can use with your data, and a panel summarizing active data pipelines; pipelines is how data is collected from its source and imported into kdb Insights Enterprise.
What is a Pipeline?
A Pipeline is how kdb Insights Enterprise reads data from its source and writes it to a database. kdb Insights Enterprise offers two ways of doing this: The first is to follow the steps of a data import wizard which guides you through the various required steps to read data from its source, transform, then write data to a kdb Insights Enterprise database. Data ingested in this manner can come from one of the main cloud storage service providers, a relational database, a distributed event streamer (Kafka) or a simple kdb+ expression. The end-point of the import wizard is a pipeline which can be saved, then deployed, to start the data transfer process to kdb Insights Enterprise. The second method to ingest data is to use a freeform, visual pipeline builder, which allows users create their own data paths from reader to writer by connecting sets of nodes in a workspace. Custom pipelines offer plenty of flexibility, with function maps allowing for q/sql intrepretations and machine learning manipulations of data prior to writing the results to the database.
Guided Walkthrough
Guided Walkthrough is the fastest and easiest way to get started with kdb Insights Enterprise.
Sign-in Registration
The first step to gaining access kdb Insights Enterprise is to create a standard user. This user must be created in Keycloak via the admin account:
https://${INSIGHTS_HOSTNAME}/auth
What is Keycloak?
Keycloak is an open-source, single-sign-on authentication service and management tool. Keycloak offers enhanced user security built from existing protocols and can support authentication via social platform providers like Google, Facebook or GitHub.
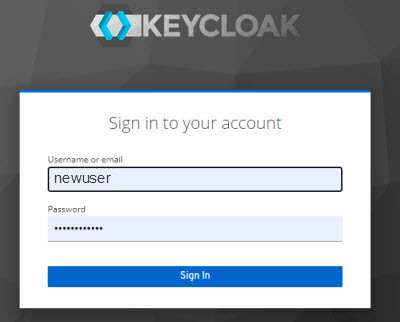
A Keycloak login dialog. Granted access will open the Overview page of kdb Insights Enterprise.
This user should be assigned all Available Roles before setting a password; the user will be prompted to change this password when they first login. Once created, logout of the Admin Keycloak account and close the tab.
Next, open a new browser tab and direct it to https://${INSIGHTS_HOSTNAME}, then sign-in as the newly created user.
For more information on Keycloak and its use in kdb Insights Enterprise.
Register a new user for kdb Insights Enterprise.
Overview
The Overview page is the home page of kdb Insights Enterprise.
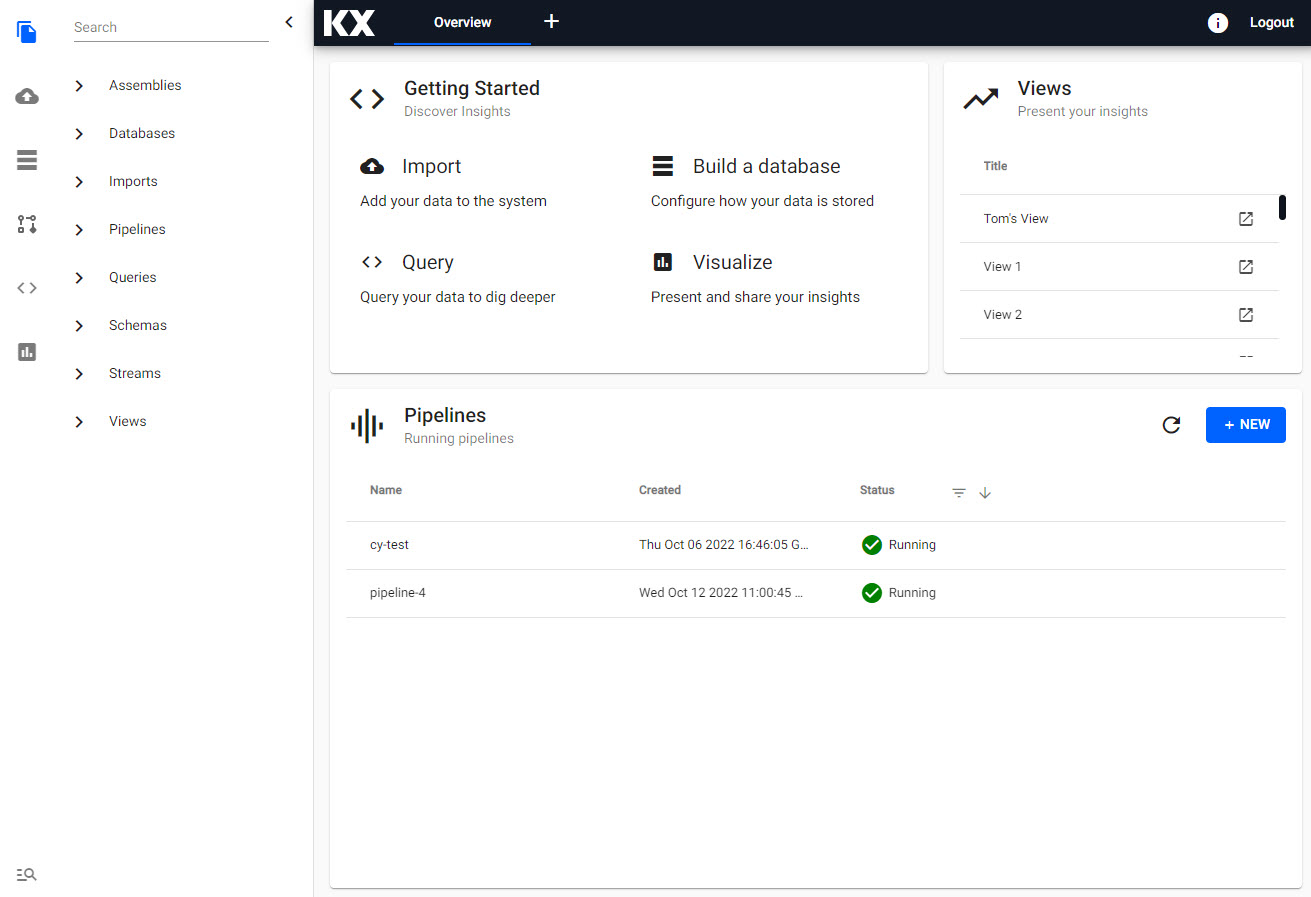
The home page of kdb Insights Enterprise is the Overview screen.
The Overview page is comprised of:
-
A left-hand prospective icon menu, which returns users to the home page but also gives access to import, database wizard, pipeline templates, queries and views. This menu is customizable; right-click on the icons, and a dialog with check-boxes for each item in the menu is provided.
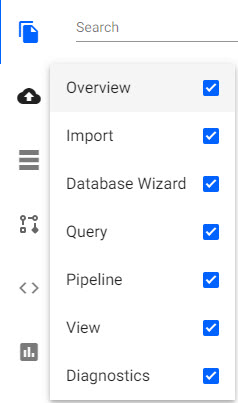
The prospective menu is an icon driven menu offering single-click access to the main functions of kdb Insights Enterprise. -
An entity-tree menu which updates depending on the user interaction; for example, when working with a pipeline template it will give a list of pipeline nodes, when running an import it will show a list of steps, while on the home page it's a navigation menu to assemblies, databases, pipelines, schemas and streams.
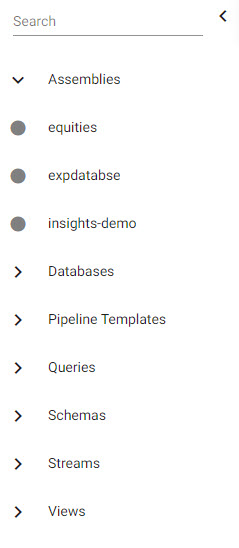
The entity-tree menu is a dynamic menu which updates depending on the user interaction with kdb Insights Enterprise. This view shows the entity-tree menu for the Overview page. -
A top level document menu bar of tabbed pages, accessible by clicking [+]. With the document bar you can open multiple pipelines, queries, views etc. These pages will also be available from the entity-tree menu on the overview home page.
![The document menu bar allows users open multiple instances of items as tabs from the [+] menu.](img/index/documentbar.jpg)
The document menu bar allows users open multiple instances of items as tabs from the [+] menu. -
An informational button
 gives product version information and a link to the selected version documentation.
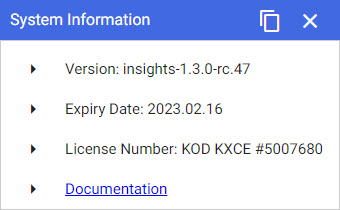
An informational pop-up giving the product version and a link to the online documentation -
A "Getting Started" panel offers jump points to the main actions on kdb Insights Enterprise: import data, create a database inside an assembly, query your data, or build a view of your data.
-
A "Views" panel is a list of demo and user-built views. Demo views illustrate the visual capabilities of kdb Insights Enterprise; click
 to open the selected view in a tab on the document bar.
 -
A "Pipelines" panel. This lists the status of data pipelines, if they are
creating,runningor haveerrored. New pipeline instances can be created by clicking .
.
Views
A list of demo and custom-made data visualizations; click the link to open the selected view.
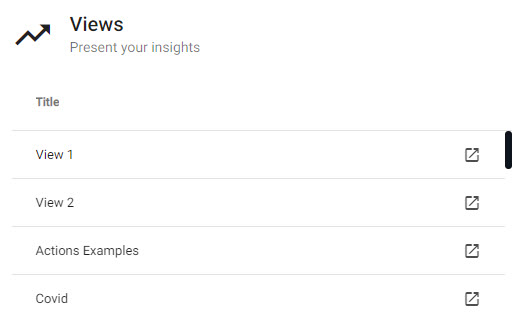
Views are visualizations of data, access can be obtained by clicking the jump link
What is a View?
A view is a visual representation of data, an arrangement of charts, tables, maps and other visual elements, including user inputs like text inputs and dropdown menus, to create an interactive dashboard built off sourced data. Views are similar to KX Dashboards in their construct, but differ in how data is utilized; KX Dashboards use embedded q/sql queries to a kdb+ database to return data, while Views use tabulated data written to kdb Insights Enterprise databases as generated by data pipelines.
Pipelines
Pipelines is a list of running, and errored pipelines after deployment; a pipeline is deployed at the end of an import process or a custom pipeline build. From the Pipelines table, pipelines are managed. In the case of an errored pipeline, a diagnostics link is available to source the cause of the failure.
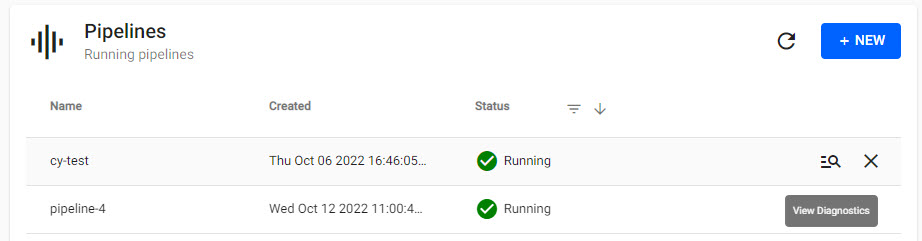
A list of pipelines creating, running or errored; a view diagnostics link allows for investigations on errored pipelines. Pipelines which are no longer required can be torndown from this table to return utilized resources.
A running pipeline will consume resources, so when use of it is finished it should be torndown. An option to clean the pipeline to remove user states is offered as part of the teardown process; note, a clean operation will not remove the data generated by the pipeline.
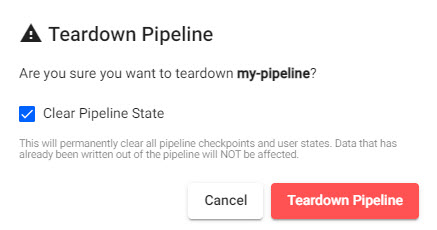
When doing a Pipeline teardown an option to clean the states of the pipeline is offered in a check box; a teardown-and-clean operation will not remove data generated in the current session.
| item | description |
|---|---|
| Name | The name of the data pipeline. |
| created | The date and time the data pipeline was deployed. |
| status | Pipeline is either in the process of creating then running or errored. |
| no header | Any warnings generated by the deployment process will show as an  to the right of status with the number of warnings generated; follow the view diagnostics link for more information on these warnings. to the right of status with the number of warnings generated; follow the view diagnostics link for more information on these warnings. |
| view diagnostics | Open an investigation of the current pipeline |
| teardown | Stops the running pipeline to reclaim resources; cleaning a pipeline removes user states, but not data generated by it. |
Test Deploy Pipelines
If running a test deploy of a pipeline, the running of this pipeline will list under Pipelines, but will be torn down automatically upon completion.
Getting Started
Once kdb Insights Enterprise is installed and running in the browser there are different ways to start using the product.
Registered User
As a registered user of kdb Insights Enterprise, the first thing to do is to create an assembly to store data. A step-by-step wizard is there to help get you started.
-
Click Build a Database. Give your database a name, select a database size.
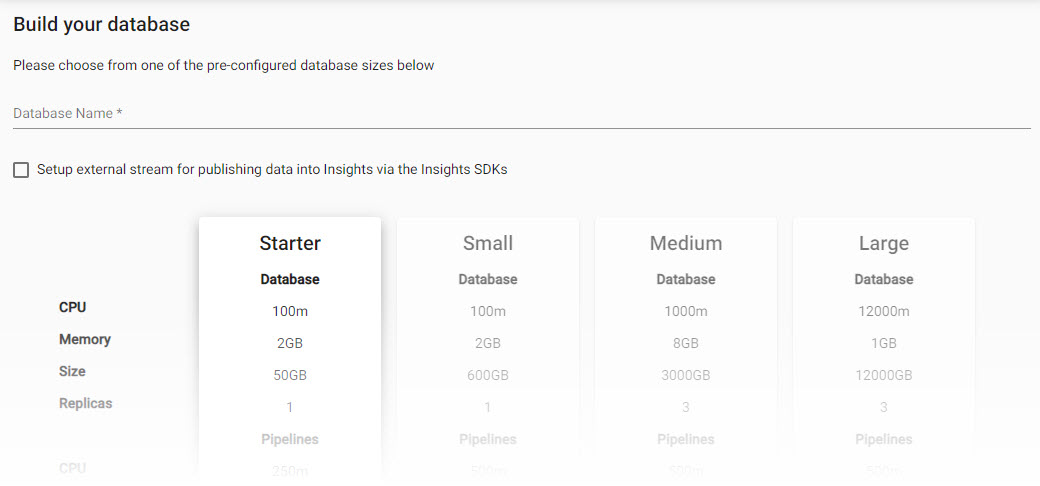
The assembly builder starts by having users select a database size.An option to add a schema will be given during the database creation process; add the following table schema, naming the table
expression:name type date Timestamp instance Symbol sym Symbol cnt Integer What is a Schema?
A schema is made up of tables which define the kdb+ types of data stored in the database for use by kdb Insights Enterprise.
Required
timestampcolumn in tablesAll tables within a schema require a
timestampcolumn. Thistimestampcolumn will default as the partition column (but can be changed) for the table, and the time data in this column will be used to define the startTS, and endTS properties of the data source of a view.For the last step, when prompted to save - save, but don't deploy.
-
With an assembly created, next import some data. The quickest (and easiest) import to demonstrate this process is to do a kdb+ expression import which requires no external data to ingest; just cut-and-paste the code below into the Expression node code editor. Use the previously created schema and
expressiontable by clicking the Parse Strings at the Configure Schema step. The final node defines the database and table to write the data too; this will again be theexpressiontable, defined by the schema in the aforementioned assembly database. Open pipeline when complete, then save.n:2000; ([] date:n?(reverse .z.d-1+til 10); instance:n?`inst1`inst2`inst3`inst4; sym:n?`USD`EUR`GBP`JPY; cnt:n?10)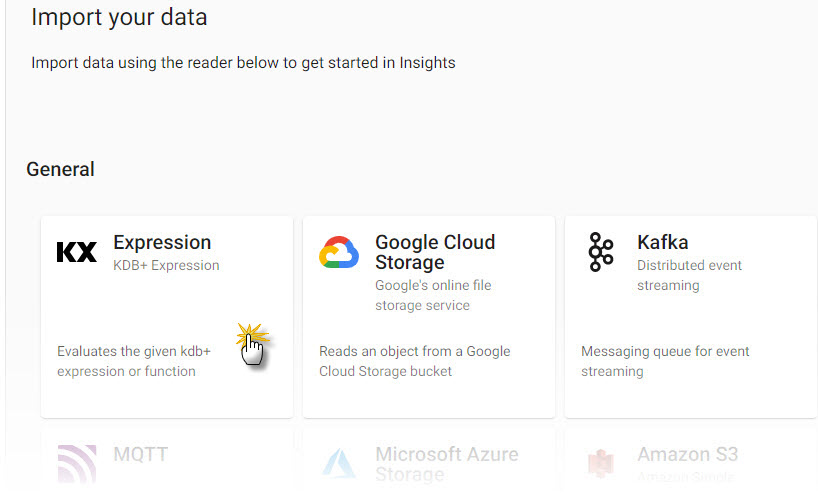
KX Expression import is the simplest means to import data to kdb Insights Enterprise.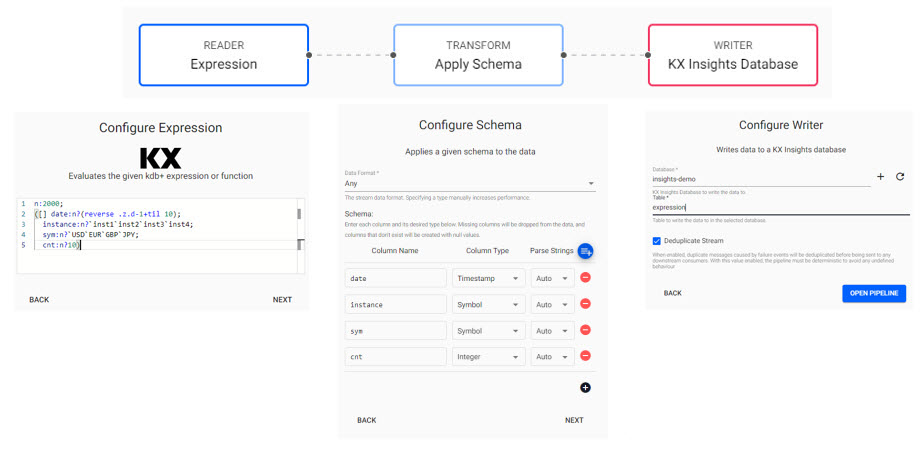
KX Expression pipeline with reader, schema transformer and database writer to a table. Cut-and-paste the kdb+/q code into the Expression Reader editor. Next, for Apply Schema, click the blue icon next to Parse Strings, select the Schema created with the wizard, and then theexpressiontable. Finally, for the Writer node, again select the database and the same schema table, which is where the data will be written too. Open Pipeline. Save Pipeline. -
Deploy the assembly and data pipeline (created via import). For the assembly, click
 which appears on mouseover of the assembly in the entity-tree menu, and select
 Deploy.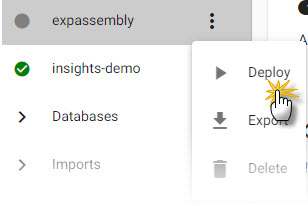
Deploy the assembly from action options available in the triple dot menu.For the KX Expression import, open Pipelines in the entity-tree menu, and select the pipeline created during the import process.
Deployfrom the pipeline menu.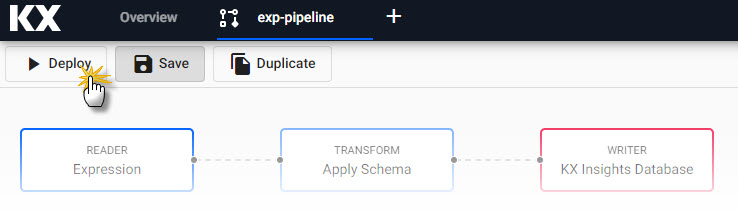
Deploy the expression pipeline from the pipeline editor view. -
When the assembly is successfully deployed it will have green tick in the entity tree menu, and the KX Expression pipeline will show as
runningunder Pipelines. Open a Query tab from the [+] menu in the Document bar.What is a Query?
Queries are how users interact with data on kdb Insights Enterprise. A query can be a simple call-up of data from a named table in the database, or it can be a SQL or q+/sql query written in the Query code editor. The results of this query are returned to kdb Insights Enterprise as a named Output variable, and the initial results displayed either in the console window, a formatted table, or simple chart view. A built-in scratchpad allows for ad hoc querying of the data using either q/sql or python against the defined Output variable. A query window can be opened from the document bar [+], the left-hand entity-tree menu or prospective icon menu, or directly from the Overview page.
In the SQL tab, run a simple select statement:
select * from expressiondefine the Output variable as
pipethen, Get Data.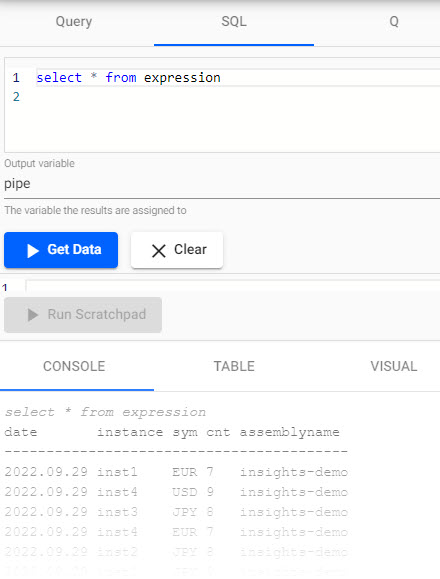
SQL query for the KX Expression pipeline. -
As a final step, we will create a view of our data. Views are accesible from the [+] menu in the Document bar. Click-and-drag a data grid into the central workspace, then "Click to populate Data Source.
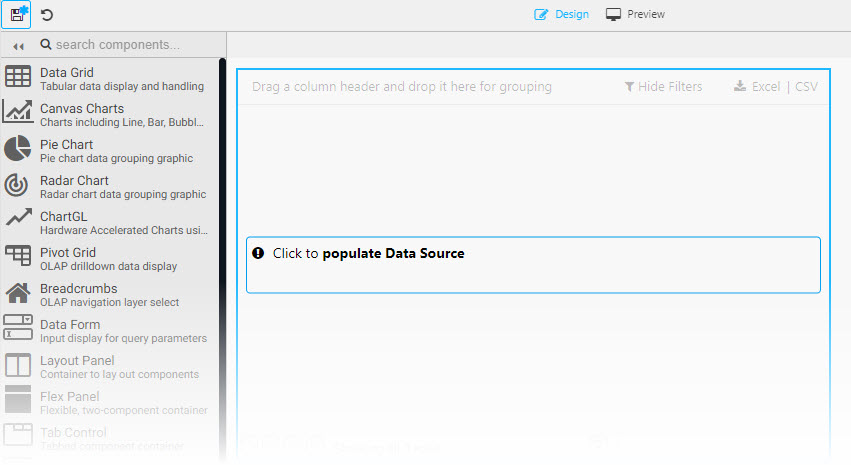
Click to populate Data Source to add data to a View component.Create a New Node and set the table, startTS, and endTS properties based on your data. The table is the name from the database as defined in your import pipeline (see the Database Writer Node of the pipeline), which is
expressionfor this example.startTS and endTS will have a start time of
00:00:00.000000000and an end time of23:59:00.000000000for the day the pipeline was deployed.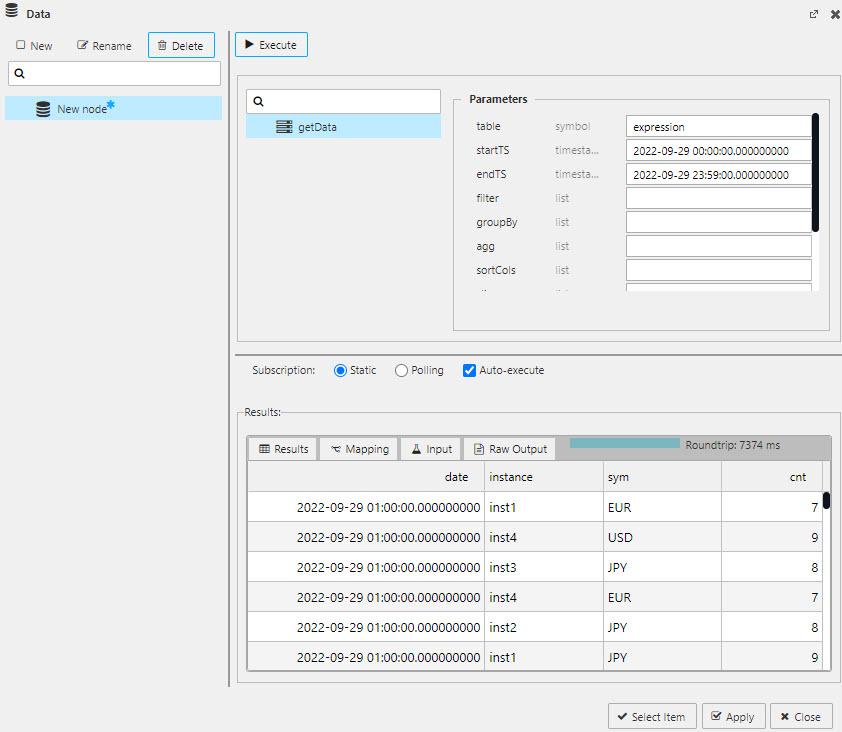
All view queries require a table name, start and end timestamp; execute, apply and select to add data to the component.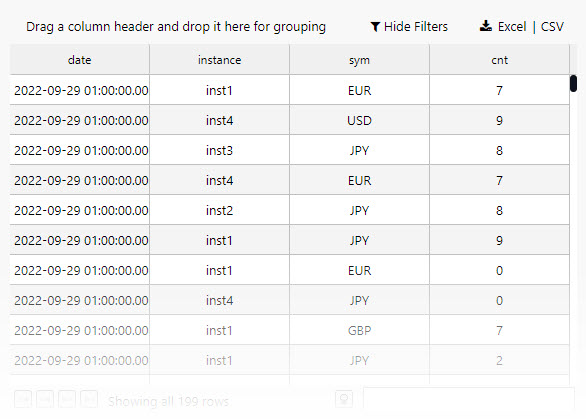
Data grid of KX Expression data.
Definitions
About
kdb Insights Enterprise: An enterprise-grade, cloud-native streaming analytics platform for all business verticals. Developed on kdb Insights and Insights Microservices, kdb Insights Enterprise inherits and extends their functional features to provide a ‘shrink-wrapped’, deployable platform ready for data capture and query, with a user-friendly interface.
Installation & Upgrade
The kdb Insights Enterprise installation guide assumes a clean installation. If a prior version has been installed, please look at the Upgrade Guide and latest Release Notes for issues surrounding backward compatibility
Assembly
An Assembly is how kdb Insights Enterprise manages data. An Assembly is made up of a database to store and manage data, a schema which has a list of tables with kdb type definitions of the data stored in those tables, a stream to push data to the database and potentially pipelines, which ingest data from external data sources and write them to the Assembly database. An assembly can be built by clicking [+] next to the Assembly name in the entity-tree.
Create your own custom assembly.
Community
Contribute to the Insights community.
Databases
A database is used to store data on kdb Insights Enterprise stores and forms part of an assembly. A database can be created as part of a new assembly or it can be created indepdently from the left-hand entity-tree menu, or top-level document bar by clicking the [+] icon. kdb Insights Enterprise database come in two forms; a pre-configured time series database and a custom database. The former is recommended if building a database outside of the assembly wizard. A database comes with an rdb (real-time) stream as a minimum, with idb (interval) and hdb (historic) part of the time series database. One of the requirements of any database created on kdb Insights Enterprise is to define a storage source, but this will be prompted as part of the creation process.
Build a custom or real-time database.
Entity Tree
The Entity-Tree is a dynamic menu always available in the left-hand side of kdb Insights Enterprise. The content of the menu changes dependent on the interaction in kdb Insights Enterprise; for example, if the User is on the Overview page, the entity tree is a list of all the assemblies, databases, schemas, pipelines, streams, queries and views you have created, if the User is on the pipeline page, then the entity tree is a list of all the nodes which are used to build data pipelines to import data from source and transform it to a format compatible with a kdb Insights Enterprise database.
The entity-tree is the selection menu available on the left margin of kdb Insights Enterprise; it includes options for for managing and creating Assemblies, Databases, Pipelines Templates, Queries, Schemas, Streams and Views.
Import
Import is the process of transferring data from an external source - for example, a csv file kept in Object Storage - and writing it to a kdb Insights Enterprise database. The import process includes a number of steps which ensure data is available in a format compatible with kdb Insights Enterprise. Data import can be initiated from the Overview page of the kdb Insights Enterprise UI.
Import data from an external data source.
Pipelines
Pipelines are the end product of an Import, but they are also an independent feature which can be built inside kdb Insights Enterprise. A pipeline is the process of reading data from an external source and writing it to a KX Insights database; during this process, it may be necessary to transform the data using a schema. Pipelines are customizable and Pipeline Templates allow you build a pipeline from scratch using a simple drag-and-drop interface of various reader, writer, transformation but also machine learning 'nodes'. These various 'nodes' ultimately shape the pipeline. When reference is made to a pipeline in the documentation, it's referencing the data collection process to the KX Insights database.
The status of pipelines can be viewed from the Pipelines listed on the Overiew page. Pipelines are either Creating, Running or Errored.
Create a pipeline template to read data from an external source.
Queries
Once data is available on a KX Insights database, the next step is to interact with the data using queries. Queries are run using q, sql or a data table reader with supporting filters; note, the timestamp filter is a compulsory filter for the data table and will be prompted before executing a query. Queried data is written to an output variable. It's this output variable which can be further queried using q or python in a scratchpad. Output variable results only persist for the current session, but if you wish to use data in a database in a view you must use the table name as referenced in the schema of your database. Ad-hoc analysis from the scratchpad is sent to a console, table or simple chart view output.
Query your data with q or python.
Schema
A schema is one of the components of an assembly. A schema consists of one or more tables, and each table has a list of columns corresponding to the data been read from source. The table gives the column name and the kdb+ type for each read data column, i.e. the kdb+ type used by kdb Insights Enterprise database. The table schema also has supporting properties for defining data partitioning. With kdb Insights Enterprise, it's a requirement to partition data using a kdb+ timestamp column - so it's necessary to ensure any data read from an external source has a timestamp data column it can use. Schemas can be built by clicking the [+] icon in the left-hand entity-tree menu or the top-level document bar. Once a schema is created it should be associated with an assembly, although if building an assembly with the wizard there is a step for adding a schema to that assembly.
Build a schema with a set of tables for data I want to import.
Assembly Wizard
When users can build their own assembly which includes a database and schema using the Build a Database wizard. This assembly can be used to store data in kdb Insights Enterprise and is the recommended path for new users to start using kdb Insights Enterprise.
Create your own assembly using the database-builder wizard.
Streams
Streams are how data is written to KX Insights databases. A stream is given a name which frequently follows the naming convention of the database name it's been used to write data too. An assembly requires a stream; a stream will automatically be created when using the assembly wizard.
I need to add a stream to my assembly.
View
Views is how kdb Insights Enterprise builds visualization of your data. Views use the data tables written to kdb Insights Enterprise database generated as part of the import process (either using the import wizard or the custom data pipeline template) and make them available inside a visualization tool which offers charts, tables, maps, user inputs and more. Created views can be shared with colleagues inside the browser.
Build a visualization of my date with View.
Guided Walkthrough
A guided walkthough is available to help users get started on kdb Insights Enterprise.
I want to take advantage of kdb Insights Enterprise guided walkthrough.