Kafka (Subway)
Apache Kafka is an event streaming platform that can be easily published to and consumed by kdb Insights Enterprise. The provided Kafka feed has live alerts for NYC Subway trains containing details such as arrival time of train, stop location coordinates, direction and route details, all as part of the subway data set.
No kdb+ knowledge required
This example assumes no prior experience with q/kdb+ and you can replace the endpoints provided with other Kafka brokers to gain similar results.
Creating the Pipeline
First select the import wizard; the import wizard can be accessed from the [+] menu of the Document bar or by clicking  from the left-hand icon menu or Overview page. All created pipelines, irrespective of source, are listed under Pipelines in the left-hand entity tree menu.
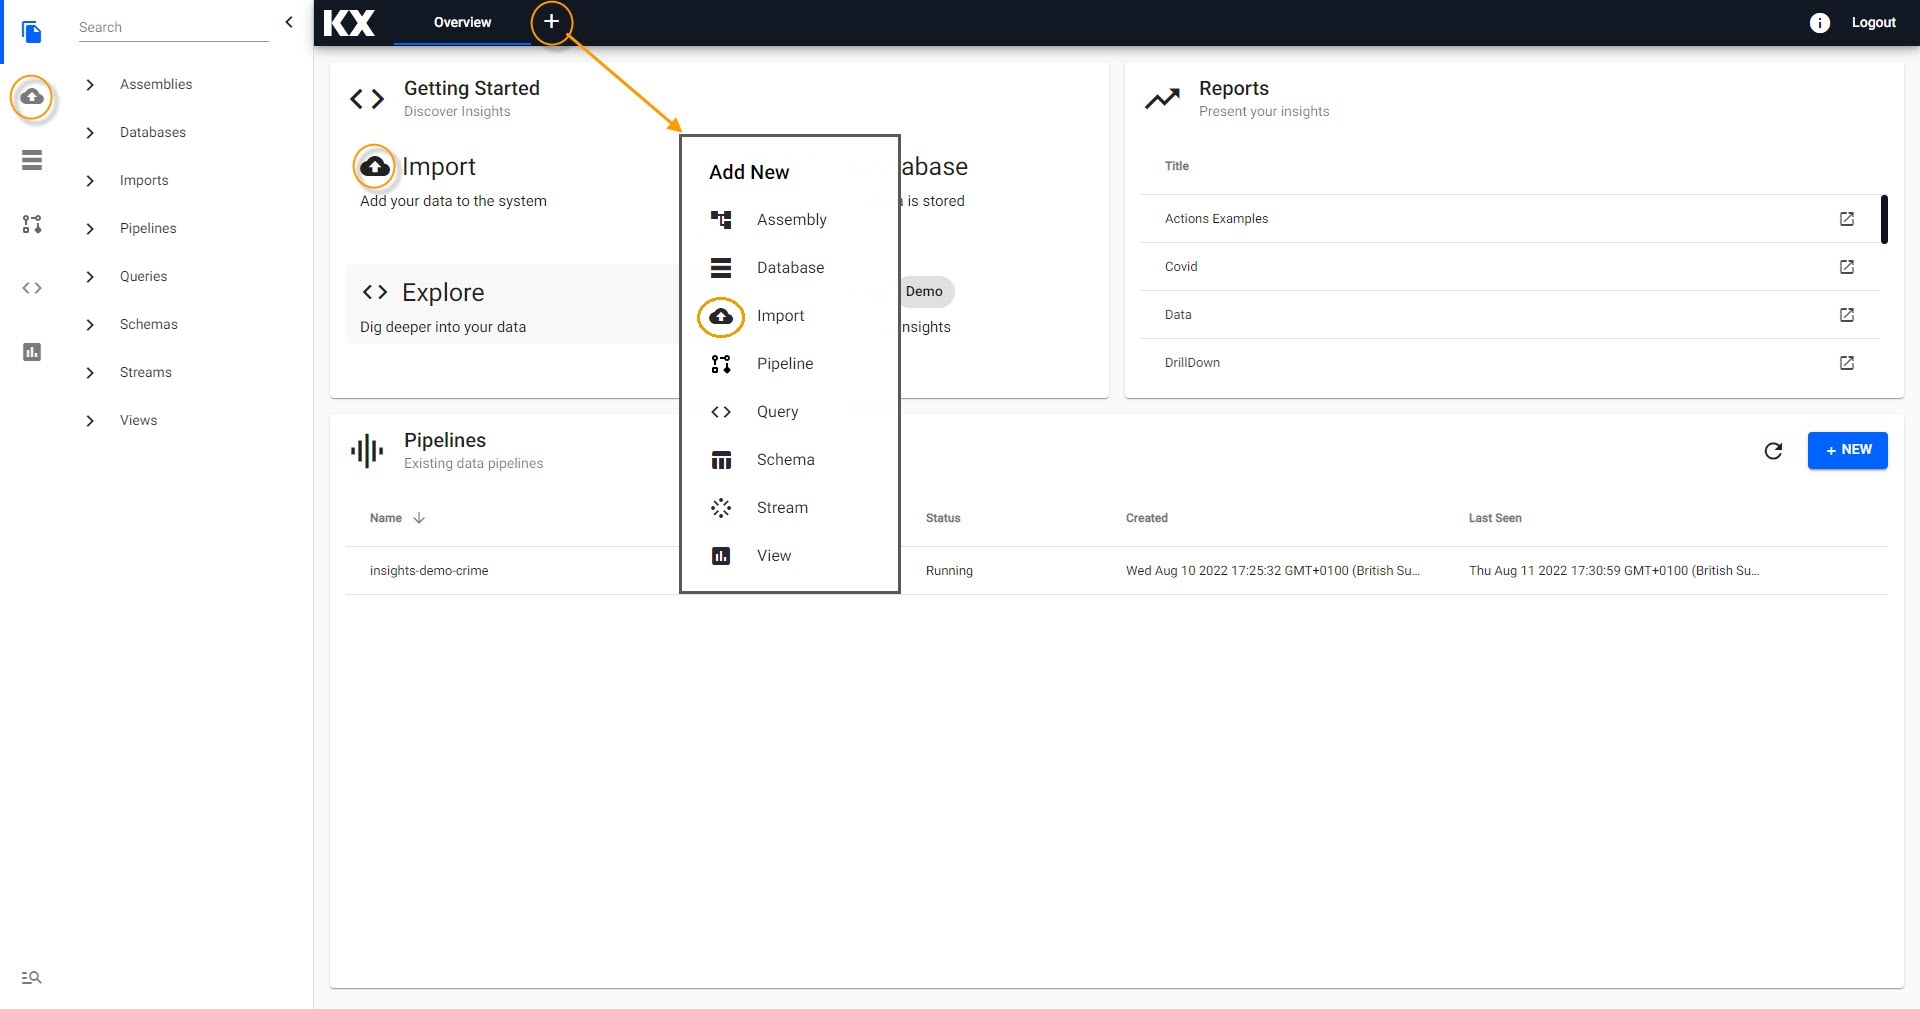
The Import menu is available from the document bar, overview page and left-hand icon menu.
Select Kafka import from available Import options.
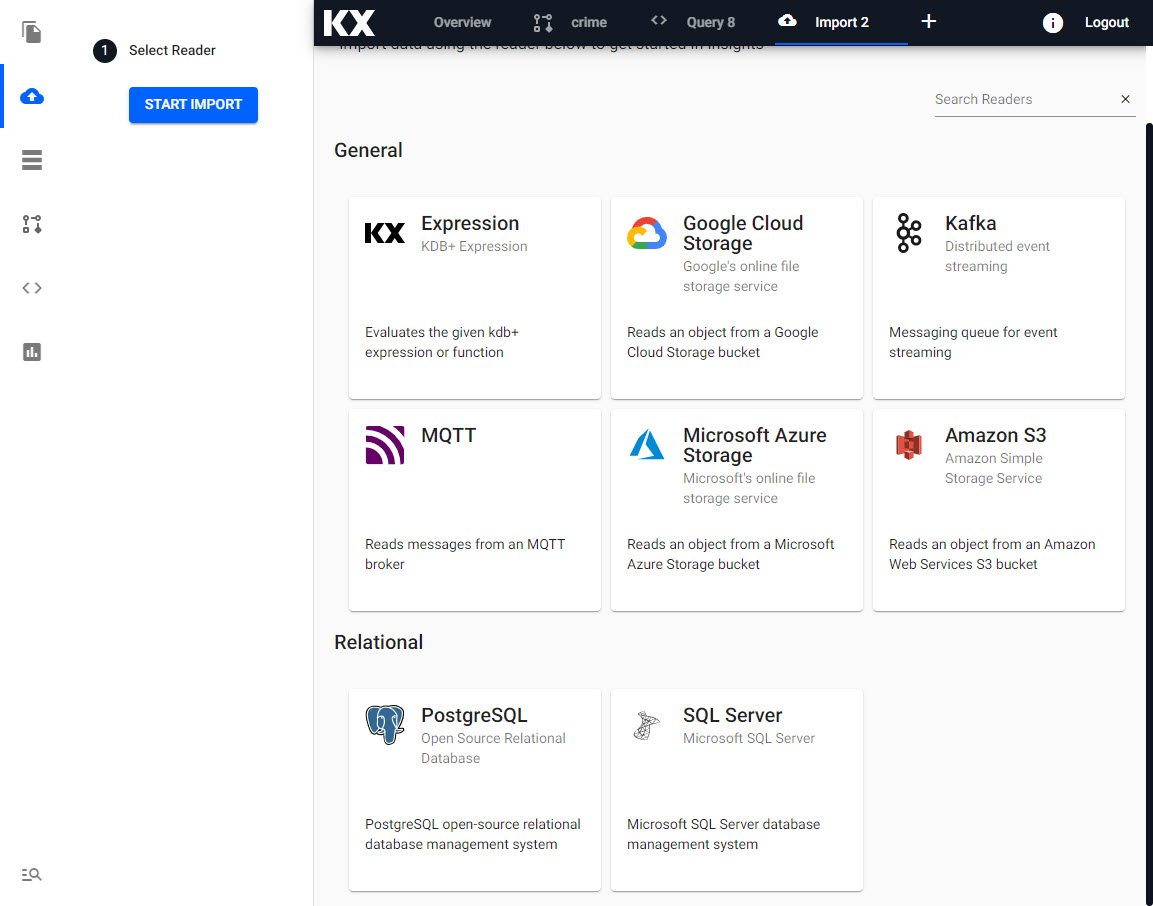
Select a Reader
Select Kafka from the import options.
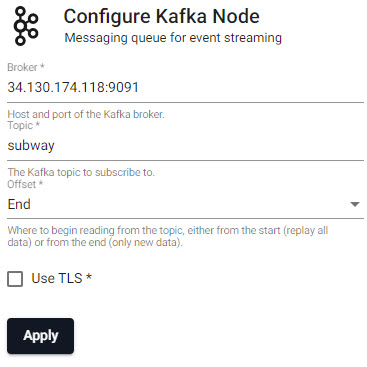
Kafka node properties for Broker, Topic and Offset.
Configure Kafka
Fill in the settings from the grid below:
| setting | value |
|---|---|
| Broker* | 34.130.174.118:9091 |
| Topic* | subway |
| Offset* | End |
| Use TLS | No |
Click Next when done.
Select a Decoder
Event data on Kafka is of JSON type; select the related decoder to transform the imported data to a kdb+ friendly format (a kdb+ dictionary).
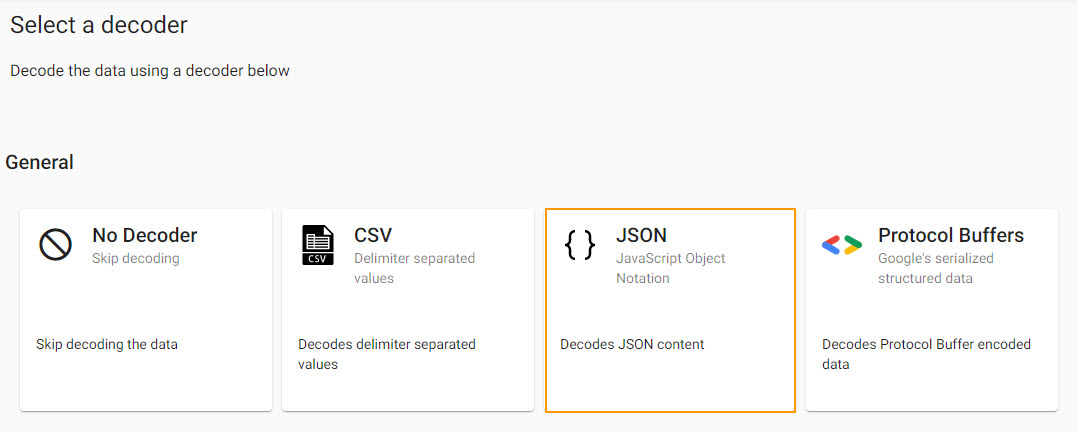
Select the JSON decoder.
Clicking on the JSON decoder will move the import wizard to the next step.
Configure JSON
The next step is a decoder step specific to JSON, and defines whether the decode parse should be done on each value. This can be left unchanged.
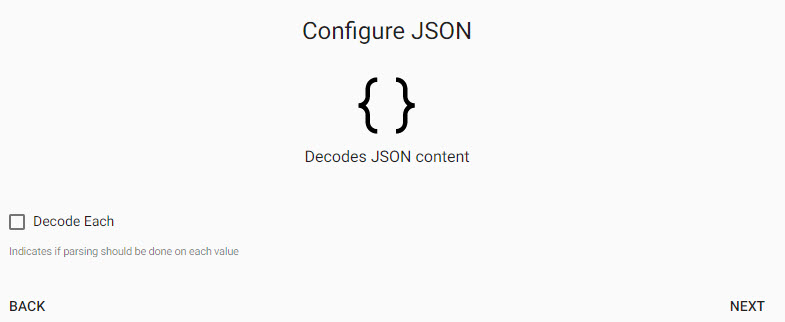
The JSON decoder default setting can be used; leave Decode Each unchecked.
Click Next when done.
Configure Schema
Imported data requires a schema compatible with kdb Insights Enterprise. The insights-demo has a schema table for each of the data sets available. The configure schema step applies the kdb+ datatypes used by the destination database and required for querying the data in kdb Insights Enterprise, to the data we are importing.
The next step applies a schema to the imported data.
| setting | value |
|---|---|
| Apply a Schema | Checked |
| Data Format | Table |
To attach the schema to the data set:
-
Leave the Data Format as the default value of
Any -
Click

-
Select the
insights-demoSchema from the dropdown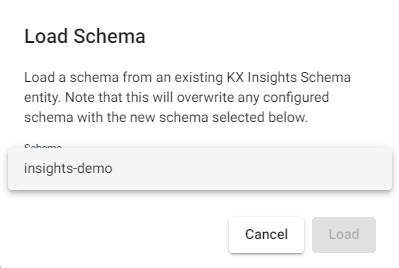
Select a schema frominsights-demo. -
Choose the Table
subway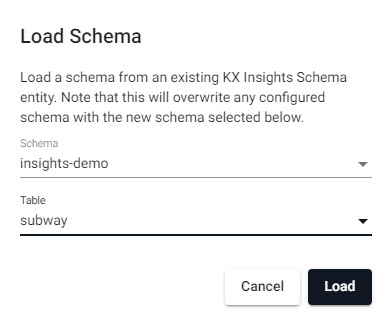 Choose the
 subwaytable from theinsights-demoschema. -
Leave Parse Strings set to
Autofor all fields.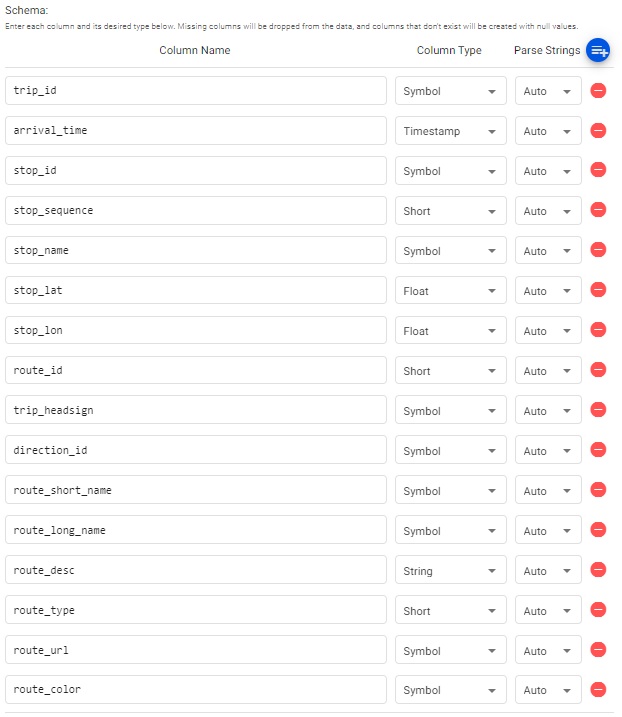
Ensure the Parse Strings option is set toAutofor all columns
Click Next when done.
Configure Writer
The final step in pipeline creation is to write the imported data to a table in the database. We will use the insights-demo database and assign the imported data to the subway table.
| setting | value |
|---|---|
| Database | insights-demo |
| Table | subway |
| Deduplicate Stream | Yes |
Click  when done. This will complete the import and open the pipeline in the pipeline viewer
Writer - KX Insights Database
The Writer - KX Insights Database node is essential for querying data in a pipeline. This node defines which assembly and table to write the data too. As part of this, the assembly must also be deployed; deployments of an assembly or pipeline can de done individually, or a pipeline can be associated with an assembly and all pipelines associated with that assembly will be deployed when the latter is deployed.
Pipeline view
The pipeline view allows you to review and edit your pipeline by selecting any of the nodes.
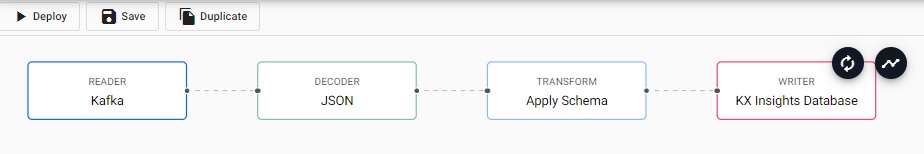
The completed subway Kafka pipeline.
Additional functionality is required to convert this particular Kafka import to a kdb+ table before it's deployed. This can be done by inserting a Function node into the pipeline created by the import wizard.
From the Pipeline entity-tree menu, select the Map function and drag this inside the pipeline workspace
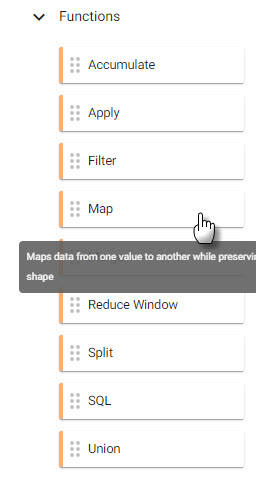
Click-and-drag the Map function node into the pipeline workspace.
We will connect this to the pipeline between the Decoder and Transform nodes and right-click on the connection between the Decoder and Tranform nodes to remove it, as shown below.
Connecting nodes in a pipeline.
Select the Map function node to edit its properties
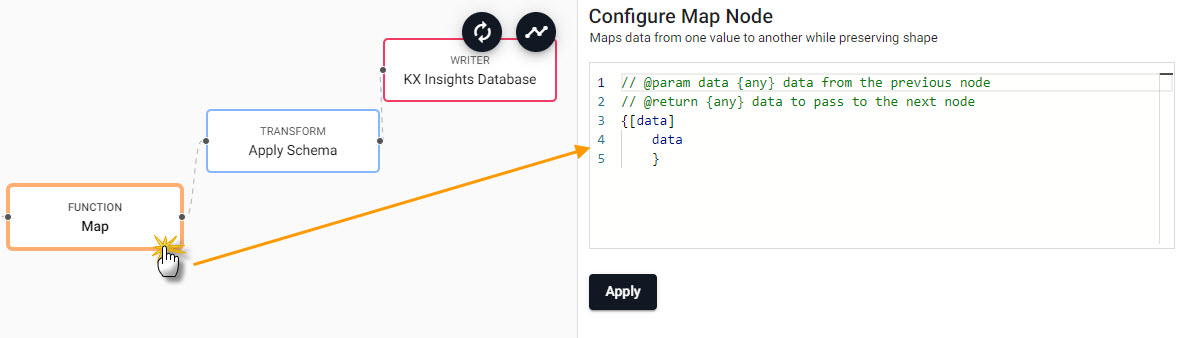
Select the Function Map node to edit its properties.
The Map function will transform the kdb+ dictionary format using enlist. To achieve this, copy-and-paste into the Configure Map Node code editor the following kdb+/qand select Apply.
{[data]
    enlist data
}
Save the pipeline; the pipeline name should be unique; for Free Trial, there is a pipeline already named subway, so give this new pipeline a name like subway-1.
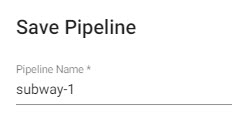
Save the pipeline as subway-1.
The newly created pipeline will now feature in the list of pipelines in the left-hand-entity tree.
Deploying
The next step is to deploy your pipeline that has been created in the above Importing stage:
-
Select Deploy.
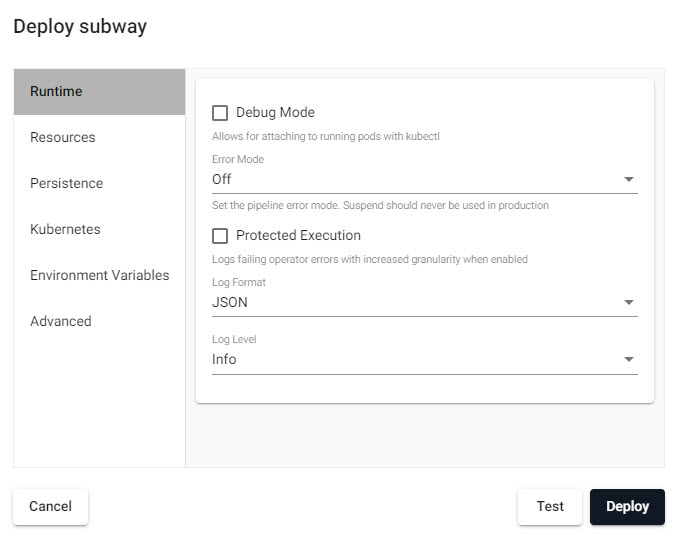
Deploying the subway pipeline. -
On the Deploy screen that appears select Deploy.
-
Once deployed you can check on the progress of your pipeline back in the Overview pane where you started.
-
When it reaches
Status=Runningthen it is done and your data is loaded.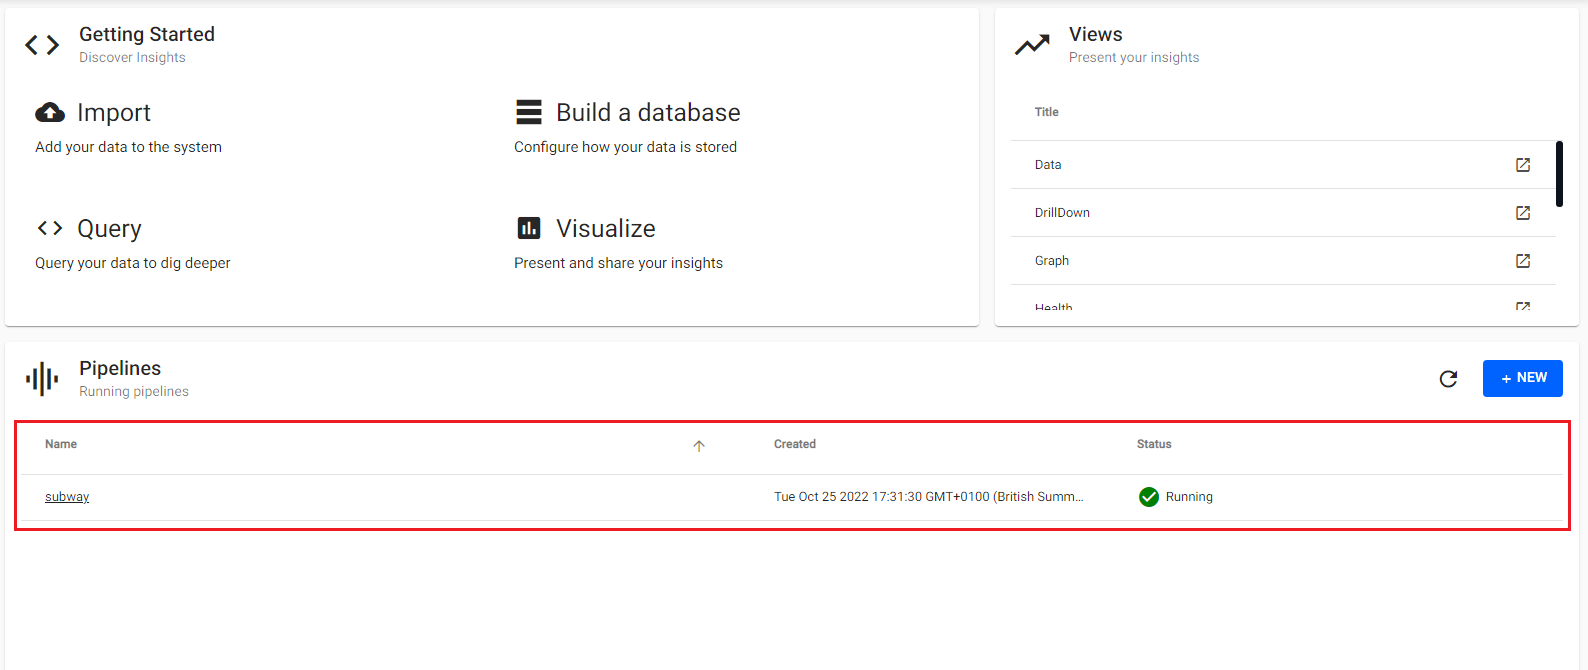
A running Kafka pipeline will show its status with a green circled tick.
I want to learn more about Pipelines
Querying
Select Query from the Overview panel to start the process of querying your loaded data. See here for an overview of the Query Window.
In the Query tab there are a few different options available to you, Query, SQL and q. Let's look at SQL.
You can run the following SQL to retrieve count of the subway table.
SELECT COUNT(*) FROM subway
Output Variable and then select Get Data to execute the query.
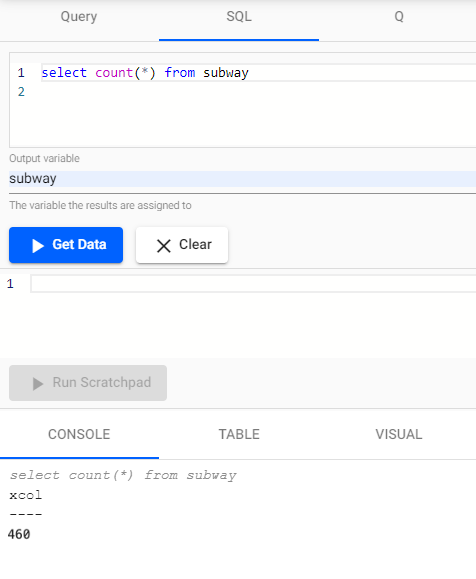
A SQL count of data rows for subway data set.
Rerunning this query a short while later you should notice the number increase as new messages appear on the Kafka topic and are ingested into the kdb+ table. You have just successfully setup a table consuming live events from a Kafka topic with your data updating in real time.
Refresh Browser
You may notice a delay when waiting for your SQL output but this is as expected due to the frequency of the live data. If this is the case, it is a good idea to refresh your browser and retry.
Troubleshooting
If the tables are still not outputting after refreshing your browser, try our Troubleshooting page.
Let's ingest some more data! Try next with the PostgreSQL Dataset on Health Data.