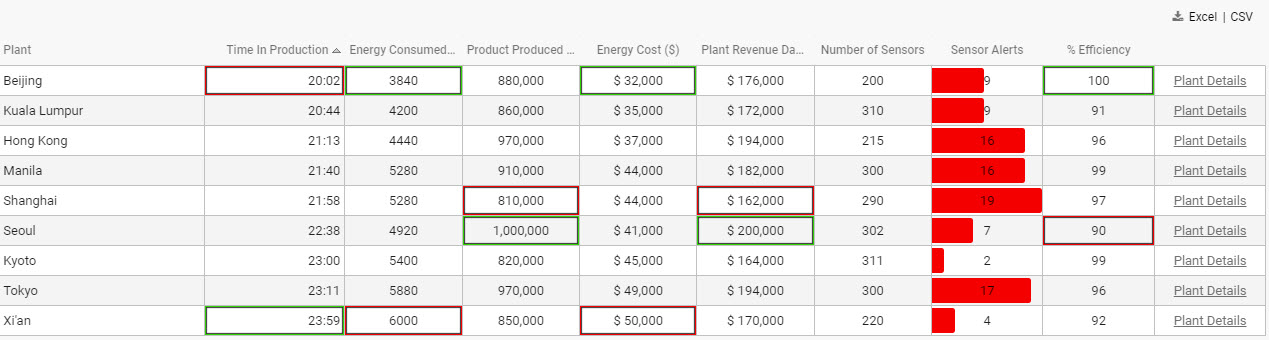
Pivot Grid
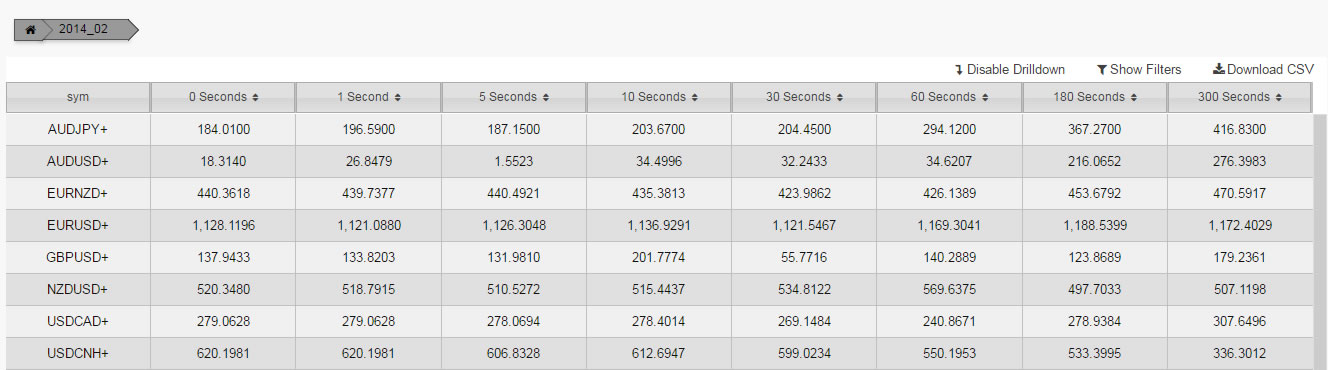 A Pivot Grid with user tools showing
Displays a Pivot/OLAP control data set
Set up
-
Define the data source, and ensure pivot query is selected.
-
Set [Focus] property to align with Breadcrumbs component.
Basics
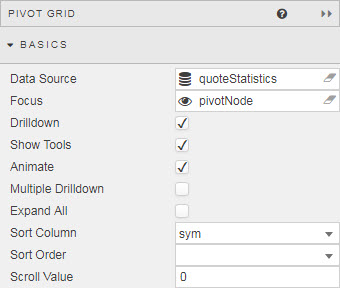
- Data Source
- Pivot Query: the source data for the grid.
- Focus
- A View State Parameter Used for linking components.
- Drilldown
-
When checked, enables Drilldown.
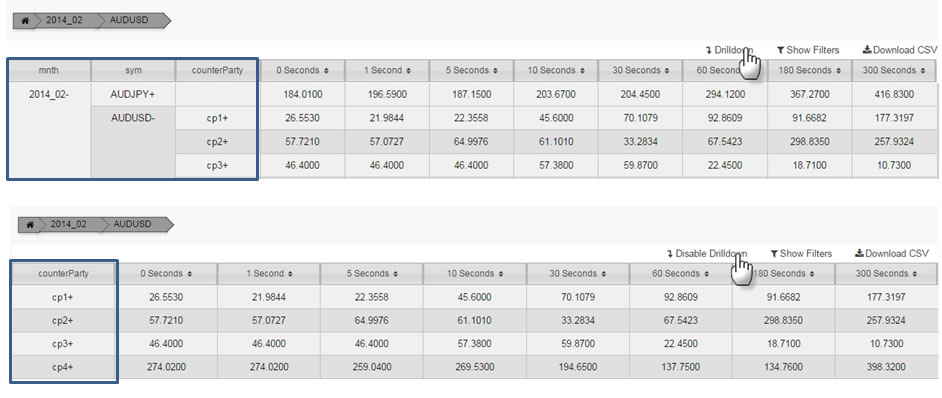
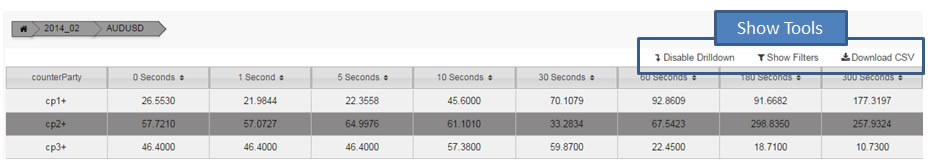
Drilling down - Show Tools
-
Show user controls: Drilldown, filtering and download.
- Animate
- Offer smoothing animation on drilldown versus a 'hard' drilldown.
- Multiple Drilldown
- Supports multiple OLAP drilldown paths versus the default single drilldown.
- Expand All
-
All OLAP elements are expanded on Pivot Grid load.
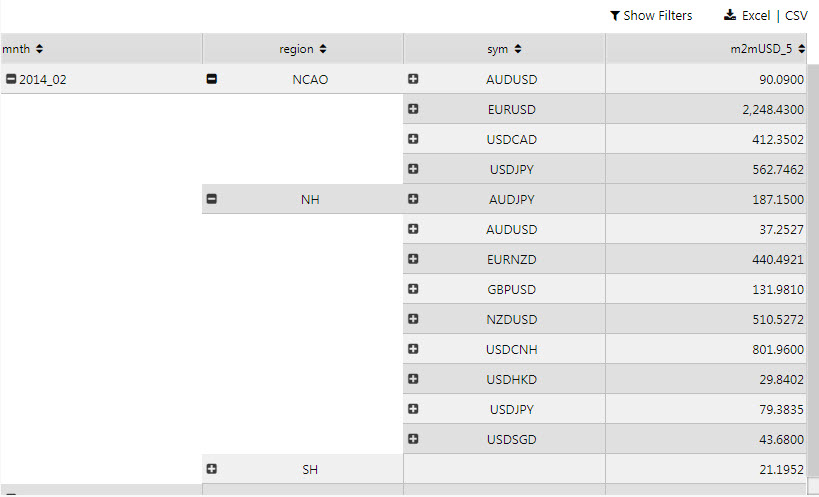 Two expanded OLAP pivots
 - Show Expanded Summary
- For a drilldown row, when checked include the parent summary values otherwise only show the child drilldown values
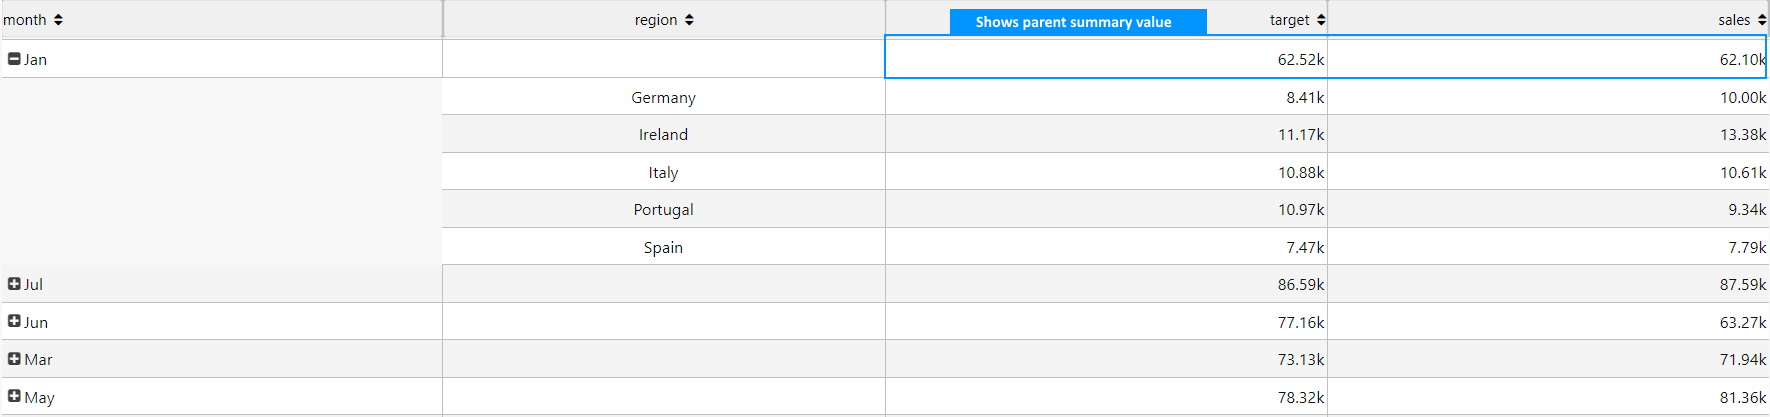 Expanded Parent Summary row
- Sort
- Sort Column and Sort Order define the default sort order,
ascendingordescending, for the selected data source column on load. - Scroll Value
- A number representing the distance in pixels from the top of the pivot grid to the currently visible scroll position.
- Show Cached Column
- Toggle property display for Cached Columns.
Breakdown columns
Appearance of columns from the Pivot Query.
- Display Name
- A name for the column.
- Tooltip
- Text description active on rollover of column header.
- Min Width (px)
- Min Width (px) is a protective fall back if _Width (relative) is unable to render columns correctly.
- Width (relative)
-
Column width relative to total width of Pivot Grid. Scale relates to the values of each column; for example, a column of Width (relative) of 20, in a Pivot Grid using column widths of 20, 10, 5, 1 will scale at a column width of 55% (i.e. 20/(20+10+5+1)).
Relative columns scale according to the browser size.
- Text Align
center,left,right- Sortable
-
When checked, shows sort controls in column headers:
- Format
Formatted columns- Precision and Hide Trailing Zeroes
- Number of decimal places used to display numeric, and whether to show trailing zeroes.
- Currency Symbol
- Text representation of currency symbol in data column; select from
$,£or€.
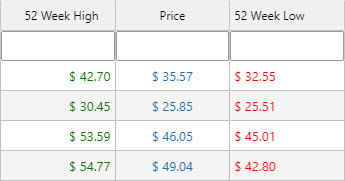
Currency columns with prefixed symbols
- Date Format and Time Format
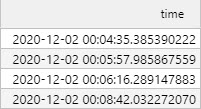
Timestamps with a DateTime format- Percentage Color
-
A color: where Format is Percentage, displays a mini bar in the range 0-100%.
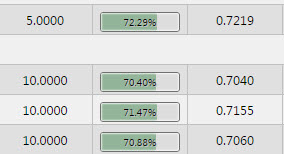
Percentage values with mini barsView State Parameter
Percentage Color can be a View State Parameter: roll over the end of input bar until until the eye icon appears, click the icon to assign the view state.
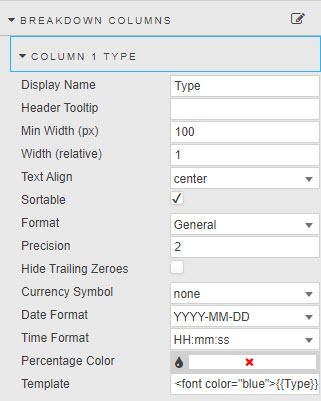
- Template
- Apply HTML customizations with Handlebar helpers; for example:
<font color="blue">{{column name}}</font>-
where
{{column name}}is the reference name for the column from the data source.
Aggregate columns
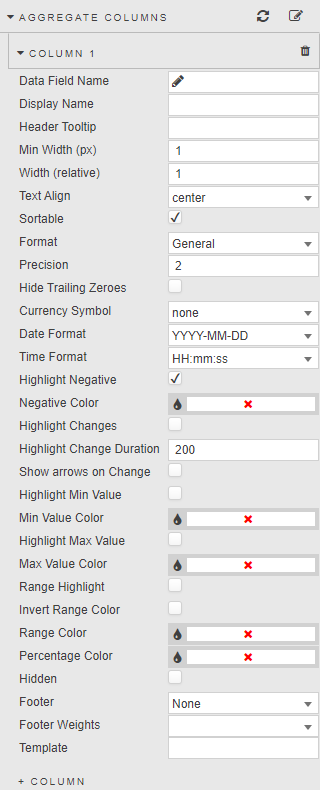
Dependent columns from the pivot query
- Data Field Name
- A Data Source column.
- Display Name
- Column name.
- Tooltip
- Rollover text description of header.
- Min Width (px)
- Min Width (px) is a protective fall back if _Width (relative) is unable to render columns correctly.
- Width (relative)
- Relative measure to total width of Pivot Grid. Scale is contigent on the values of each column; for example, a column of Width (relative) of 20, in a Pivot Grid using column widths of 20,10,5,1 will scale at a column width of 55% (i.e. 20/(20+10+5+1)) Columns will scale according to the viewable browser area.
- Text Align
- Alignment of values inside Pivot Grid: left, center, right.
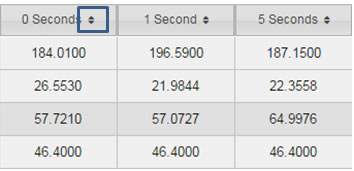
- Sortable
- When checked, shows sort controls in column headers.
- Format
- Formatting for the data in the column.
- Precision
- Where data are numeric, the number of decimal places to display.
- Hide Trailing Zeroes
- Removes trailing zeroes from displayed values.
- Currency Symbol
Values with prefixed currency symbols- Date Format
- Time Format
-
A Date format and a Time format: where Format is Date, Time, or DateTime the display format is combined from Date Format and Time Format.
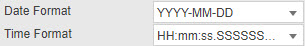
A DateTime column with both a Date Format and a Time Format - Highlighting negatives
-
When Highlight Negative is checked, negative values will be shown in Negative Color.
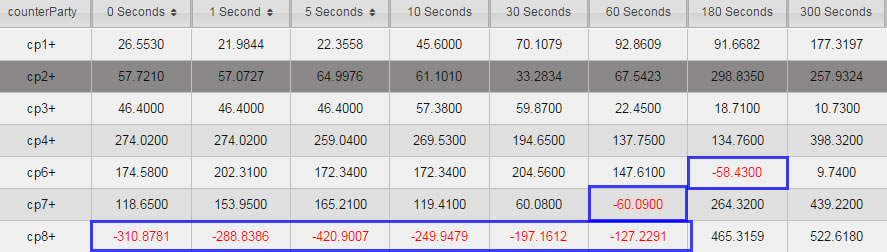 Pivot Grid with negative numbers highlighted
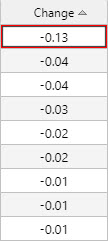
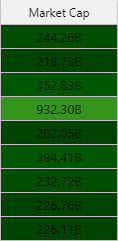
 - Highlighting changes
- When Highlight Changes is checked, cells will highlight green (for higher than previous value) or red (for lower than previous value). Used for streaming or polling data; the persistence of the highlight is controlled by Highlight Change Duration.
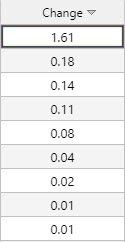
- Show arrows on Change
- When checked, up and down arrows will appear when value is greater or less than previous value. Used for streaming or polling data.
- Highlighting highs, lows and ranges
-
Checkboxes Highlight Min Value, Highlight Max Value, and Range Highlight apply colors to highlight values:
Columns with Min Value Color, Max Value Color, and Range Color applied - Invert Range Color
- Flip range color usage; dark shade for high values, light shade for low values.
- Percentage Color
-
A color, used for mini-bars when Format is Percentage.
Colors can be View State Parameters
Min Value Color, Max Value Color, Range Color, and Percentage Color can be View State Parameters.
- Footer
-
Adds a column sub-total value for
weighted average,average,count,sumornone.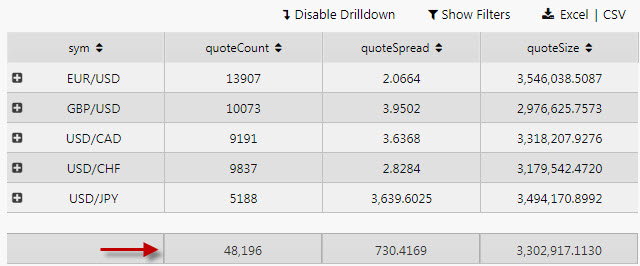
- Footer Weight
- Applies a weighting to current column by selected data source variable. For this to be enabled, Footer must be set to
weighted average.
Selection and routing
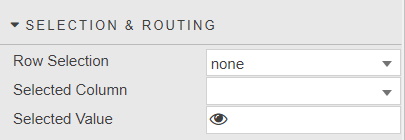
With Row Selection, values from the selected grid row or cell are mapped to a View State Parameter.
Action
Highlight rules
File export
- Full Export Override
- Overrides the pivot query dataset with an alternative dataset.
Cached Columns
- Cached Breakdown Columns
- Cached Aggregrate Columns
- A list of dependent and appearance columns that can be defined by the pivot query or an user. For dynamic pivot queries where the column data can change, the cached columns can be used to populate the breakdown and aggregrate column list.
Style
Style for common settings
- Even Row Background & Odd Row Background
- Background colors of the even and odd rows
- Selected Row Background
- When Enable Row Selection is checked, the background color of the selected row
- Expanded Summary Style
- When Enabled sets a background colour, underline and bold text for the expanded summary
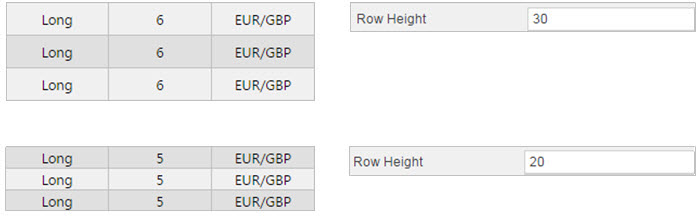
- Header Row Height
- Row Height
- Header Text Transformation
- Text transformation for column headers
- Header Font Weight
- Font weight for column header
- Font Family
- Font family for column headers and rows
- Font size
- Font size for rows (css format), e.g.
18px,0.8em,80%,larger