Highlight rules
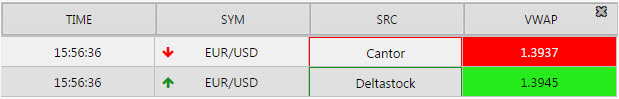
Highlight rules in operation in a Data Grid
Highlight rules are a common property utilizing color and/or icon markers to notify users of value changes and are best used with real-time streaming or polling data.
Canvas Chart, Data Grid, Pie Chart
Build a rule
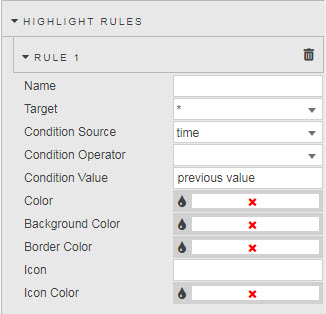
- Name
- Assign a name for your rule
- Target
- The Data Source column updated when the rule is true
- Condition Source
- The Data Source column monitored by the Condition Operator against the Condition Value
- Condition Operator
-
may be a numeric comparison, but can also test for strings in text values
operator explanation search find Condition Value match; assign View State Parameter and pair with Text Input. contains find all instances with the Condition Value starts with find all instances starting with the Condition Value ends with find all instance ending with the Condition Value == exact match, e.g. client name < less than Condition Value > greater than Condition Value <= less than or equal to Condition Value >= greater than or equal to Condition Value != excludes Condition Value - Condition Value
- Typically
previous value. Can also be mapped to a View State Parameter. Condition Value can either be a numeric or text value; e.g. if searching for a client name from a list of clients in a Data Grid column. - Color
- Text color changed by rule when true
- Background Color
- Data Grid cell background or Canvas Chart bar or point changed by rule when true
- Border Color
- Data Grid cell border or Canvas Chart bar or point border changed by rule when true
- Icon
- Icon Color
- For Data Grid, icon appears when rule is true.
Gradient
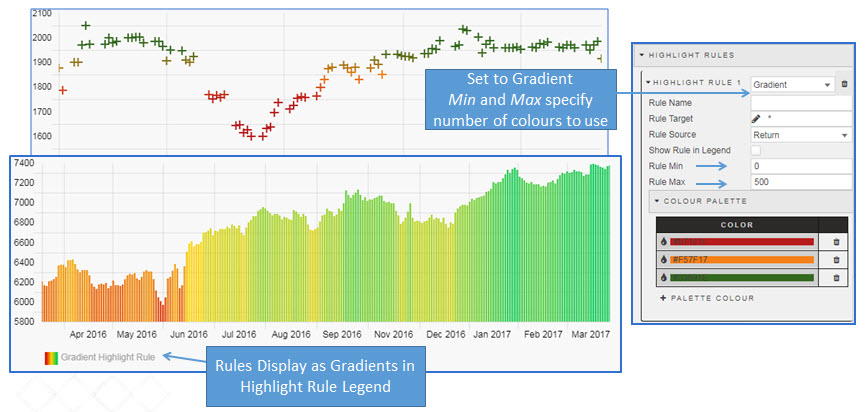 Gradient highlight rule applied to bubble and bar canvas chart
Set a gradient color using Color Palette with a range defined by Rule Min and Rule Max