Diagnostics
Troubleshoot issues with your database using the Diagnostics feature in the kdb Insights Enterprise UI. View logs and events for specific databases and pipelines, as well as recent error messages that have appeared in the UI. Export diagnostics locally to easily share with others.
Accessing diagnostics
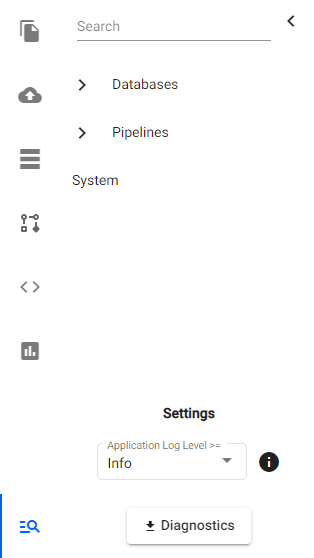
Click on the Diagnostics icon from the left-hand sidebar in the Insights UI to open a tree view containing a list of items to inspect.
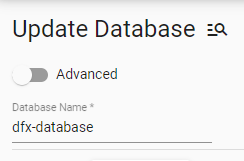
Access Diagnostics for a particular database by clicking the Diagnostics icon next to its name in the database editor:
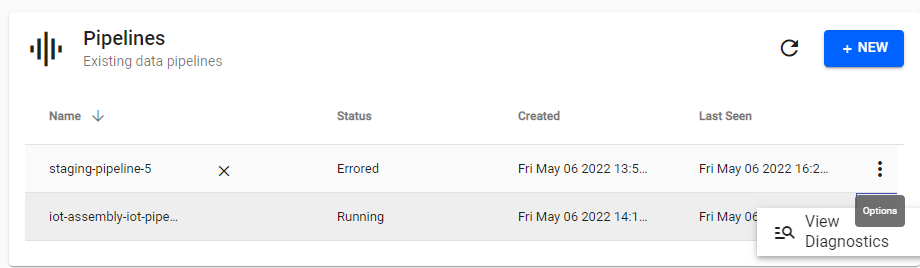
For a particular pipeline, access Diagnostics by clicking the three-dots button in the table of deployed pipelines on the Overview page.
Events and logs
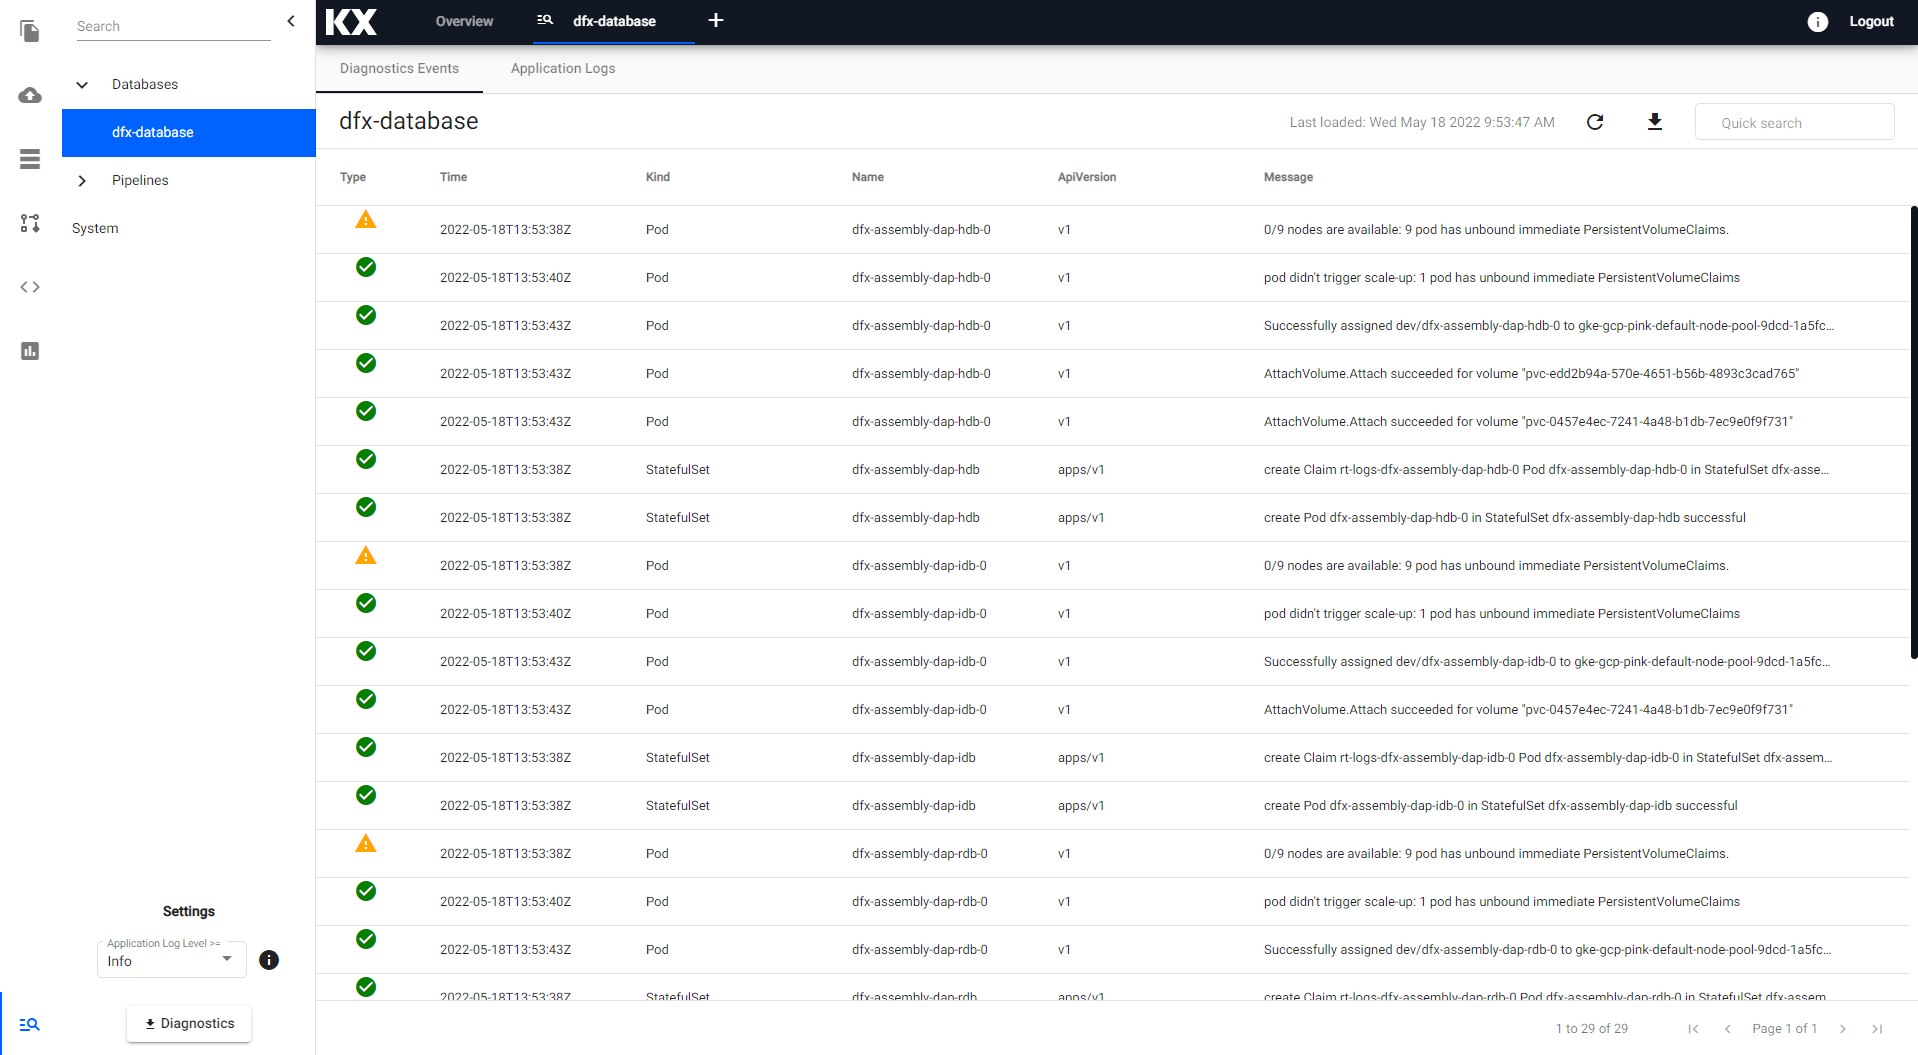
These are events that have occurred on the server infrastructure since the database or pipeline was deployed. Results are paged, and can be sorted or filtered.
Search for a particular phrase across all columns with the Quick search field, and export the results as a .json file.

Data in the table is cached on load, click the refresh icon to update the data. Alternatively, close and re-open the current tab from the Insights UI tab bar.
These are logs generated by the database or pipeline since it was deployed.
As with Diagnostics Events, results are paged, and can be exported, refreshed, searched, and sorted.
The current log level can be set from the dropdown menu, select from:
- trace (1, 2, 3, or 4)
- debug
- info (default)
- warn
- error
- fatal
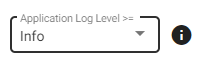
The log level is used to limit the types of logs queried by the server and is inclusive of every level below it. For example, setting the log level to info (the default value) ignores logs with a level higher than this (trace and debug), but includes every level below it (warn, error, fatal). Note, changing the log level does not restrict logs that have already been processed, but rather it only applies to future logs downloaded by the server.
System errors
Click on System from the Diagnostics sidebar to view a history of recent system error messages that have appeared in the current kdb Insights Enterprise UI session. Results aren't cached, but are instead loaded in real-time.
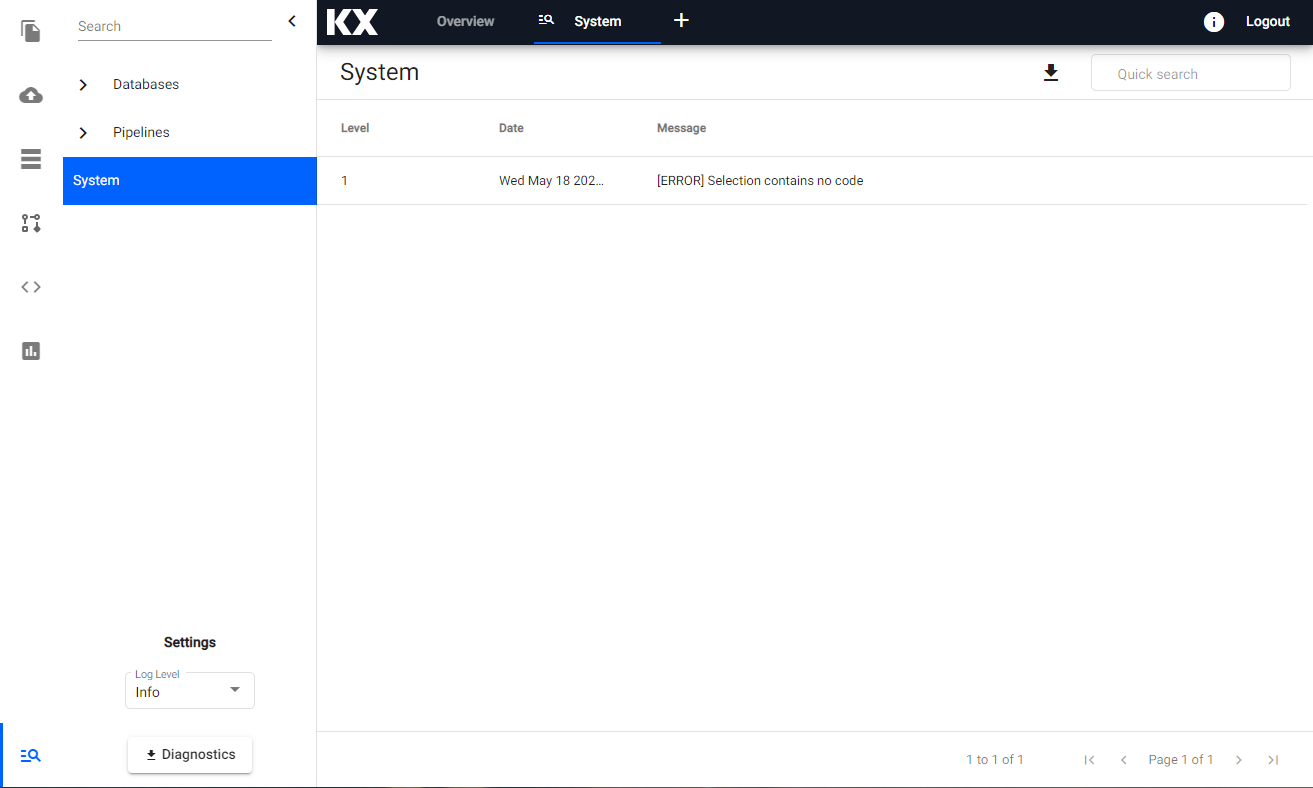
Export full system diagnostics

To download full system diagnostics across all databases and pipelines, click the "Diagnostics" button at the bottom of the sidebar. A prompt to confirm the processing of the data; data will be download as a .json file.