Query
Query pulls data into kdb Insights Enterprise using a simple table, kdb+/q or sql select. Query results are written to a variable as part of the "Get Data" process. Freeform queries in q/sql or python can be run against the named variable in a scratchpad, and the results read in a console, table or chart.
 The query view allows user interact with their data using kdb+/q and sql, with additional ad hoc investigations done in a scratchpad with q/sql or python.
The central divider is a drag bar which can be resized to better view the query or outputted results.
Set up
-
For a database to be queried, it must have an enabled query environment; this is a check control under Data Access in database settings (or should have at least 1 query environment in the new beta database user interface).
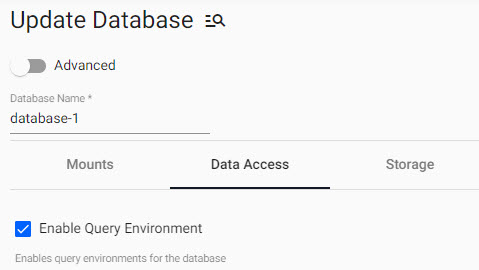
Ensure the database of an assembly has query environment enabled. -
An active assembly with data is required for investigations; a deployed assembly will have a green tick when active (viewable in the left-hand entity tree menu).
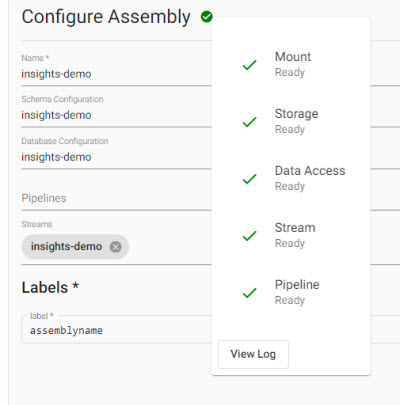
A rollover of an active assembly will show green ticks for each element in the assembly. -
Choose how to query the data.
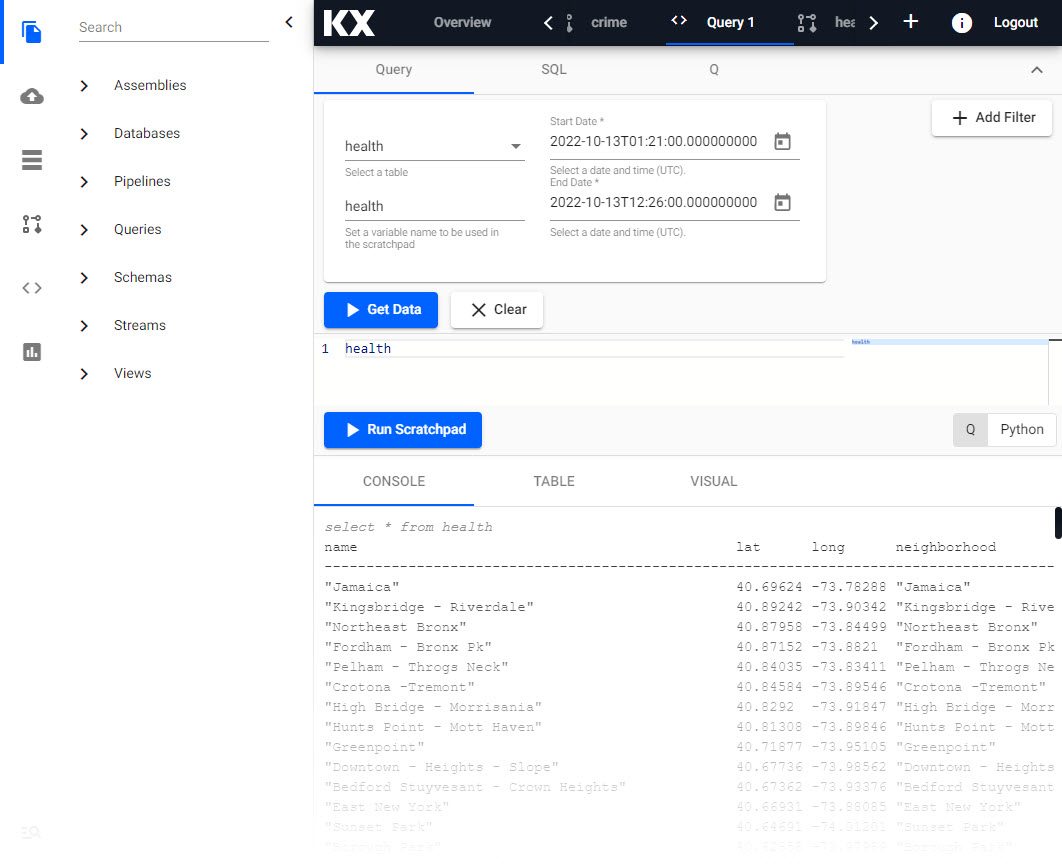
Query uses an input form to define the data to query. Select the dataset (database table name) from the assembly and assign it to a variable; this variable will be referenced in the Scratchpad editor. When exploring with a query, a timestamp date range must be defined. Additional filters are also available, referenced in the GetData API.
When querying with a table, it's necessary to reference the name of the table as used by the database, the output variable, and the start and end time; both of which must be timestamps.The data table can be referenced using
SQL, and assigned to a variable for use in the scratchpad.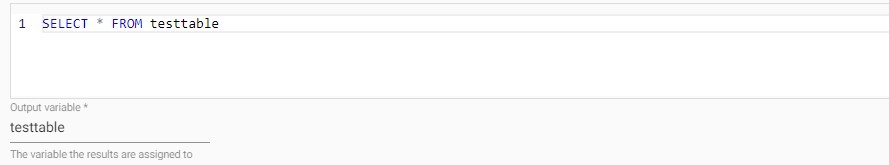
A simpleSQLquery can be used to return data, referencing the database table and writing the results to an output variable.The data table can be referenced using
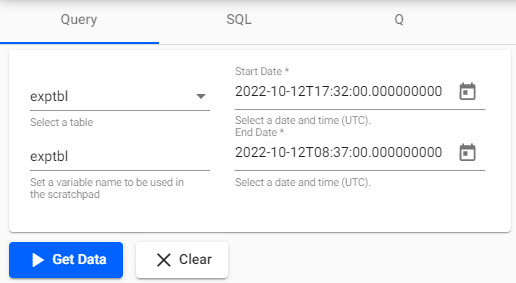
q, and assigned to a variable for use in the scratchpad. The assembly and instance (rdb, hdb or idb) must be selected prior to getting data.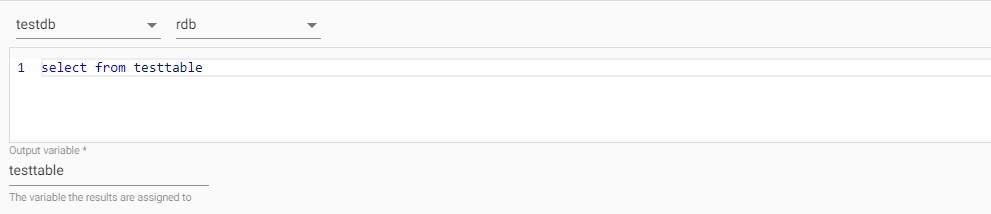
A simpleqquery can be used to return data, referencing the database table and writing the results to an output variable. -
Click
 to populate the initial query in the
 Console. -
In the Scratchpad editor, query the output variable with
kdb+/qorpython. If usingpython, only the first line of code is processed. -
The entire contents of the scratchpad can be evaluated with
 . The current line or selection can be run with the keyboard shortcut of CTRL + Enter, or ⌘Enter on Mac.
Scratchpad Limitations
There is a (combined user) memory limit of 500MB for scratchpad queries. When exceeded, the scratchpad process will shut down and restart. To optimize performance, limit the amount of data returned in your query; for example: select[10000] from myTable to return 10,000 rows of data.
After a scratchpad restart, earlier results are removed and are no longer available.
Filtering by Label
One of the available filters is a Filter by Label option. This will allow the option to query specific tables in each assembly. To do so, select the key value of the label that was assigned to the assembly. Then select the value(s) of the label(s) to query from the tables that correspond to the label.
If no label is selected then all corresponding tables will be queried.
Scratchpad
Scratchpad is where ad hoc data querying can be done against the Output Variable. Scratchpad queries can be done in q or python; although when using python, results are generated for the first line of python code only.
Firefox Users
If you are unable to scroll the Scratchpad while using Firefox, check to ensure scrollbars are always visible.
Run Scratchpad
Executes the query. Results will be outputted in the lower, Console, Table or Visual panel.
Running Queries
When a line or selection is run, the context will by set by any preceding lines similar to \d .myContext or system "d .myContext". If there are no such lines, the global context will be used. This can be run using the keyboard shortcut of CTRL + Enter, or ⌘Enter on Mac..
Code
An ad hoc query can be run inside scratchpad; for example, kdb+/q query:
n:20;
([] date:n?(reverse .z.d-1+til 10); instance:n?`inst1`inst2`inst3`inst4; sym:n?`USD`EUR`GBP`JPY; account:n?("aa";"bb";"cc";"dd"); cnt:n?10);
will return the following:
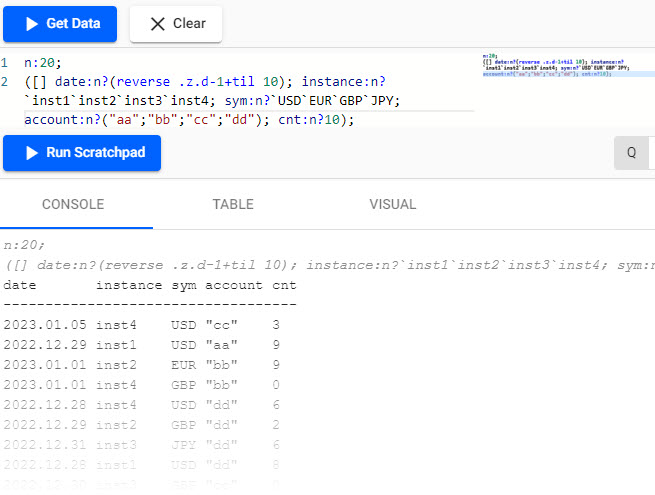
Console populated with data following an ad hoc scratchpad query.
Query
Data can also be queried against an output variable as returned by Get Data:
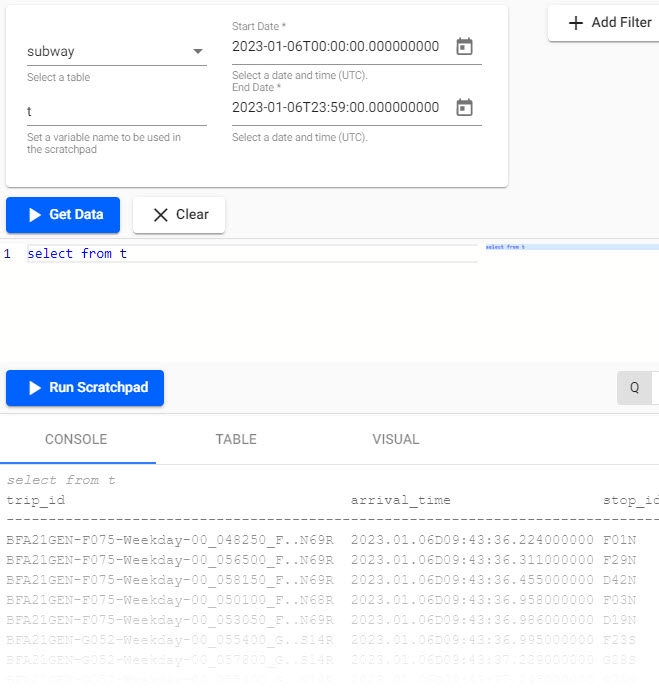
Console populated by a scratchpad query run against an output variable, 't', defined by Get Data.
Stream Processor
The Scratchpad can be used to instantly run pipelines using the Stream Processor. When a pipeline is iniatiated in the Scratchpad it does not have to be deployed as required by the pipeline builder. Users unfamiliar with kdb+/q should use the Pipeline UI or import process to create a pipeline.
An example of an expression pipeline as run by the stream processor in the scratchpad:
pipelineA: .qsp.read.fromExpr["til 10"] .qsp.write.toVariable[`outputA];
pipelineB: .qsp.read.fromExpr["`a`b`c"] .qsp.write.toVariable[`outputB];
.qsp.run (pipelineA; pipelineB)
Running pipeline(s) can be torn down with:
.qsp.teardown[]
Stream Processor pipelines
Pipeline(s) run in the Scratchpad will not be listed under Pipelines on the Overview page. Pipelines initiated in the Scratchpad, must be managed in the Scratchpad.
Starting a pipeline with Stream Processor
Console
A console that can display the results of kdb+/q or python code executed in the scratchpad.
The console contains a context menu that can be accessed by right clicking on the console area.
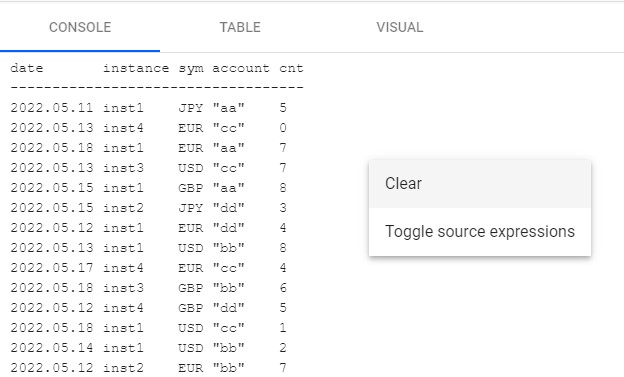
Console controls on right-click include clear and display code in console
| item | description |
|---|---|
| Clear | Clear the console |
| Toggle Source Expressions | Toggle whether the code expression generating the result will show in the console. |
Table
A more structured output can be created with a table generated from a Get Data or scratchpad query; results are paged.
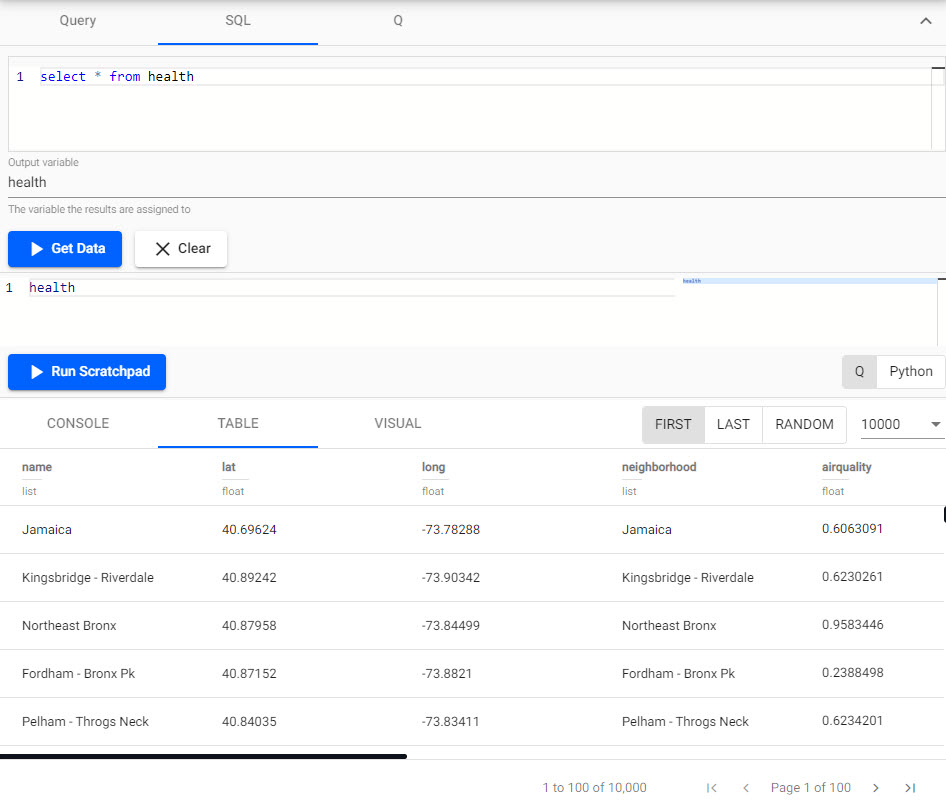
Tabulated output from a scratchpad query against output variable, health.
| item | description |
|---|---|
| First | Display results from the start of the data source (page 1). |
| Last | Display results from the end of the data source (last page). |
| Random | Select a random point in the data set to display results. |
| 10, 100, 1000, 10000 | Filter paged results by 10, 100, 1,000, or 10,000 results per page. |
Column Filter
Data columns can be sorted in ascending and descending order on a header click.
Support for data filtering with AND/OR statements available as a dropdown menu option in the header; select between contains, not contains, equals, not equal, starts with, or ends with.
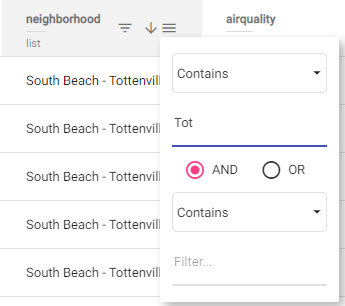
Column filter available on selection of "triple bar".
Visual
Results of a query can also be represented as a chart; click on a dropdown in the axis or header to change the values
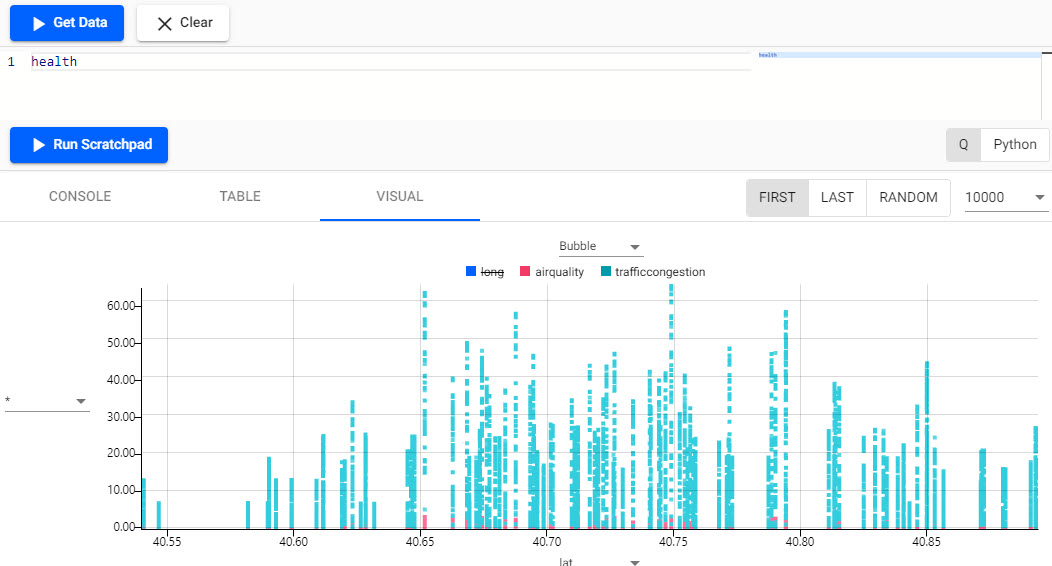
Bubble chart of health variables by latitude; airquality and traffic congestion.
| item | description |
|---|---|
| First | Display results from the start of the data source (page 1). |
| Last | Display results from the end of the data source (last page). |
| Random | Select a random point in the data set to display results. |
| 10, 100, 1000, 10000 | Filter paged results by 10, 100, 1,000, or 10,000 results per page. |
Set up
-
Select from
Bubble,LineorBarfrom the dropdown. -
Define the data source variables to chart from the x- and y-axis drop-downs. Defaults to wildcard,
*, for y-axis.
Chart Properties
Left-click anywhere in the chart header - except the dropdown menu - to enable the chart properties menu.
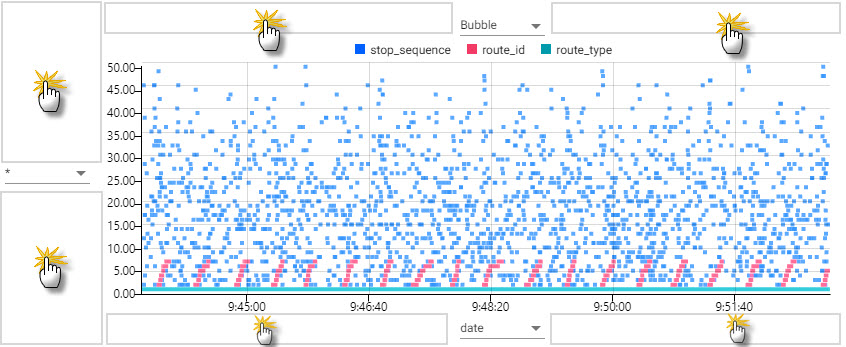
Clickable chart area to activate chart and axis properties; left-click to select.
Sidebar chart properties
It may be necessary to resize the chart view to ensure all chart properties are visible.
Set display properties of bar, lines or bubbles.
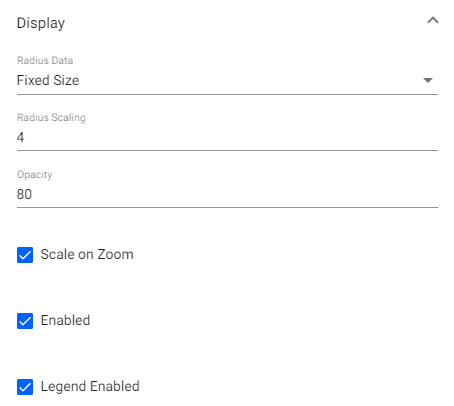
Display menu of custom properties.
| item | description |
|---|---|
| Radius Data_ (Bubble chart only) | Choose between a data source variable or fixed sized bubbles. |
| Radius Scaling_ (Bubble chart only) | Set the scaling of bubble size. |
| Color | Set the color of the bubble, bar or line. |
| Opacity | Define the opacity of the bubble, bar or line. Range 0 (transparent) to 100 (opaque). |
| Fill_ (Line chart only) | Enable to fill the area of the line to the x-axis. |
| Scale on Zoom_ (Bubble chart only) | When enabled, bubbles scale on zoom; increase in size on zoom in, decrease in size on zoom out. |
| Bar Percentage_ (Bar chart only) | Set auto-size percentage width of bars. |
| Bar Fixed Width_ (Bar chart only) | Set bar width in pixels. |
| Bar Width Type_ (Bar chart only) | Toggle between Percentage or Fixed Width for bar width. |
| Enabled | Plotted bubble data displays on chart when enabled. |
| Legend Enabled | Legend of plotted data appears above chart when enabled. |
Color Palette
Set color for layers when wild card is used; expand the dropdown for each data layer.
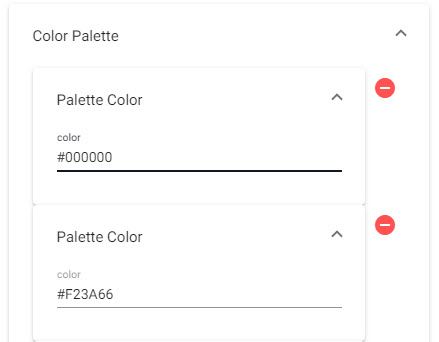
Color palette used for wildcard layers; defined using a Hex color.
Set animation for what happens when layers are changed.
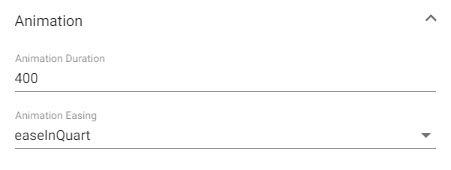
Custom animation for change of layers.
| item | description |
|---|---|
| Animation Duration | Defined in millseconds |
| Animation Easing | Animation event; select from swingFromTo, swingFrom, swingTo, easeFromTo, easeFrom, easeTo, easeInQuad, easeOutQuad, easeInOutQuad, easeInCubic, easeOutCubic, easeInOutCubic, easeInQuart, easeOutQuart, easeInOutQuart, easeInQuint, easeOutQuint, easeInSine, easeOutSine, easeInOutSine, easeInExpo, easeOutExpo, easeInOutExpo, easeInCirc, easeOutCirc, easeInOutCirc, easeOutBounce, easeInBack, easeOutBack, easeInOutBack, bounce, bouncePast, elastic. |
Set crosshair and overlay settings on chart
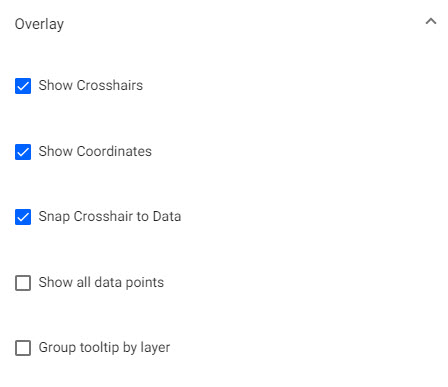
Display overlay menu properties.
| item | description |
|---|---|
| Show Crosshairs | Adds a crosshair to the chart. |
| Show Coordinates | Displays axis values for cursor position in chart. |
| Snap Crosshair to Data | Crosshair position locks to y-axis value relative to x-axis postion. |
| Show all data points | Crosshair displays all values in tooltip at x-axis position. |
| Group tooltip by layer | Group display of chart values in the tooltip by data layers. |
X- and Y-Axis
Define data source variables to chart from axis dropdowns. Click area above and below y-axis dropdown, or left and right of x-axis dropdown, to open axis properties menu.
| item | description |
|---|---|
| Number of Ticks | Define number of tick labels to display in the x- or y-axis. |
| item | description |
|---|---|
| Use min max | Check to enable min/max usage. |
| Min | Set minimum data range for axis. |
| Max | Set maximum data range for axis |
| item | description |
|---|---|
| Offset Gridlines | When enabled, sets gridlines between tick values. |
| Gridlines Color | Set the color of the gridlines used in the chart. |
| Gridlines Opacity | Defines the opacity of gridlines from 0 (transparent) to 100 (opaque). |
| item | description |
|---|---|
| Display | When enabled, displays tick values. |
| Begin at Zero | When enabled, plotted values will start at 0 for the y-axis. |
| Numeric Format | Select between Number, Smart Number and Formatted Number. |
| Decimal Places | Define precision of y-axis labels. |
| Font size | Define font-size of tick labels. |
| Prefix | Add a text component before axis tick label. |
| Suffix | Add a text component after axis tick label. |
| Hide Trailing Zeroes | When enabled, hides trailing zeroes from axis label. |