Range Slider
The Range Slider offers select filtering of sequential range data, e.g. time or date
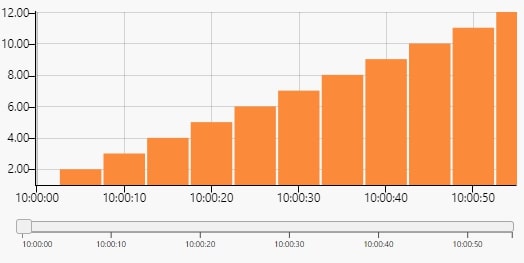
A chart with a range slider
Set up
-
Set data source to include the range period you wish to use
-
If using a single selector for the range slider then set a view state parameter to Selected Value. If using a min/max selector, then set view state parameters for each of Selected Min Value and Selected Max Value.
-
Use the Selected Min Value and Selected Max Value or Selected Value view state parameters in queries where you want the output filtered by the range slider.
Basics
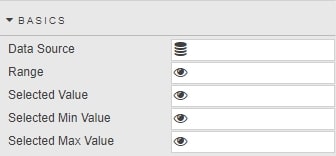
- Data Source
- A data source
- Range
- A View State Parameter: links the Range Slider to another component, which will have the same View State Parameter in its Range
- Selected Value
- A View State Parameter for the value selected
- Selected Min Value
- A View State Parameter for the minimum value of the selected range
- Selected Max Value
- A View State Parameter for the maximum value of the selected range
X axis
- Axis Value
- A Data Source column to be used as the X-axis label
- Axis Type
-
Data type for the Axis Value
Wrong X-axis labels?
If X-axis labels look incorrect, try selecting a different type
- Axis Format
- For when Axis Type is
Date - Axis Scale
- Define whether axis uses default ordering from the query ('none') or sequential (time, date etc) scaling
- Ticks
-
When Use Fixed Num of Ticks is checked, chart displays Num of Ticks ticks in the X axis.
When Show All Ticks is checked, every charted data point is shown in the X axis
- Rotation
- Rotation of X axis labels
Segments
Allows for custom look of range slider by percentage zones
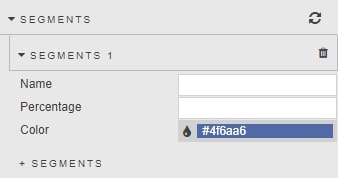
- Name
- Zone name
- Percentage
- Percentage area filled by segment zone
- Color
- Color shading of range slider for defined percentage area
Style, Margins and Format
Style for common settings