Analyst Visual
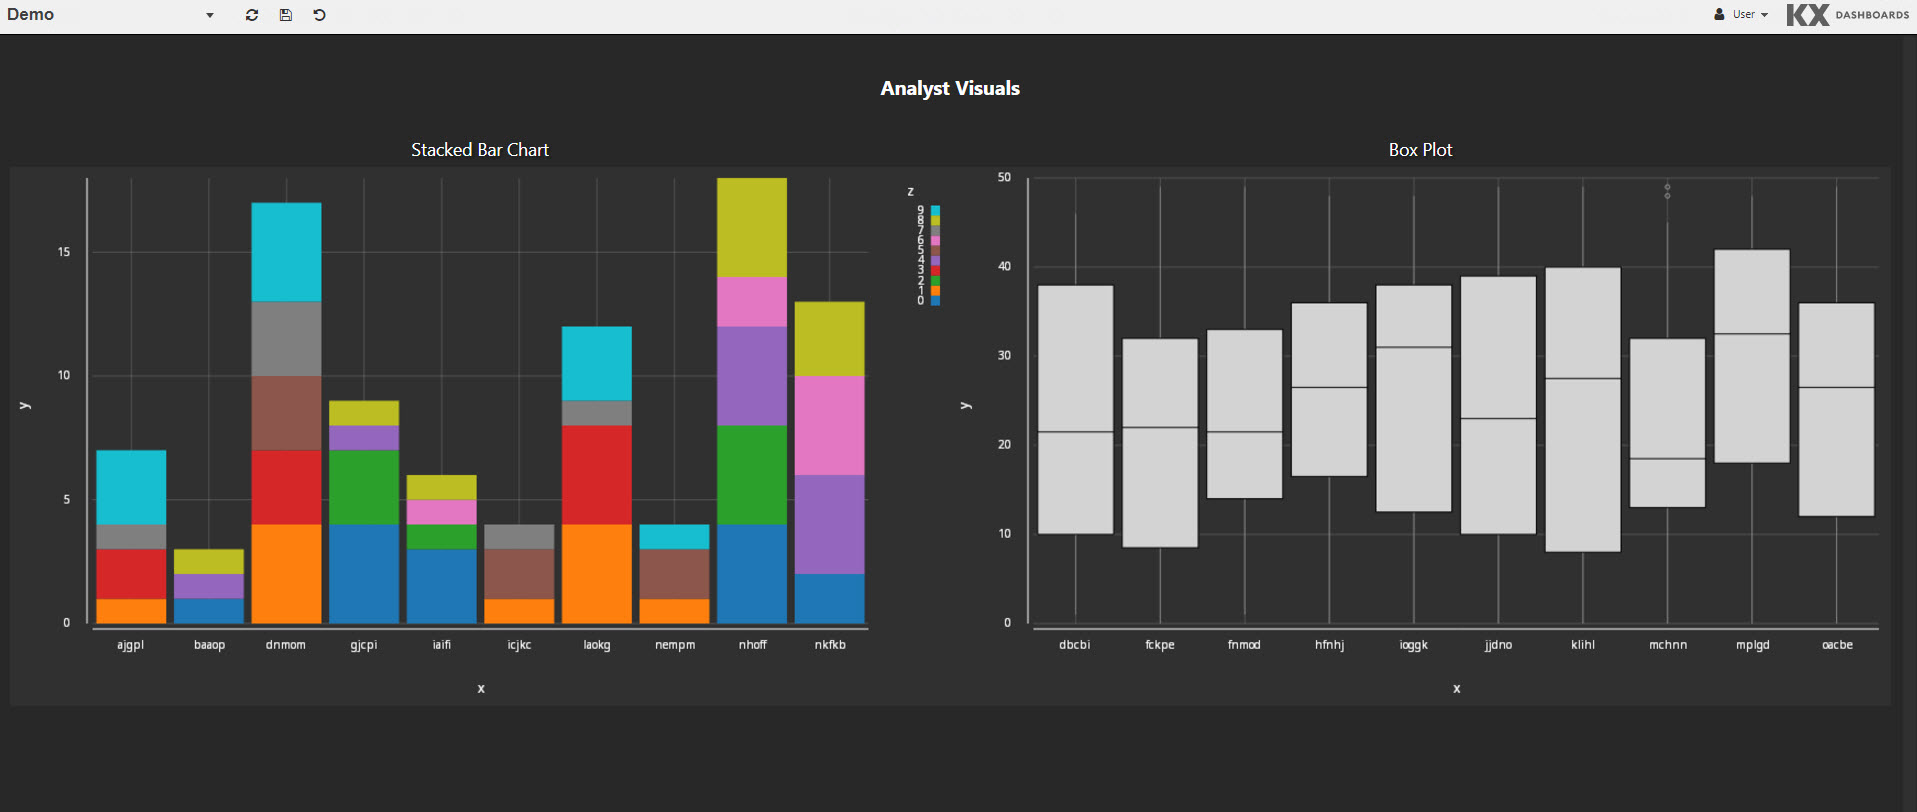
This page shows you how to set up and customize the Analyst Visual component in KX Dashboards to embed Grammar-of-Graphics visualizations from KX Analyst into your dashboards.
Set Up Analyst Visual
To set up an Analyst Visual, click-and-drag the component into the workspace and configure the Analyst Visual properties described in the next section.
-
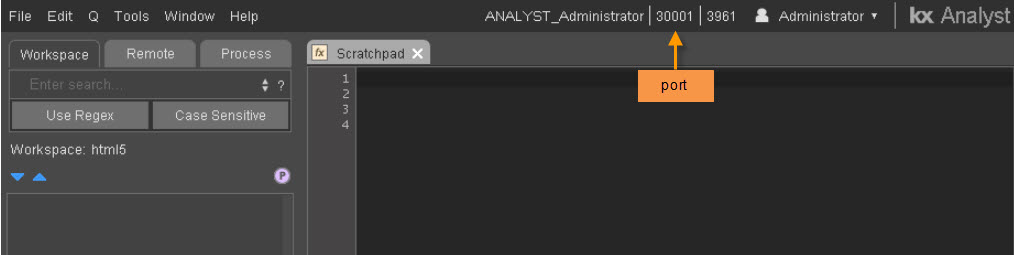
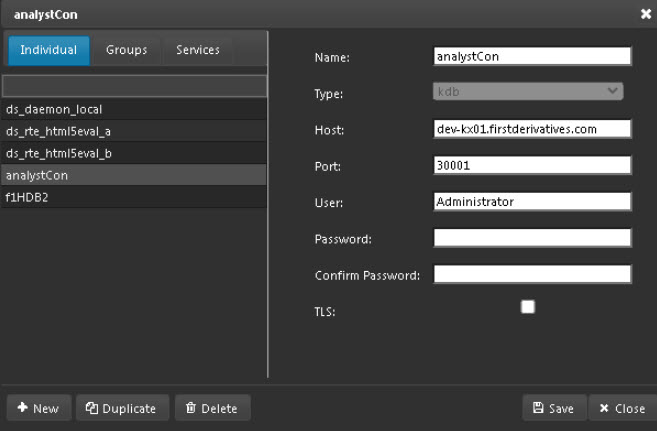
Create a connection to Analyst in KX Dashboards.
-
Create a new data source in KX Dashboards using the Analyst connection. The following screenshot shows a simple Grammar of Graphics example.
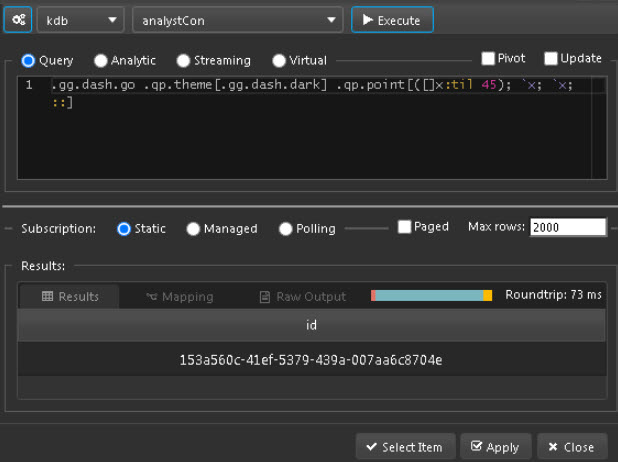
    .gg.dash.go
    .qp.theme[.gg.dash.dark]
    .qp.point[([]x:til 45); `x; `x; ::]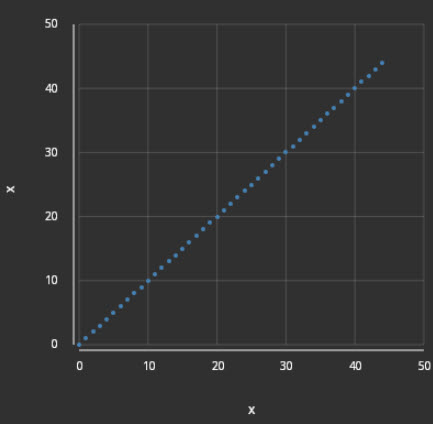
-
Configure additional properties described in the following section.
Analyst Visual Properties
The following sections provides details on how to configure the properties of the Analyst Visual component.
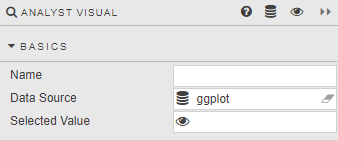
Basics
Open the Basics properties on the right and configure the properties described in the following table.
| Field | Description |
|---|---|
| Name | Enter a name for the component. |
| Data Source | Grammar-of-Graphics written in the editor connecting to KX Analyst. See setup for an example. |
| Selected Value | Refer to View State Parameters for details. |
Style, Format, Margins
Refer to Style for common style settings.