Map (External APIs)
This page describes how to set up and configure the Map (External APIs) component to display geographical data. Unlike other components, different data sources can be assigned and overlaid by map type.
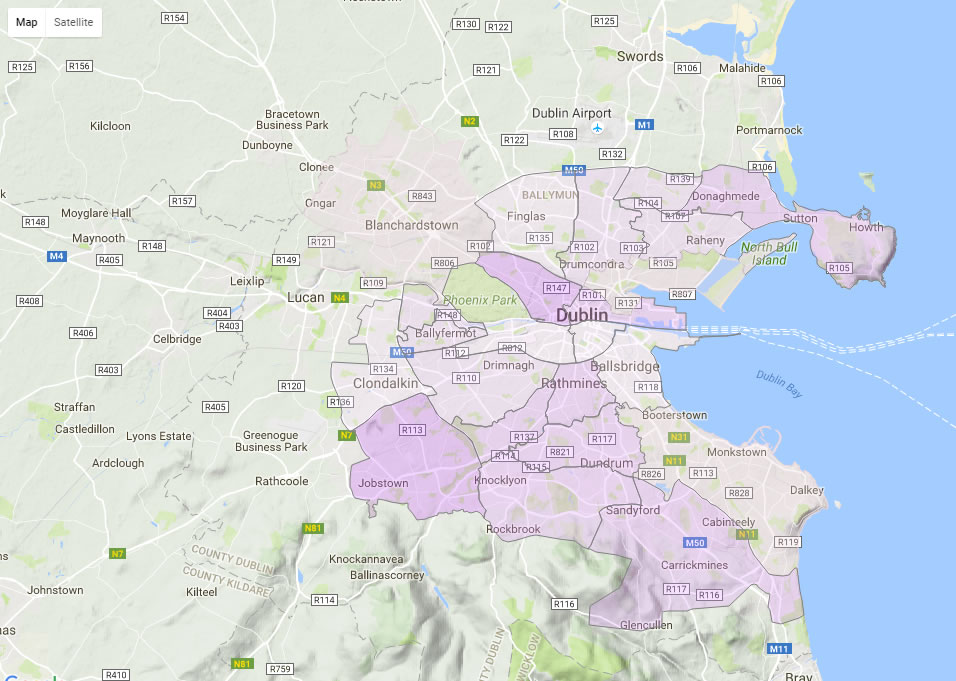
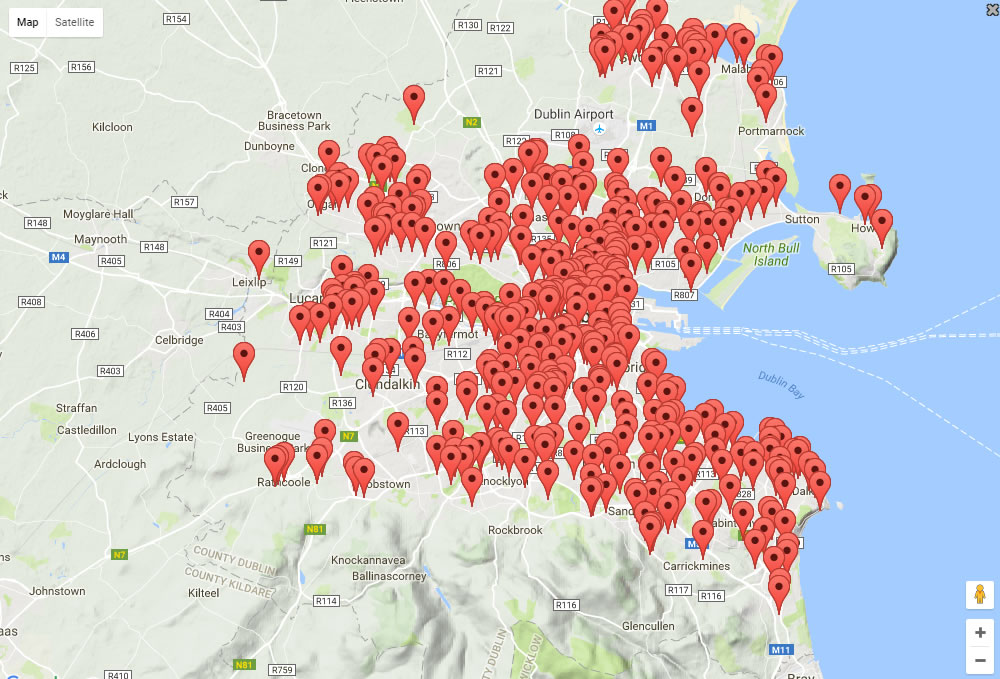
The following example shows a map with a statistical overlay.
Online and offline Maps
KX Dashboards includes two different Map components, both displaying geographical data, but used for different purposes.
- Use an offline map by selecting the Map component, which doesn't require an internet connection.
- Alternatively, use the Map (External API) component described on this page, which requires a stable internet connection and access to external APIs.
The properties you can set for the two maps are different so it's recommended you choose the component to use based on your needs.
Set Up a Map
To set up a Map component, click-and-drag the component into the workspace and configure the following:
- Select the map type to use.
- Define the bounds for the viewable area of the map using a view state parameter; centered by
CenterXandCenterY, at a defined zoomScaleon load. - Select between points, circles, lines, heatmap, or overlay.
- Irrespective of the map selection, ensure the data source has a longitude and latitude reference for mapped elements.
Refer to Map properties described in the next section for details on additional properties.
Map Properties
The following sections provides details on how to configure the properties of the Map component.
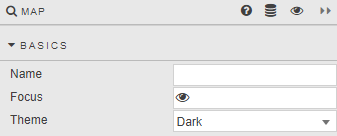
Basics
Open the Basics properties on the right and configure the properties described in the following table.
| Field | Description |
|---|---|
| Name | A name for the component provided by the user. |
| Focus | A View State Parameter used for linking components. |
| Theme | Light or Dark. |
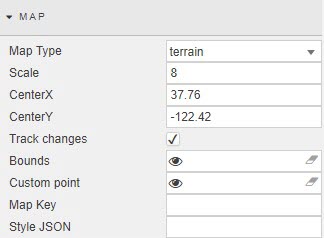
Map
Configure the properties described in the following table.
| Field | Description |
|---|---|
| Map Type | Select from terrain, satellite, roadmap or hybrid.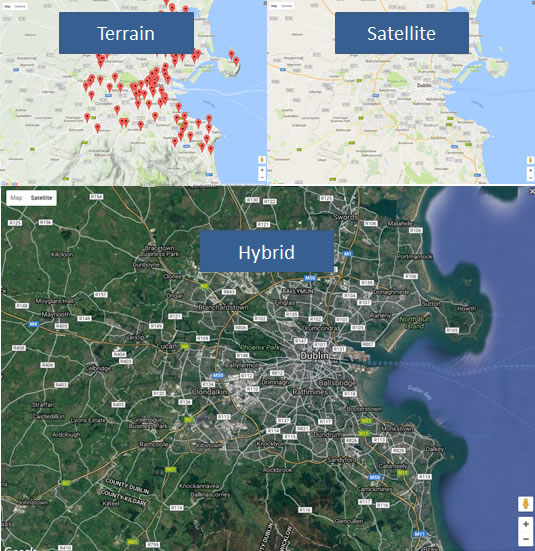 |
| Scale | Define the zoom level.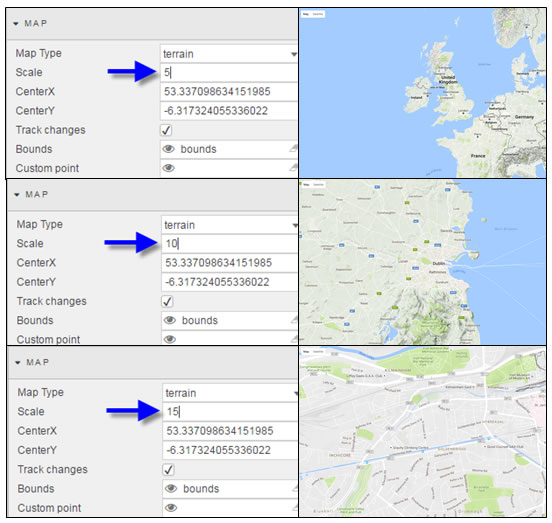 |
| Center X/Y | Set the map center on dashboard load; define longitude and latitude values. |
| Track Changes | When checked, this updates co-ordinates after user interaction. Note: The Map opens on the updated Center X/Y co-ordinates on the next dashboard load. |
| Bounds | A View State Parameter which stores the co-ordinates for the viewable area of the map.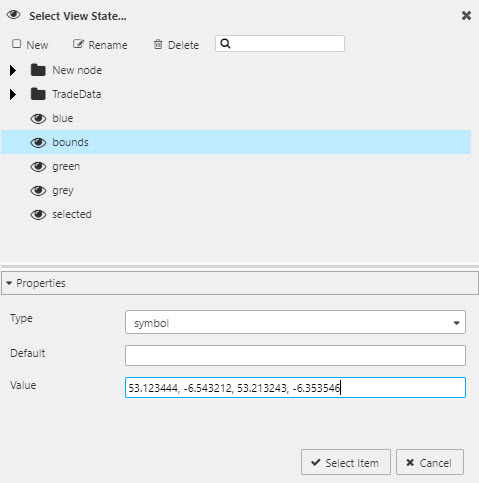 |
| Custom point | When a View State Parameter is set, right-clicking on the map allows the user to create a custom point; its co-ordinates are held in the View State Parameter. Warning! Without a View State Parameter set, right-clicking on the map will not add a custom point. 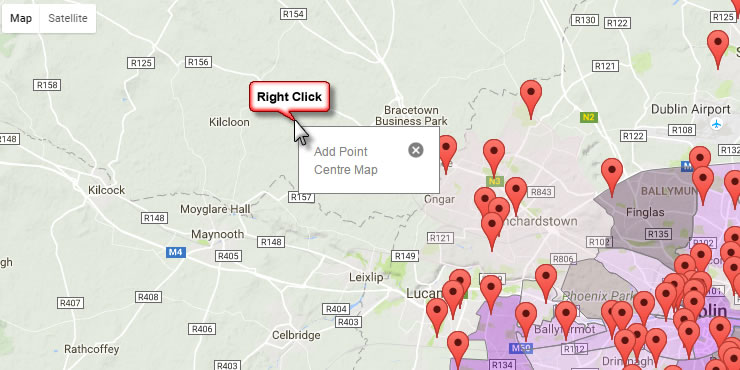 |
| Map Key | Allows the user to load the map with their Google map ID. |
| Style JSON | Apply JSON style from Mapstyle.withgoogle.com. Cut-and-paste the JSON into the Style property. A view state parameter of type String can also be used to store the JSON.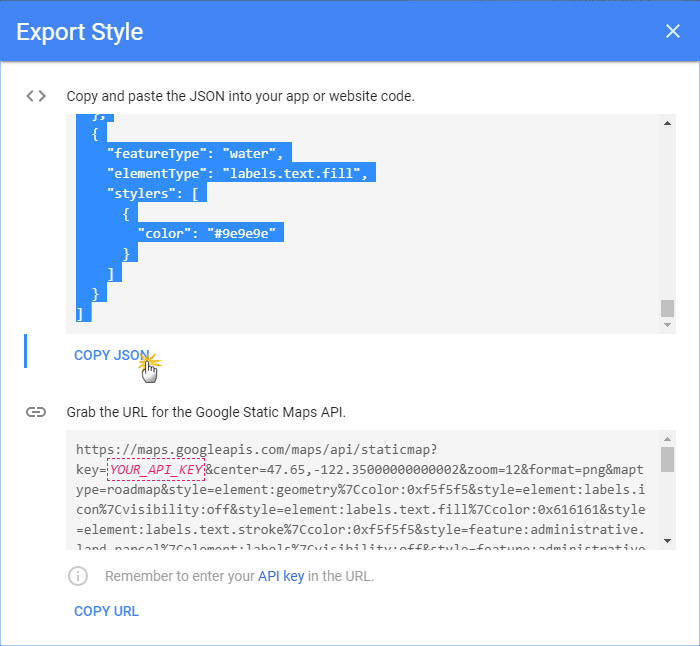 |
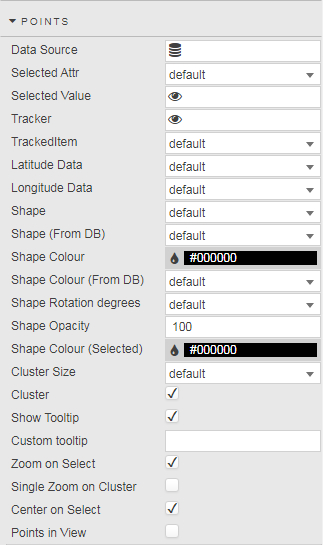
Points
These properties allow you to add data points to the Map.
| Field | Description |
|---|---|
| Data Source | A data source that includes geographic coordinates. |
| Selected Attribute / Selected Value | Defined from data source. Refer to Selected values for further details. |
| Tracker | A View State Parameter for TrackedItem. |
| TrackedItem | A Data Source column for the Tracker View State Parameter, set when the user selects a point on the map. Tip: Additional mapped items can be tracked using Selected Point Viewstate Routing. Refer to Selected values for details. |
| Latitude / Longitude Data | Data Source columns for latitude and longitude.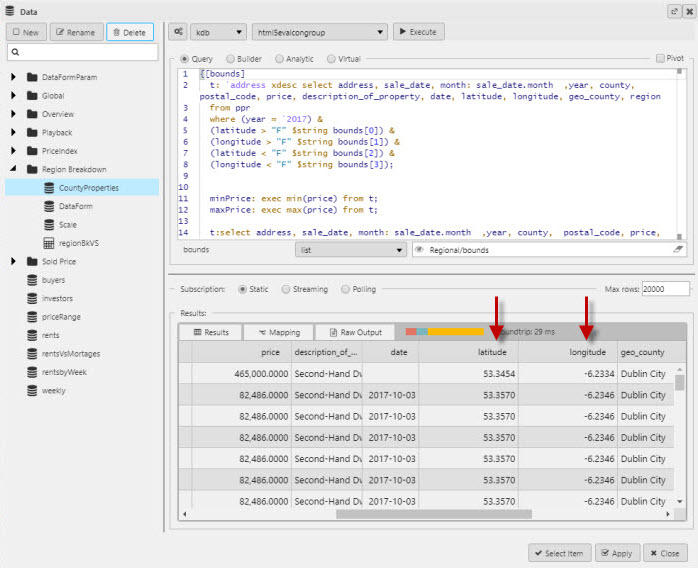 |
| Shape / Rotate Shape / Shape Rotation Degrees | The shape of the map point graphic: dot, pointer, etc. directional uses pointer icons, the direction of the point is determined by Shape Rotation Degrees (a Data Source column) when enabled by Rotate Shape.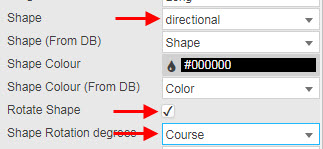 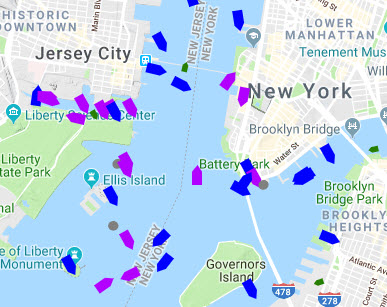 |
| Shape (From DB) | A Data Source column: the shape of the map point graphic (alternative to Shape). |
| Shape color | Color of the map point graphic. |
| Shape color (From DB) | A Data Source column: color of the map point graphic (alternative to Shape Color). |
| Shape Opacity | Opacity of the map point graphic. |
| Cluster Size | Size of clusters into which points are aggregated; select from values in increments of ten to 70.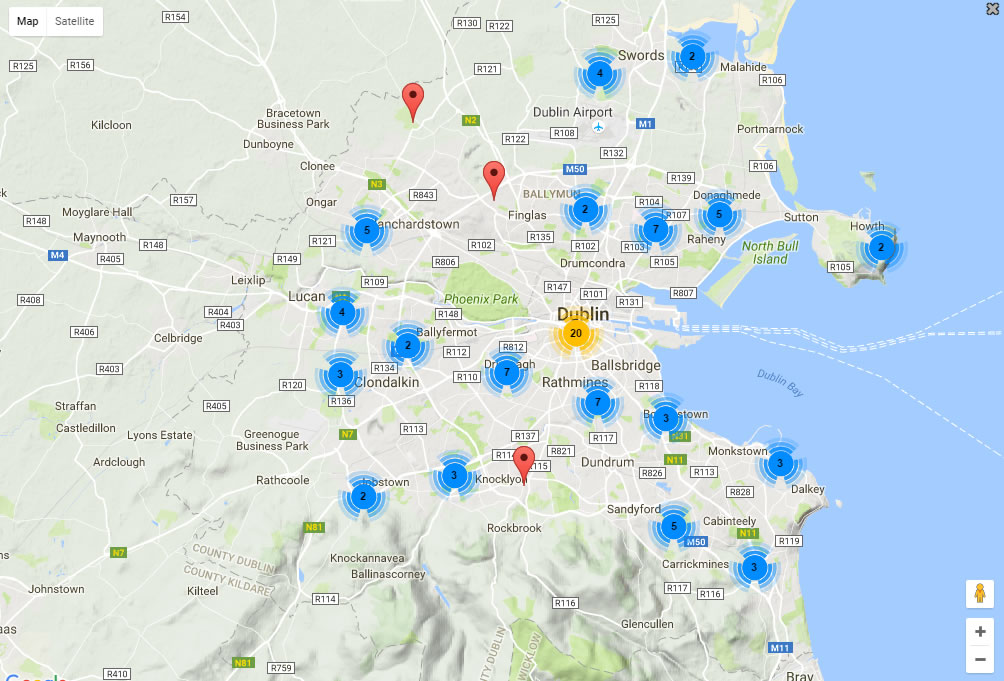 |
| Cluster | When checked, grouped individual points are replaced with a numeric cluster icon. Points outside clusters remain displayed as individual points. |
| Show Tooltip | When checked, displays a tooltip on Point rollover. |
| Custom Tooltip | Enter a tooltip to be displayed on the Map. Refer to Custom tooltips for further details.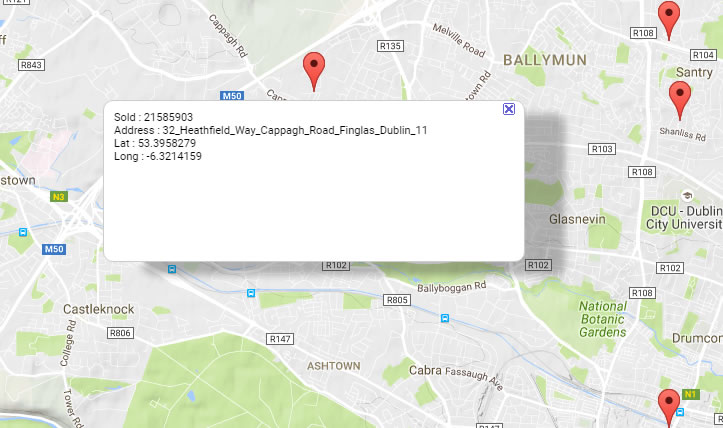 |
| Zoom on Select | When checked, the map zooms when the user selects a point. |
| Single Zoom on Cluster | When checked, the map zooms when the user clicks on a cluster.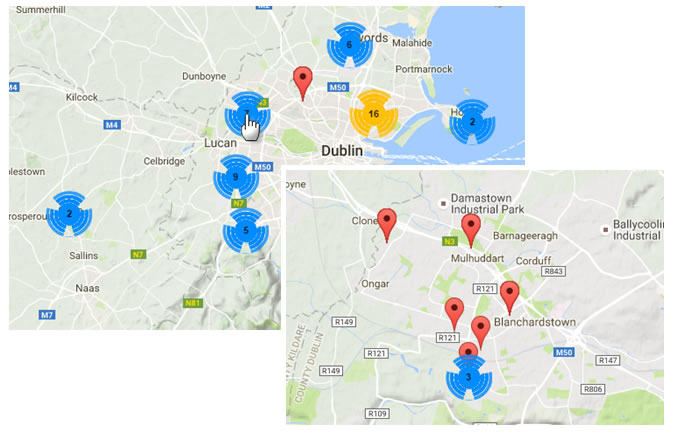 |
| Open Dashboard on Select | A dashboard: when user selects a map point, the dashboard loads. |
| Points in View | When checked, the map auto-zooms to show all available data points.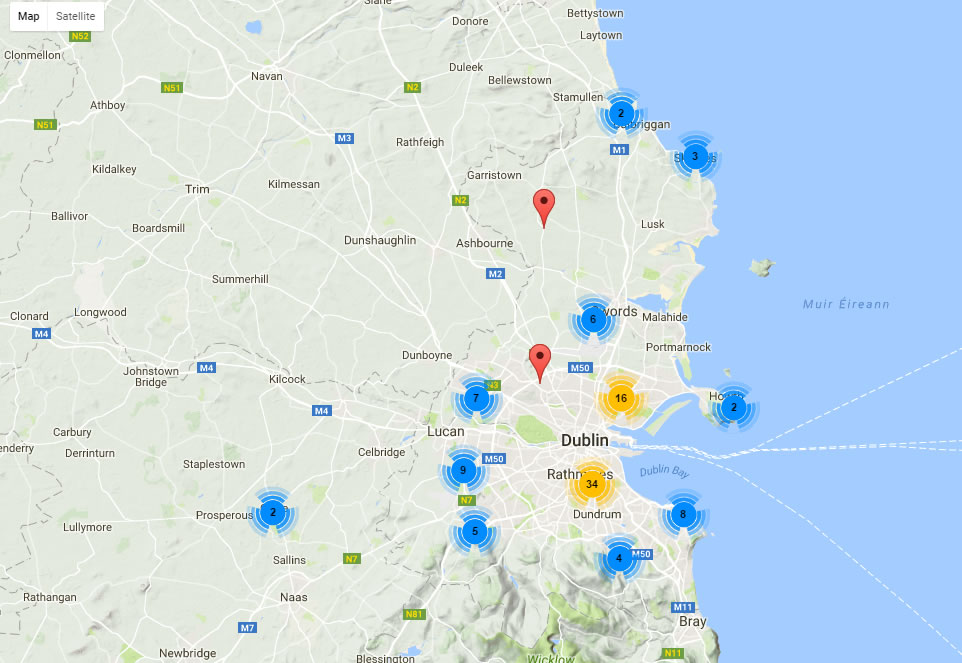 |
| Label | Allows the user to add a label to a Point.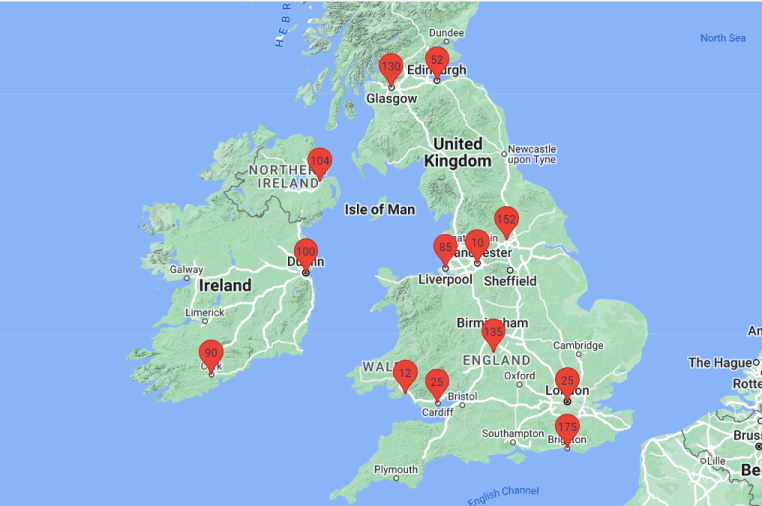 |
| Label Color | Allows the user to set the Point label color if label is defined. |
| Label Size | Allows the user to set the Point label size if label is defined. |
Action
See Actions for details.
Circles
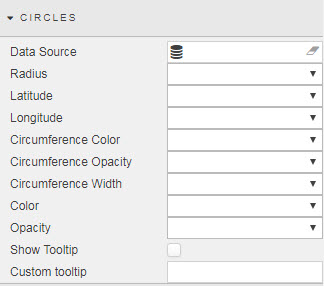
| Field | Description |
|---|---|
| Data Source | A data source that includes geographic coordinates. |
| Radius | Select the data source column with radius of circle. |
| Latitude / Longitude | Select the data source columns with geographic co-ordinates. |
| Circumference Color, Opacity and Width | Select the data source columns with details on color (hex reference), opacity and width (pixels). |
| Color | Circle color. |
| Opacity | Opacity of circle. |
| Show Tooltip | Enable Tooltip. |
| Custom Tooltip | Create a custom tooltip template. Refer to Custom Tooltip for details. |
Lines
You can configure properties for adding lines to maps.
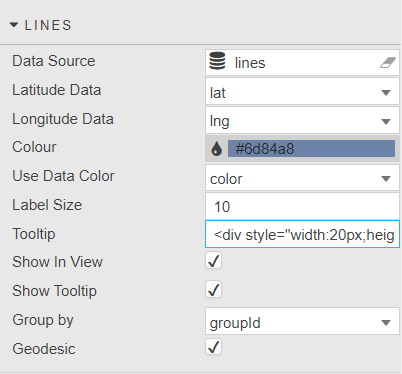
| Field | Description |
|---|---|
| Data Source | A data source that includes geographic coordinates. |
| Latitude / Longitude Data | Select the data source columns with geographic co-ordinates. |
| Color | Color of the line. |
| Use Data Color | A Data Source column: color of the map line (alternative to Color). |
| Label Size | Size of the label. |
| Show In View | When checked, map auto-zooms to show all available line points. |
| Group by | Groups line data by a specific data source column and draws a separate line for each group. |
| Show Tooltip | When checked, displays the tooltip. |
| Geodesic | When enabled, draws a curved line connecting the shortest possible distance between two points on a sphere. |
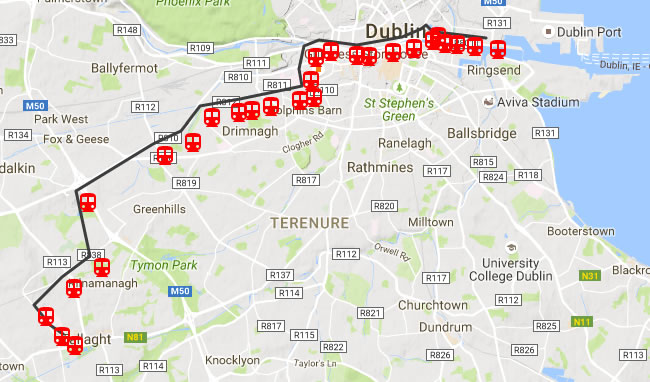
Lines Query Example
The following shows an example data table.
Stop         long      lat      Line
------------------------------------
Tallaght     -6.374589 53.28749 Red
Hospital     -6.37885  53.28937 Red
Cookstown    -6.384397 53.29351 Red
Belgard      -6.374886 53.29929 Red
Kingswood    -6.36525  53.30369 Red
Red_Cow      -6.369872 53.31683 Red
Kylemore     -6.343444 53.32666 Red
Bluebell     -6.333792 53.3293  Red
Blackhorse   -6.327394 53.33426 Red
Drimnagh     -6.318161 53.33536 Red
Goldenbridge -6.313569 53.33589 Red
Suir_Road    -6.307211 53.33662 Red
Rialto       -6.297242 53.33791 Red
Fatima       -6.292547 53.33844 Red
Jamess       -6.293361 53.34194 Red
Heuston      -6.291808 53.34665 Red
Museum       -6.286714 53.34787 Red
Smithfield   -6.277728 53.34713 Red
Four_Courts  -6.273436 53.34686 Red
Jervis       -6.265333 53.34769 Red
..
Download the above table as a CSV file or as a datasource query.
Heat Map
The following example shows a traffic heat map.
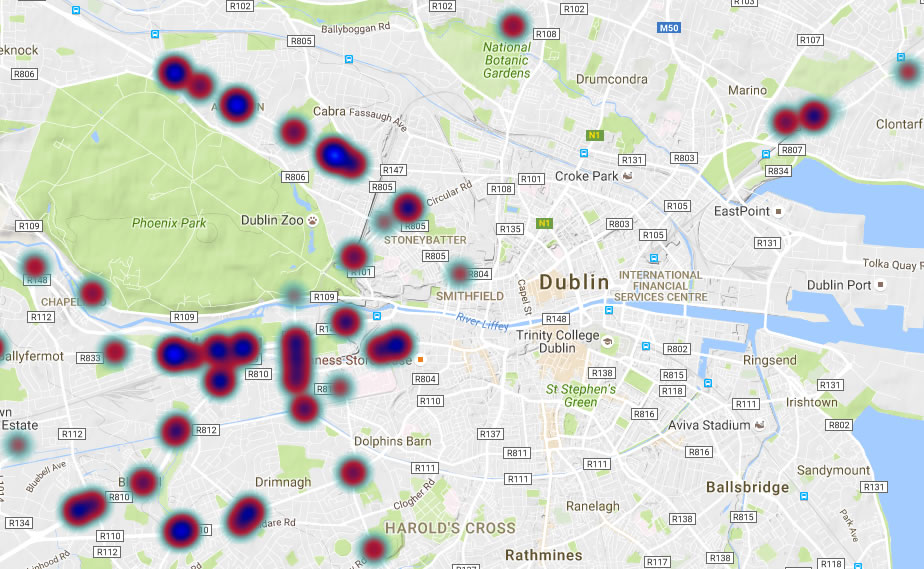
Dynamic overlays
Can be used for dynamic overlays. For example when linked with a Playback component.
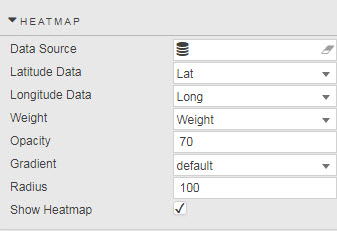
| Field | Description |
|---|---|
| Data Source | A data source that includes geographic coordinates. |
| Latitude / Longitude Data | The data source columns with geographic co-ordinates. |
| Weight | A data source column with the heat-map weights. |
| Opacity | The opacity of the overlay.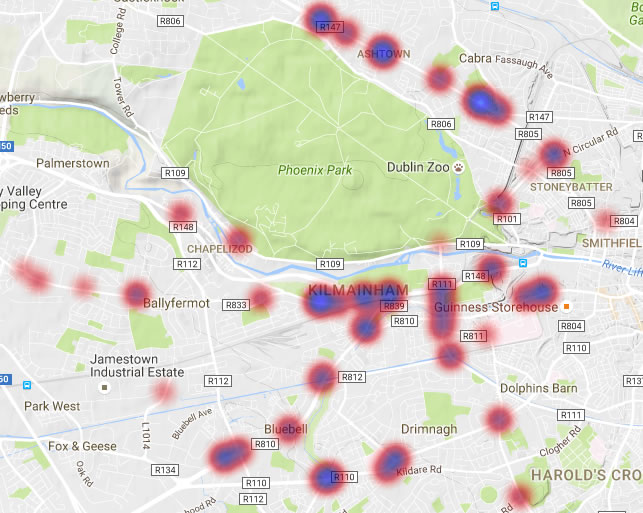 |
| Gradient | The color gradient: red-blue, blue-red and so on. |
| Radius | The radius for heat-map spread. |
| Show Heatmap | When checked, the overlay is visible. |
KML Layers
KML Layers specify a set of features (such as place marks, images, polygons, 3D models, textual descriptions, etc.)
| Field | Description |
|---|---|
| URL | Enter the URL of the KML or KMZ file. |
| Enabled | When checked, the layer is visible. |
Overlay
Overlays allow you to add additional layers of information over a base map.
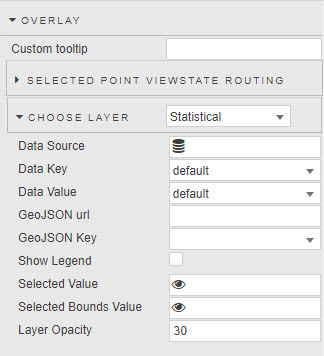
| Field | Description |
|---|---|
| Custom Tooltip | Refer to Custom tooltips for details. |
| Selected Point Viewstate Routing | Refer to Selected values for details. |
| Choose Layer | Select from dropdown; single option Statistical. |
| Data Source | A data source that includes geographic coordinates and a column containing the color reference for overlay shading. |
| Data Key | Column containing an index reference for the overlay data. |
| Data Value | Overlay data mapped to Data Key. |
| GeoJSON | Custom GeoJSON URL overlay and GeoJSON Key reference key. |
| Show Legend | Display color code legend of overlay. |
| Selected Value | Map selected overlay key to a View State Parameter. |
| Selected Bounds Value | Map selected bounds coordinates of the overlay to a View State Parameter. |
| Layer Opacity | Select overlay transparency; 0 for fully transparent, 100 for opaque. |
Rectangle Bounds
A user-defined zone (defined within bounds) by longitude and latitude co-ordinates. More than one user-set boundary can be set.
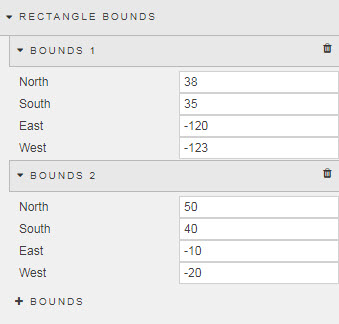
| Field | Description |
|---|---|
| North / South / East / West | These properties set the longitudinal and latitudinal co-ordinates for user-defined boundary. |
Style, Margins, Format
Refer to Style for common style settings.