Vega Chart
This page describes how to set up and configure the Vega Chart component.
This component renders a chart using the Vega Chart library. Demonstrations of the library's capabilities can be found in the Vega Example Gallery.
Set Up a Vega Chart
To set up a Vega Chart component, click-and-drag the component into the workspace and configure the following:
- Set the data source.
- Specify the JSON for the Vega Config.
Refer to Vega Chart properties described in the next section for details on additional properties.
Vega Chart Properties
The following sections provides details on how to configure the properties of the Vega Chart component.
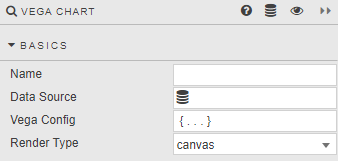
Basics
Open the Basics properties on the right and configure the properties described in the following table.
| Field | Description |
|---|---|
| Name | Enter a name for the component. |
| Data Source | A query or analytic. When set, values of the first data item in Vega Config are overwritten. |
| Vega Config | Specification in JSON format covering data handling and transformations, visual representation, and behavior.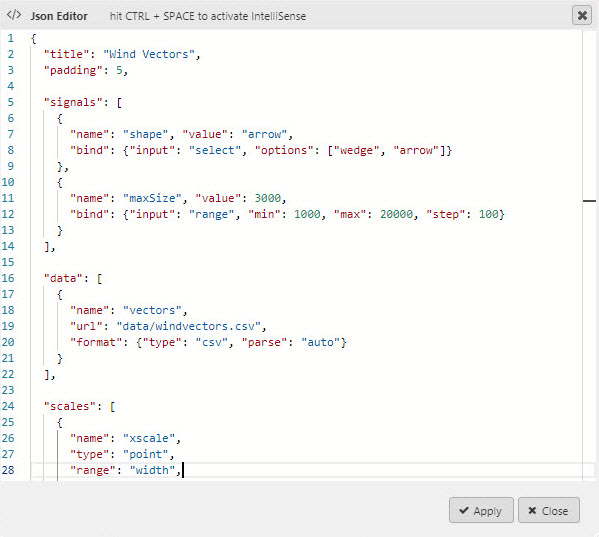 Documentation about available options can be found on the Vega Website. !!! tip The chart automatically fits available space if neither width nor height is specified.Data Source override An external resource in the Vega configuration can be referenced as shown below: json<br>{<br> "data": [{<br> "name": "vectors",<br> "url": "data/windvectors.csv",<br> "format": {"type": "csv", "parse": "auto"}<br> }],<br> ..<br>Setting Data Source modifies the configuration above with actual values, replacing url and format with values:json<br>{<br> "data": [{<br> "name": "vectors",<br> "values": [<br> {<br> longitude:7.5,<br> latitude:4.3,<br> ..<br> speed:3.12<br> },<br> ..<br> ]<br> }],<br> ..<br> |
| Render Type | Controls whether the chart is rendered as <canvas> (faster) or <svg>. |
Style, Format, Margins
Refer to Style for common settings.