Visual Query Builder
This page describes how to set up and configure the Visual Query Builder, a graphical tool enabling users to quickly build and visualize database queries without requiring knowledge of kdb or q.
Visual Query Builder is best used in conjunction with another component, such as Data Grid. To see this in action, check out the Demo Data dashboard and switch to the Visual Query Builder tab.
Set Up a Visual Query Builder
To set up a Visual Query Builder component, click-and-drag the component into the workspace and configure the following:
- Define the Connection which will populate the list of available data sources to build the query.
- Define the Data Source which is the output for the query, and used in other components.
Refer to Visual Query Builder properties described in the next section for details on additional properties.
Visual Query Builder Properties
The following sections provides details on how to configure the properties of the Visual Query Builder component.
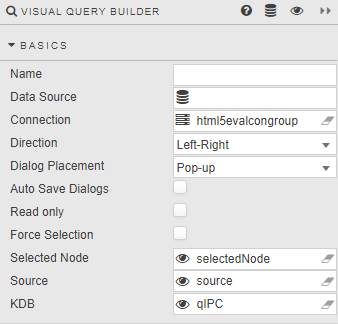
Basics
Open the Basics properties on the right and configure the properties described in the following table.
| Field | Description |
|---|---|
| Name | Enter a name for the component. |
| Data Source | This must match the data source used as the output (where Selected Node and KDB are assigned view state parameters). Any errors returned by the data source are highlighted in the query builder on the node where the error occurs. Refer to Data sources for further details. |
| Connection | Select a kdb database. Refer to Connections for further details. |
| Direction | Define order flow of visual query: left-to-right, right-to-left, top-to-bottom, bottom-to-top. |
| Dialog Placement | Configuration dialogs can appear to the left or right of the query builder interface, or as a popup. |
| Auto Save Dialogs | Automatically saves value changes made in left or right dialog menus, but not for popup dialogs. |
| Read only | Disables dialogs, preventing changes from being made to the query. |
| Force Selection | Prevents Visual Query Builder from a no-node-selection state. Selecting a node runs the query to that point, ignoring nodes beyond it. When enabled, a single node must always be selected — defaulting to the last node if no other node is selected. |
| Selected Node | A view state parameter assigned to the selected node within the visual query. |
| Source | A view state parameter storing the complete structure of the query as JSON. Best used in conjunction with the Editable List component to toggle between several different queries. See the Demo Data dashboard for an example.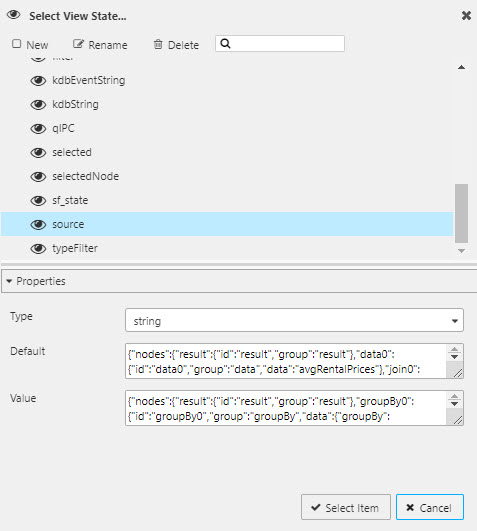 |
| KDB | A view state parameter storing the output kdb string. Used in the output data source, generally rendered inside a data grid.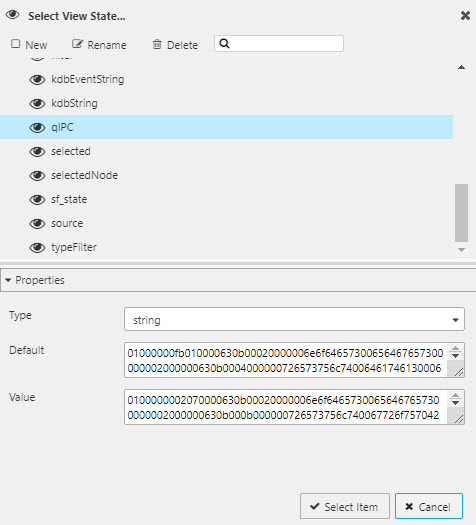 Note: The output query requires both the KDB and Selected Node view state parameters. 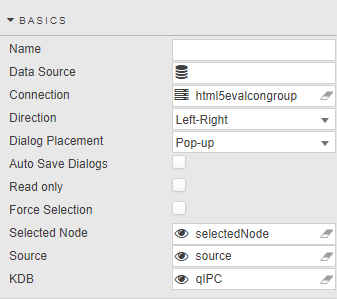 |
Bindings
Allows node functions to be assigned to view state parameters.
| Field | Description |
|---|---|
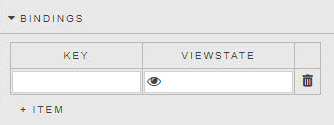
| Key | The name of the assigned binding. This appears in the function dropdown. |
| Viewstate | The view state to link to the function. Note: The view state type must match the type of the parameter you plan to assign it to, or it won't be available in the function parameter dropdown. 1. Create the binding. 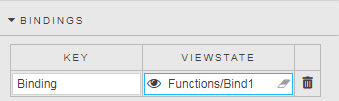 2. Set the view state. 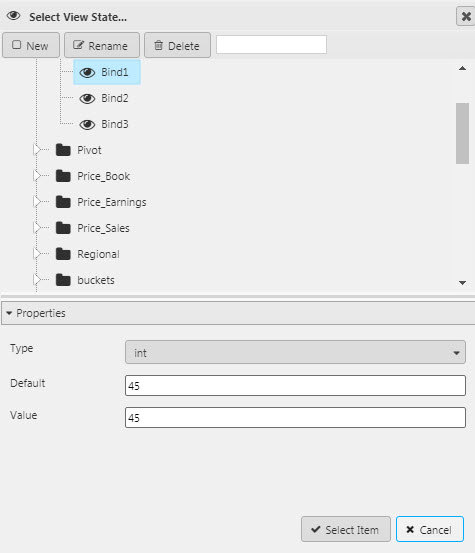 3. Edit the function. 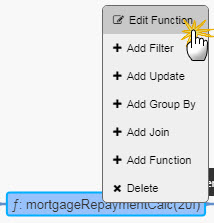 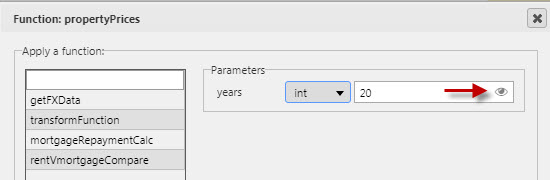 4. Bind the parameter to the created view state. 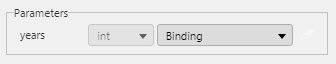 |
Style, Format, Margins
Refer to Style for common style settings.
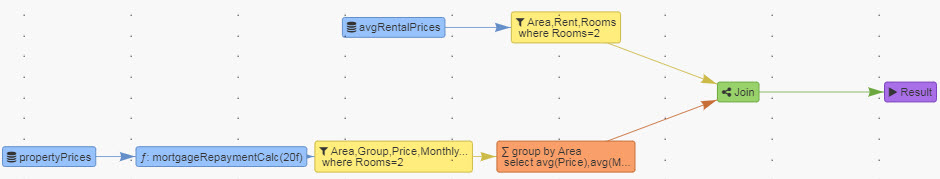
Build a Query
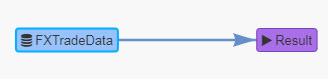
Users start by adding a data source to query. Right-click on the empty Data node to open the menu of options and click Edit Data.
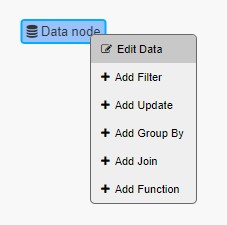
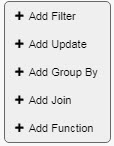
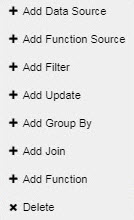
Once a data source is assigned, right-clicking inside the query builder offers additional options: Add Filter, Add Update, Add Group By, Add Join, Add Function.
If KX Dashboards Direct
Support for streaming queries is available with Builder of the data editor.
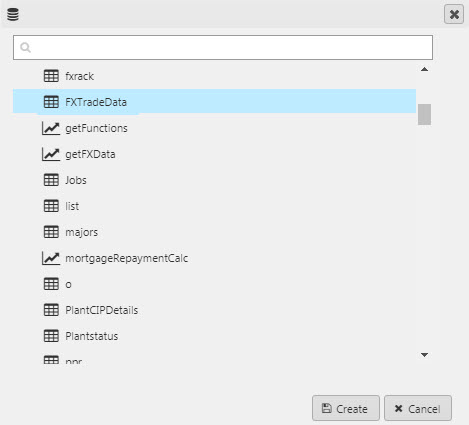
Add Data Source
Select a data source from the dropdown. Available data sources are determined by your Connection.
Add Filter
Filter against the data source using equal, not equal, less, less or equal, greater, greater or equal, is blank, is not blank, in, not in, or use a histogram range selector.
Check distinct to pull distinct values from all checked columns; each additional distinct column includes all distinct pairings across selected columns.

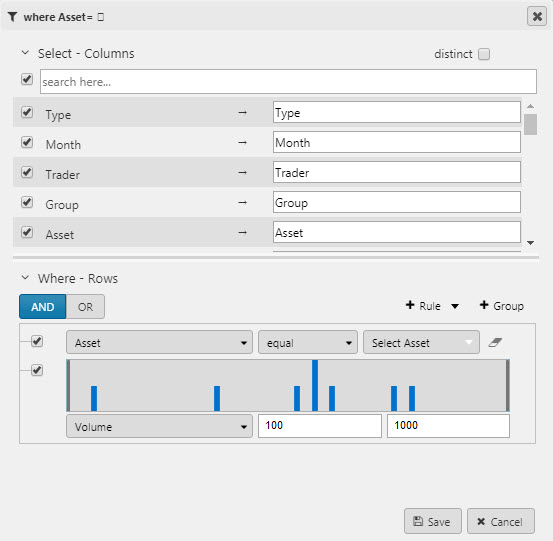
Select columns from the data source. Data Columns can be renamed in the Select - Columns option. Select columns and filter order can be re-organized using drag-and-drop.
Warning
When creating a Join between different data sources, the joining column(s) must share the same name.
Add Update
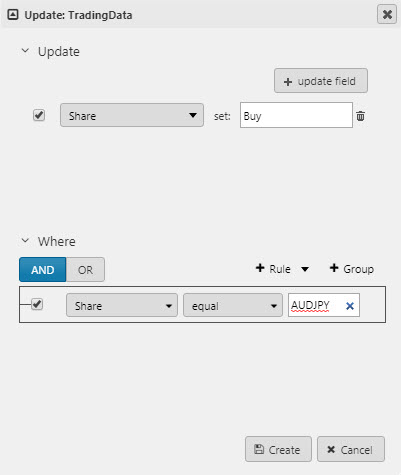
Update values within a column.
Add Group By
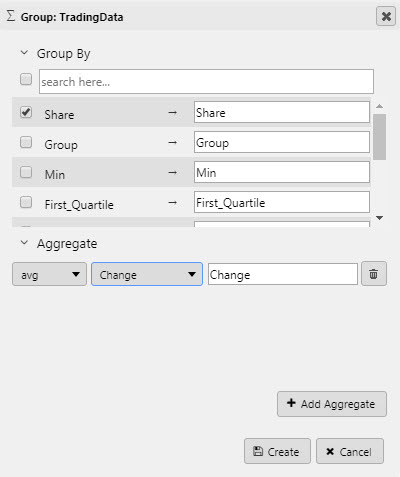
Create aggregate groupings for data columns. Options include: avg, cor, count, cov, dev, first, last, max, med, min, prd, scov, sdev, sum, svar, var, wavg and wsum.
Column grouping order can be re-organized using drag-and-drop.
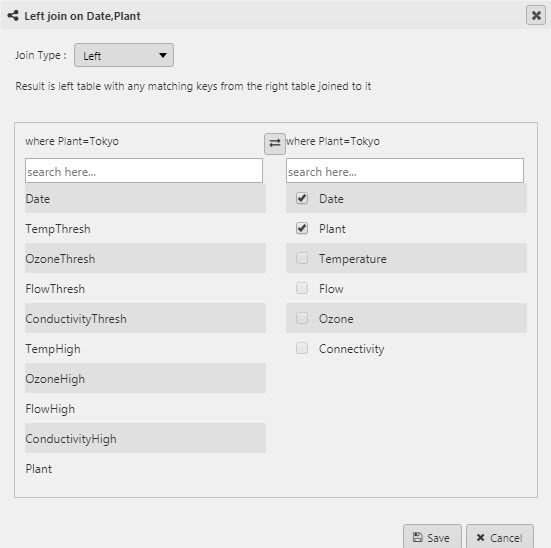
Add Join
Join an additional data source or function to an existing data source in your visual query. Options include left, inner, union, asof, upsert and plus.
Add Function
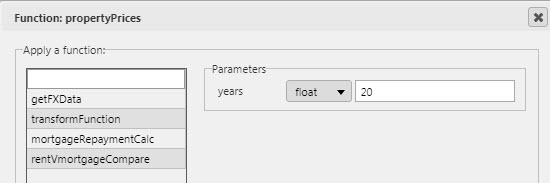
Add a pre-configured Function into the visual query.
Note
Visual Query Functions for Dashboards SDK are added to the demo.q file in the Sample directory.
Example:
    api.mortgageRepaymentCalc:{[res;years]
        months: years * 12;
        // rate: (interestRate % 100);
        update Monthly_repayment: ceiling((Price * 1.06) % months) from res(0);
where years is an adjustable view state parameter in the dashboard.