Manage Highlight Rules
This page describes Highlight Rules which are a common property utilizing color or icon markers, or both, to notify users of value changes and are best used with real-time streaming or polling data.

Highlight rules in operation in a Data Grid
Supported in: Canvas Chart, Data Grid, Pie Chart.
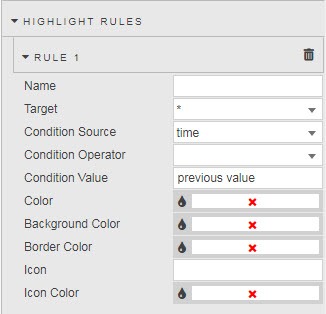
Build a Rule
| Field | Description |
|---|---|
| Name | Assign a name for your rule. |
| Target | The Data Source column updated when the rule is true. |
| Condition Source | The Data Source column monitored by the Condition Operator against the Condition Value. |
| Condition Operator | May be a numeric comparison, but can also test for strings in text values. search — find Condition Value match; assign a View State Parameter and pair with Text Input. contains — find all instances with the Condition Value. starts with — find all instances starting with the Condition Value. ends with — find all instances ending with the Condition Value. == — exact match, e.g. client name. < — less than Condition Value. > — greater than Condition Value. <= — less than or equal to Condition Value. >= — greater than or equal to Condition Value. != — excludes Condition Value. |
| Condition Value | Typically previous value. Can also be mapped to a View State Parameter. Can be either a numeric or text value; for example, if searching for a client name from a list of clients in a Data Grid column. |
| Color | Text color changed by rule when true. |
| Background Color | Data Grid cell background or Canvas Chart bar or point changed by rule when true. |
| Border Color | Data Grid cell border or Canvas Chart bar or point border changed by rule when true. |
| Icon / Icon Color | For Data Grid, icon appears when rule is true. |
See Data Grid for further details.
Gradient
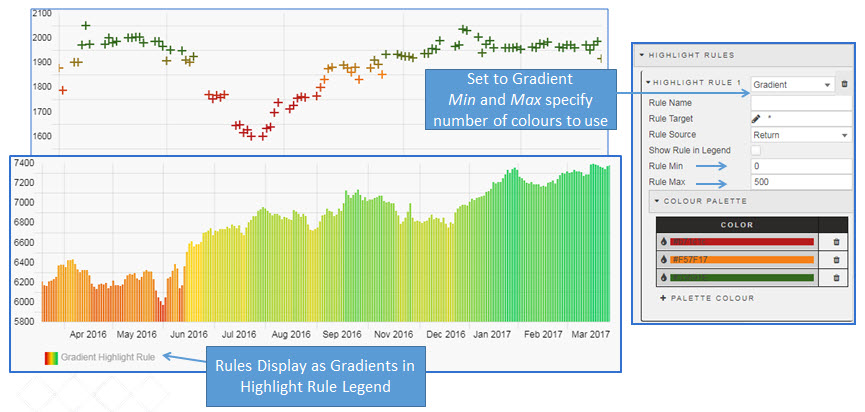
Gradient highlight rule applied to bubble and bar canvas chart
Set a gradient color using Color Palette with a range defined by Rule Min and Rule Max.
See Canvas Chart for further details.