Configure and Use the Chat Agent
This page describes how to configure and use the Dashboard Builder (chat agent) to create and edit dashboards using natural language.
The Dashboard Builder (also referred to as the chat agent) lets you generate and modify dashboards by describing what you want in plain language. Before it can be used, an administrator must configure an AI provider via Global Properties.
For a conceptual overview, see Natural Language Chat Agent.
Prerequisites
You must have administrator access to configure the chat agent. End users can use the chat agent once it has been configured.
Windows
Run dash.bat as normal. It automatically installs Express v4 if not already present and starts the NLX proxy — no additional steps required.
Linux and macOS
No shell launcher is provided, so you set up and start the NLX proxy manually from the Dashboards Direct root directory.
Install Express v4 (one-time):
npm install --save express@4
Start the NLX proxy before launching KX Dashboards, and leave it running in its own terminal:
node nlx-proxy.js
Warning
Do not install Express v5. The NLX proxy script is not compatible with it and fails with a PathError. Use Express v4 (for example, 4.22.2).
No additional setup is required. Proceed to Configure the chat agent.
Configure the chat agent
Configuration is done via Global Properties, which is accessible from the main menu in Edit Mode.
- Click the hamburger menu icon (☰) in the top-left corner of the application.
- Select Global Properties.
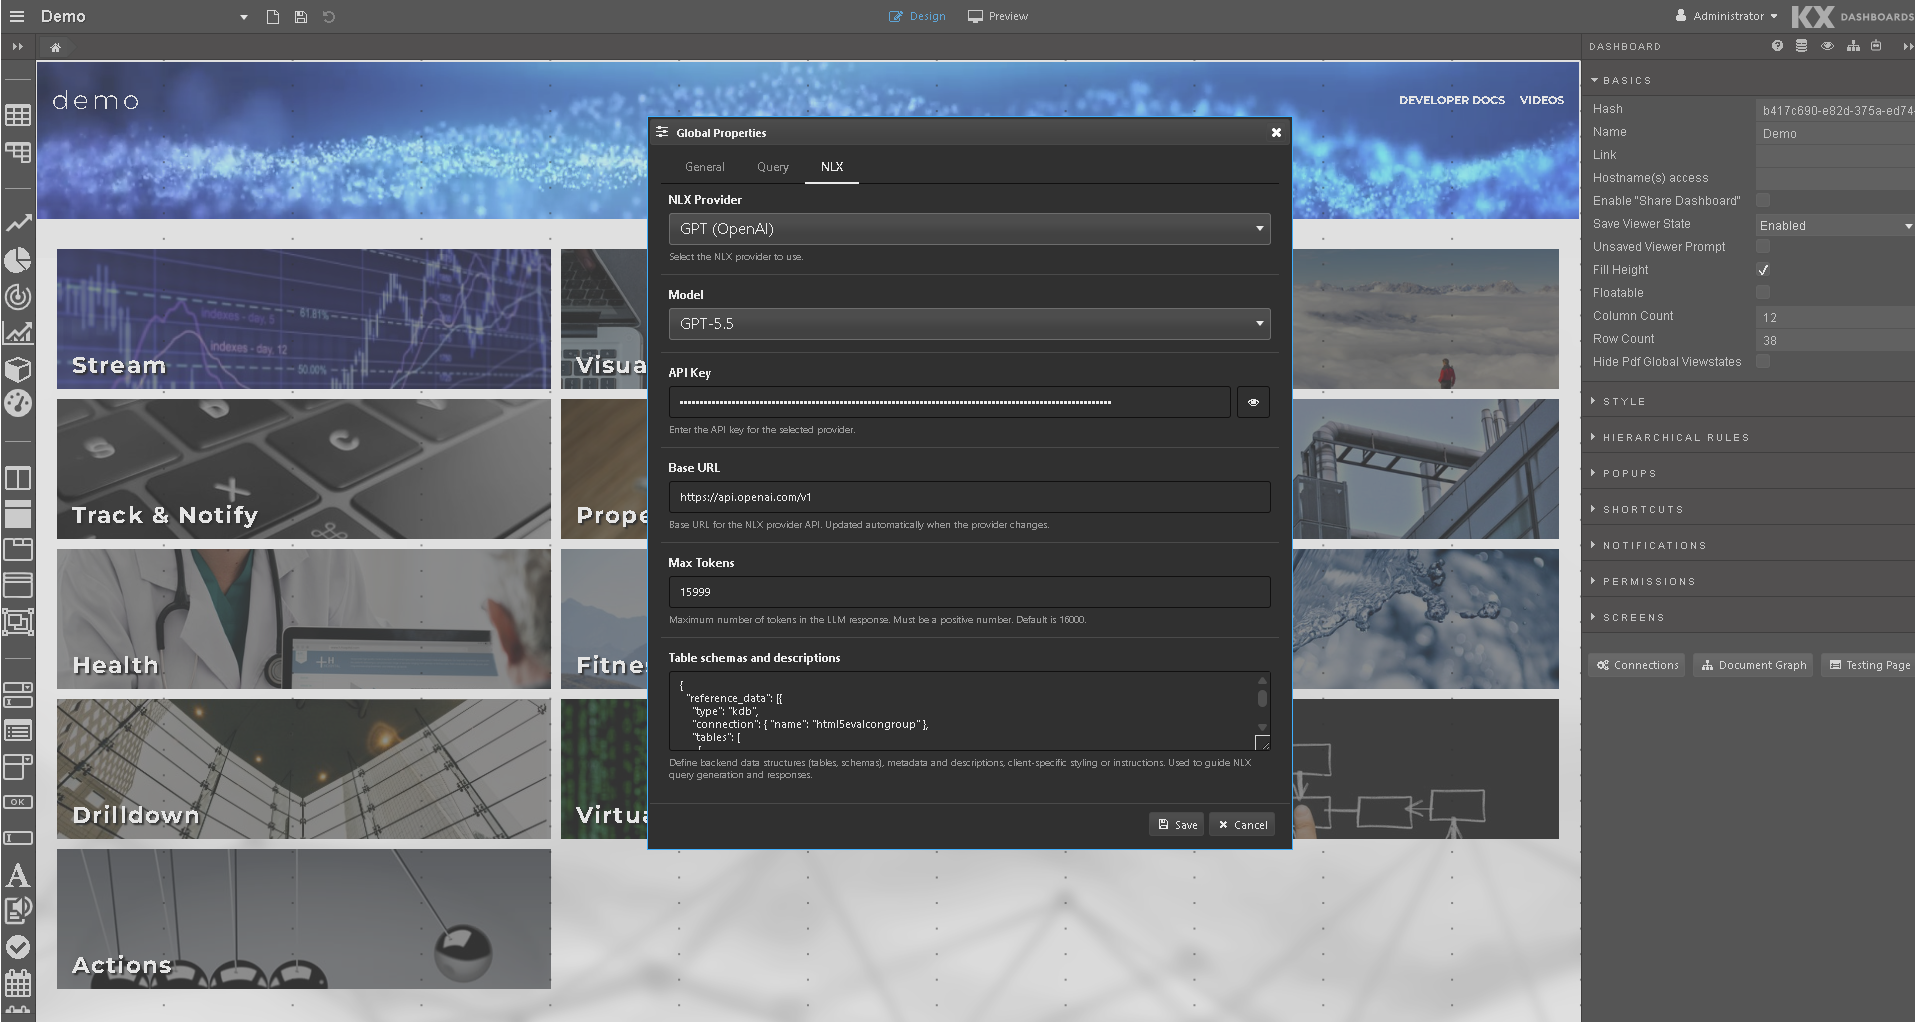
- Select the NLX tab.
- Configure the settings described in the table below.
- Click Save to apply your changes.
Warning
Changes made in Global Properties affect all users. Ensure the AI provider and API key you configure are appropriate for your organization's data and security requirements.
NLX settings
| Setting | Description |
|---|---|
| NLX Provider | The AI provider to use. Supported options are OpenAI, Claude (Anthropic), and Gemini. |
| Model | The specific model to use for the selected provider. |
| API Key | Your API key for the selected provider. This is stored and used to authenticate requests. |
| Base URL | The base URL for the provider's API. Updated automatically when the provider changes. Override this only if you are using a custom or self-hosted endpoint. |
| Max Tokens | Maximum number of tokens in the model's response. Must be a positive number. Default is 16000. |
| Table schemas and descriptions | A JSON definition of the backend data structures the agent will use — tables, schemas, metadata, column descriptions, and any client-specific instructions. This guides the agent when generating queries and dashboard definitions. See the example below. |
Table schemas and descriptions example:
{
  "type": "kdb",
  "connection": { "name": "connectionName" },
  "tables": [
    {
      "name": "TableName",
      "description": "Brief description of the table and its intended use. Note any type quirks or recommended components. Subscription: static | polling | streaming.",
      "columns": [
        { "name": "id",          "type": "long",    "description": "Unique record identifier." },
        { "name": "name",        "type": "string",  "description": "Display name or label." },
        { "name": "value",       "type": "float",   "description": "Numeric measure." },
        { "name": "category",    "type": "symbol",  "description": "Grouping or filter dimension." },
        { "name": "date",        "type": "date",    "description": "Date field. Note any casting requirements." },
        { "name": "latitude",    "type": "float",   "description": "Latitude (decimal degrees). Use for map Latitude binding." },
        { "name": "longitude",   "type": "float",   "description": "Longitude (decimal degrees). Use for map Longitude binding." }
      ]
    }
  ]
}
Access the chat agent
Once configured, the chat agent is available to all users from the main menu.
- Click the hamburger menu icon (☰) in the top-left corner of the application.
- Select Chat with AI Builder.
The Dashboard Builder dialog opens.
Create a dashboard
-
In the Dashboard Builder dialog, type a natural language description of the dashboard you want to create.
For example: "Create a dashboard showing trade data with a line chart and link FX symbols with a dropdown."
-
Optionally, specify a table name if you want to generate data against a specific table.
- Click Generate.
- Click Send or press Enter.
KX Dashboards sends your request to the configured AI provider and loads the returned dashboard definition automatically.
Tip
Be as specific as you can about the components, data, and layout you want. Including a table name and describing the type of visualization (for example, line chart, data grid, pie chart) produces more accurate results.
Edit an existing dashboard
You can use the Chat Agent to modify a dashboard that is already open.
- Open the dashboard you want to edit.
- Open the Dashboard Builder dialog from the main menu.
-
Describe the changes you want to make.
For example: "Add a dropdown to filter by currency and link it to the existing chart."
-
Click Edit.
- Click Send or press Enter.
The agent modifies the currently open dashboard based on your description.
Generation details
Each response in the chat history includes details that show metadata about the generation. Click Details to expand it.
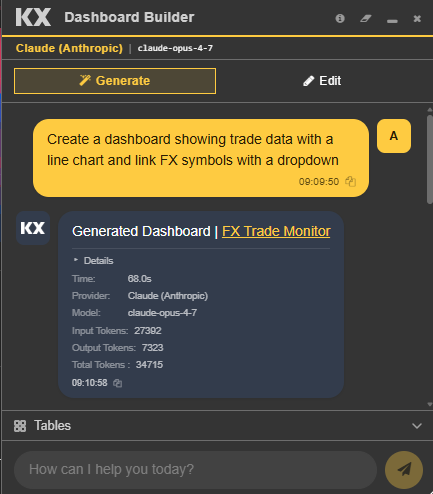
| Field | Description |
|---|---|
| Time | How long the generation took, in seconds. |
| Provider | The AI provider used for the request. |
| Model | The specific model used. |
| Input Tokens | The number of tokens sent to the provider, including your prompt and the dashboard context. |
| Output Tokens | The number of tokens returned by the provider. |
| Total Tokens | Combined input and output token count. |
Note
Token counts reflect the full context sent to the provider, which includes your prompt, data source metadata, and the dashboard generation instructions. High input token counts are expected.
Chat history
Each session is saved automatically. From the Dashboard Builder dialog you can:
-
Reopen a previous dashboard — Click the link in your chat history to load a previously generated dashboard.
-
Delete your history — Use the delete option in the dialog to permanently remove your chat history.
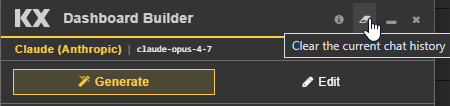
Note
Deleting your chat history is permanent and cannot be undone.