Financial Chart
This page describes how to set up and configure the Financial Chart component, a self-contained component for displaying asset prices (forex, equities and bonds) connected to a price feed.
Set Up a Financial Chart
To set up a Financial Chart, click-and-drag the component into the workspace and configure the following:
- Start with a data source with data columns for
Timeand/orDate,Open,High,Low,CloseandVolume. - Decide the chart type to use.
Refer to Financial Chart properties described in the next section for details on additional properties.
Financial Chart Properties
The following sections provides details on how to configure the properties of the Financial Chart component.
Basics
Open the Basics properties on the right and configure the properties described in the following table.

| Field | Description |
|---|---|
| Name | Enter a name for the component. |
| Data Source | Price data is read from column source headers — case sensitive — for Open, High, Low, Close, Volume with an additional time column of Date or Time. The component automatically assigns price, data and volume columns to their respective data values, defaulting to Time where both Date and Time are available.Refer to Data sources for further details. |
| DecimalPlaces | Enter the number of decimal places to use for the price chart. |
| Display From / Display To | Select the charted price area between Display From and Display To; these can be set to View State Parameters. |
| Chart Type | Select a chart type: Open, High, Low, Close, Candlestick, Bar, Kagi, Heikin Ashi, Mountain.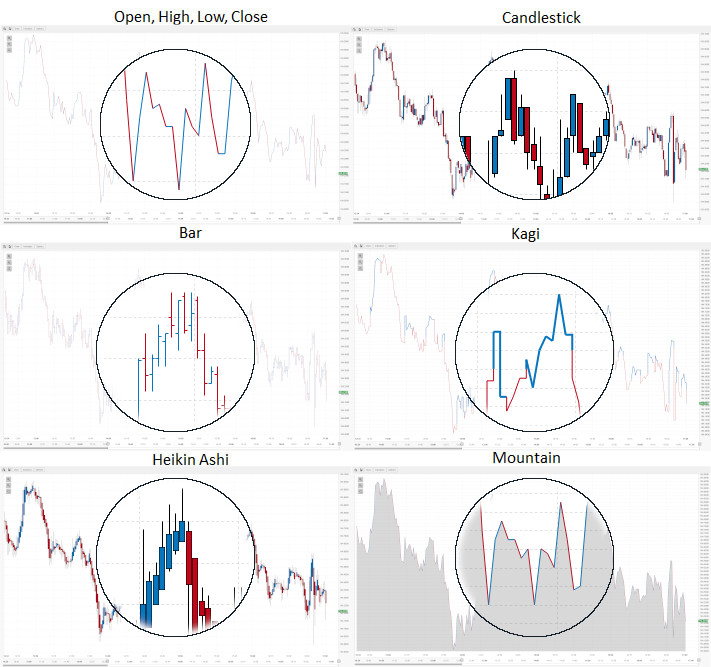 |
| Crosshair | Snap to Price — Crosshair centers on closing price of selected time period. Free Flow — Crosshair position at mouse point. None — No crosshair. |
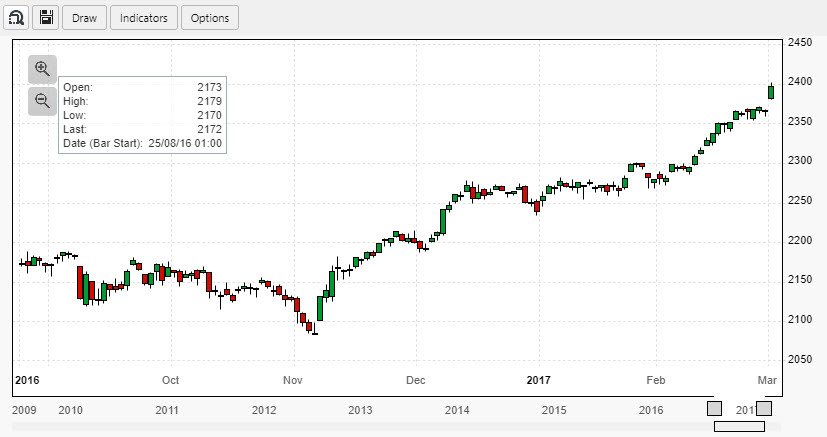
| Show Info Box | When checked the chart displays Open, High, Low and Closing Price of the selected time period.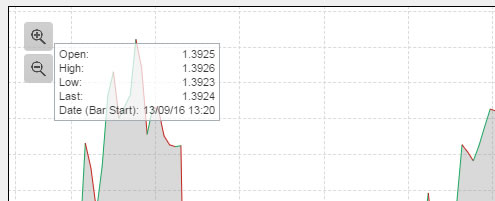 |
| Show Disclaimer | When checked, the chart displays a disclaimer in small type at the bottom right of the chart. |
| Show Volume | Adds volume data as a bar chart below price. |
| Annotations | A view state parameter of type string (preferable) or symbol to store persistent chart annotations; chart must be saved by the user for annotations to persist. |
| Indicators | A view state parameter of type string (preferable) or symbol to store persistent chart indicators; chart must be saved by the user for indicators to persist.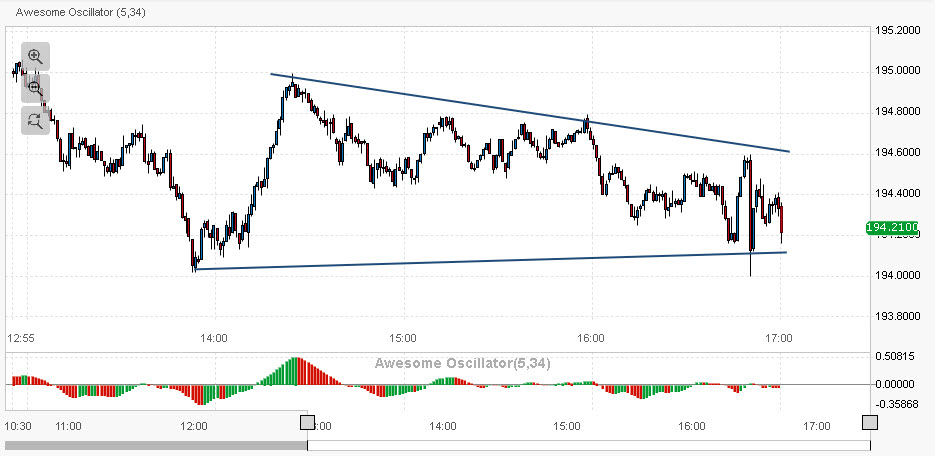 |
Toolbar
Configure the properties, described in the following table.
| Field | Description |
|---|---|
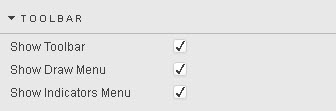
| Show Toolbar / Show Draw Menu / Show Indicators Menu | When checked, show the Toolbar and its components.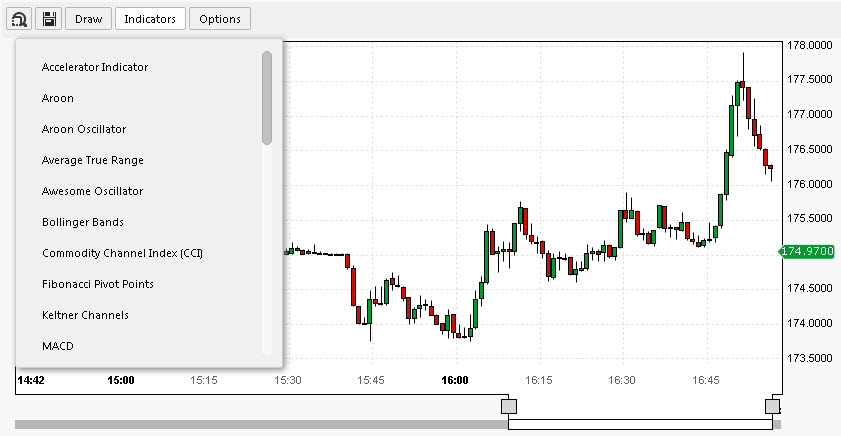 |
Style
Configure the properties, described in the following table.
| Field | Description |
|---|---|
| Horizontal Grid Lines / Vertical Grid Lines | Set the color of grid lines. |
| Crosshair | Set the color of overlay crosshair. |
| Background | Set the background color of chart. |
| Alternative Background | A second background color for the chart.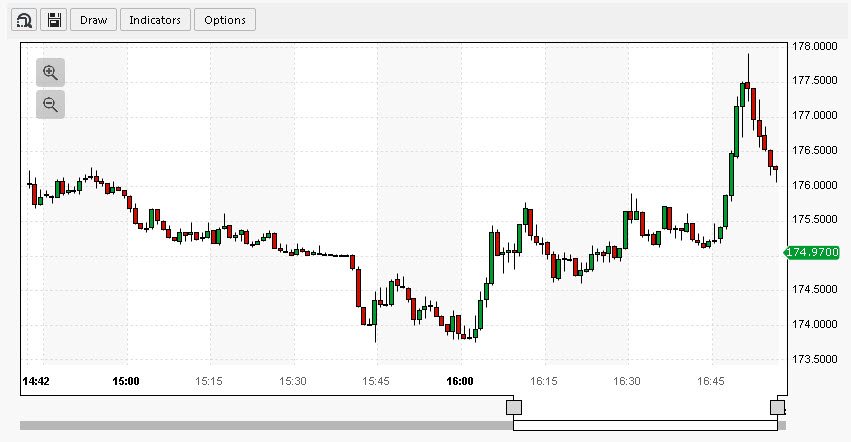 |
| Chart Border | Set the color for the border of the chart. |
| Text Major | Set the color of the main text on chart. For example, primary X-axis tick labels. |
| Text Minor | Set the color of text label on chart. For example, minor X-axis tick labels. |
| Selected Background | Set the color of highlight text on X axis. |
| Selected Foreground | Set the color of text of X-axis highlight. |
| Candlestick Up | Set the color of candlestick price bars where open > prior close. |
| Candlestick Down | Set the color of candlestick price bars where open < prior close. |
| CSS Classes | Assign CSS style class to component. |
| Advanced CSS | Refer to Advanced CSS for details. |
Margins, Format
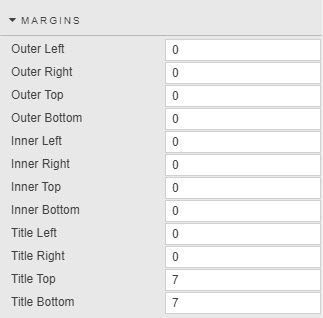
Refer to Style for common settings.
User Chart Settings
This allows chart users to customize the look of the chart, setting background and axis colors, gridlines, and the color of the price bars.
- Right click in the main chart to get the Settings menu.
- Clicking Default resets the settings to the selected Light or Dark theme.
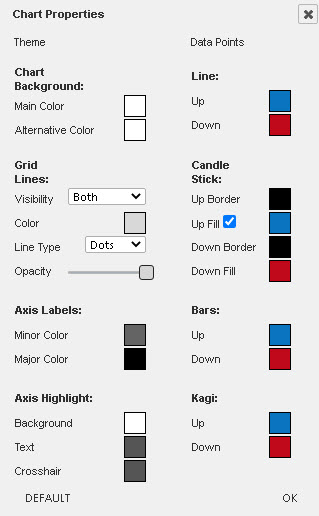
Chart Controls
The following sections describe the chart controls available to the user.
Region Zoom
Click the region-zoom icon  to activate. Click on the chart and drag left or right the area of price action to focus on. Release the click to zoom.
Save Chart
A pop-up window offers a dropdown choice of image size (360, 460, 520, 620, 780, 900, 1024, 1280, and 1,600px) and a download button. The chart will be saved to the local machine's Download directory.
Draw
Draw items are classified into three categories: Basic, Shapes and Text, and Advanced. Prior to adding a draw item, the Shape Properties can be set. These properties can also be changed after a shape is added.
| Field | Description |
|---|---|
| Trend Line | Anchored by two points on a chart. To create a price channel, select-and-right-click the line and do a line copy, then paste. A parallel line is positioned next to the original which can be moved by left-click-and-drag.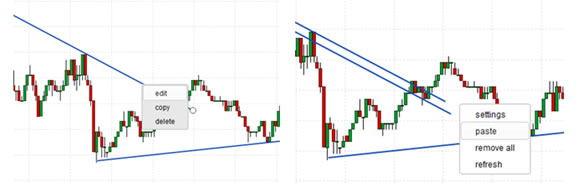 |
| Horizontal Line | A price-line marker, best used to denote custom support and resistance. Automatically extends to the price axis and displays the price. Right-click to edit thickness, color, opacity, type, and direction.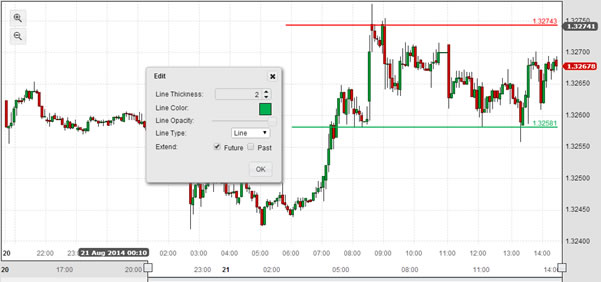 |
| Vertical Line | Similar to a horizontal line, except it marks a point in time. A left click displays the move icon; drag to reposition. |
| Target Line | Creates a line at a selected target price; optional entry and stop levels too.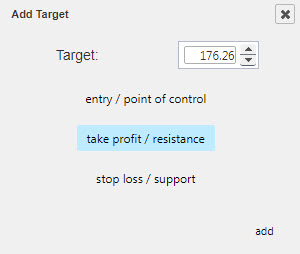 |
| Ellipse | Adds a circle on the chart, perhaps to highlight peaks and troughs in price action. The opacity tool within the Edit menu can be set to avoid obscuring the underlying price action.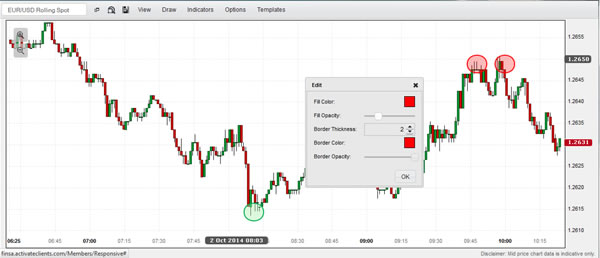 |
| Rectangle / Rotation Rectangle | Can be used to mark consolidation regions or thicker bands of support and resistance.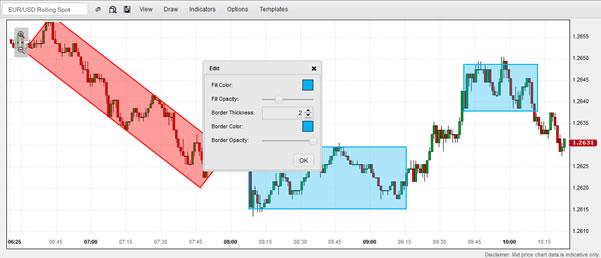 |
| Text Note | Comments added directly to the chart. Each note has four pointer anchors (one on each side) that can be dragged into position. Font size, margin padding and border thickness can be adjusted. Text color, border colors and opacity can also be changed.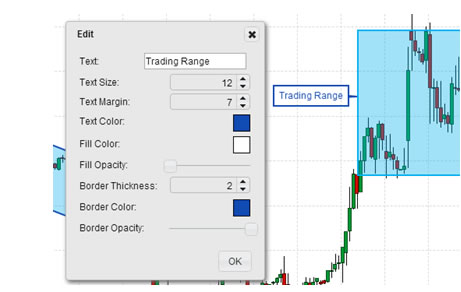 |
| Fibonacci Retracements, Time Zones, Fan and Arcs | Set Fibonacci anchors to peaks and troughs. Right-click-edit to change colors, opacity and line thickness.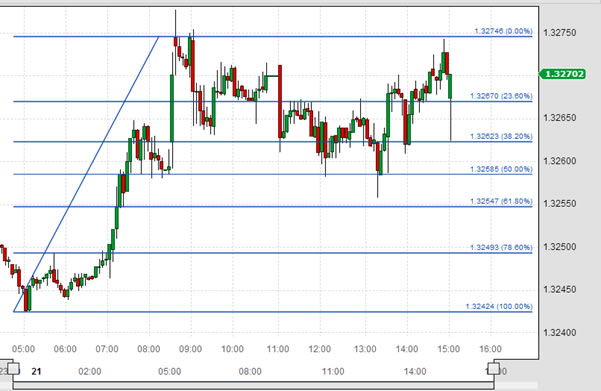 |
| DiNapoli Levels | Set the three anchors so the mid-point is highest (for projecting bullish price targets) or lowest (for bearish).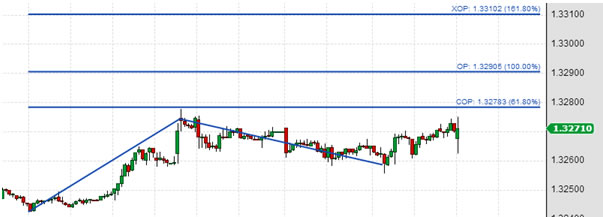 |
| Gann Box / Gann Fan | Can help define upcoming support/resistance and inflection points. Use the opacity tool to blend the Gann box into the price chart.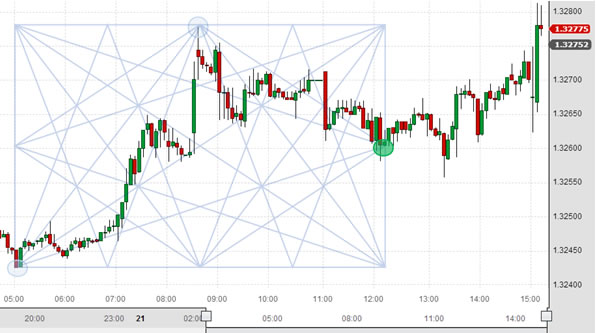 |
| Andrews' Pitchforks | Configured so that the mid-line is anchored at the base of the trend, with the two outer forks aligning along the projected channel.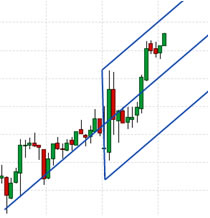 |
| Draw Item | Description |
|---|---|
| DiNapoli Levels | Part of the Fibonacci group of price analytics. Where Fibonacci levels look at retracements, DiNapoli Levels look at expansions and are used to determine price projections. The COP (0.618) is the Contracted Objective Point, the OP (1.000) is the Objective Point, and the XOP (1.618) is the eXpanded Objective Point, all measured from wave B. |
| Fibonacci Retracements | Ratios used to identify potential reversal levels, derived from the Fibonacci sequence. The most popular retracements are 61.8% and 38.2%. Price moves retracing more than 72% often go on to retrace 100%. |
| Andrews' Pitchfork | A trend channel tool with three lines: a median line and two parallel equidistant trend lines marking support and resistance. When price breaks the channel line, the tool can be redrawn with the broken line as the new median. |
| Fibonacci Fans | Trend lines based on Fibonacci retracement points, used to estimate potential support or resistance levels. |
| Fibonacci Time Zones | Vertical lines based on the Fibonacci Sequence running along the time axis, used to determine price reversals based on time. |
| Fibonacci Arcs | Half circles along a trend line. Each arc marks a potential support or reversal level factoring both price and time. |
| Gann Box | Diagonal lines moving at a uniform rate of speed, used to define support and resistance. The 1x1 angle is often referred to as the 45-degree angle. Works best on weekly or monthly charts. |
| Gann Fan | Diagonal lines at uniform rates of speed. A balanced trend follows the 1x1 angle, a strong trade will run at or above 2x1, a weak trend at or below 1x2. |
Indicators
The Indicators menu provides a list of price overlays and lower panel technical indicators.
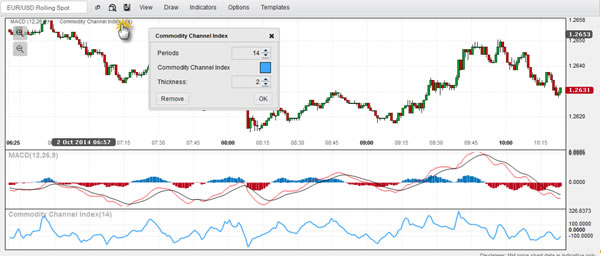
Individual indicator settings can be edited by clicking on the relevant indicator in the Indicator bar.
| Indicator | Description |
|---|---|
| Accelerator Indicator | Measures price driving force as an early warning signal of change. Three green columns below zero is a long signal; three red columns above zero is a short signal. |
| Aroon | Determines if an asset is trending and the strength of that trend by measuring the number of periods since price recorded an x-bar high or low. A new trend occurs when Aroon lines cross each other and cross above 50. |
| Aroon Oscillator | The difference between Aroon-Up and Aroon-Down, moving between -100 and +100. Positive is bullish bias; negative is bearish bias. |
| Awesome Oscillator | A momentum indicator comparing momentum over the last 5 bars with the previous 34 bars. Buy/sell signals generated on histogram peaks, zero line crossings, and divergences. |
| Bollinger Bands | Volatility bands above and below a moving average (default: 20-period SMA, ±2 standard deviations). Bands widen with volatility and narrow without. Useful for identifying M-Tops and W-Bottoms. |
| Commodity Channel Index | Identifies new trends or extreme conditions by measuring current price relative to average price. Bullish signal on cross above +100; bearish on cross below -100. |
| Directional Movement System | Measures trend strength (ADX) and direction (+DI/-DI). Strong trend when ADX is above 25; no trend below 20. Trade signals occur on +DI and -DI crossovers. |
| Ichimoku Clouds | Provides predefined trend, support and resistance levels. Works best on weekly or daily charts. Signals generated on Tenkan-sen/Kijun-Sen crossovers, price crossing the cloud, and cloud color changes. |
| Keltner Channels | Trend following indicator using ATR-based volatility envelopes around a 20-period EMA. Best used in conjunction with a momentum indicator like RSI. |
| MACD | Moving Average Convergence-Divergence measures momentum using 12-day and 26-day EMAs. Signals on signal line crossovers, midline crossovers, and divergences. |
| Momentum | The difference in closing price between the current bar and n bars ago (default n=10). Buy on cross above zero; sell on cross below zero. |
| Moving Average (Exponential) | Smooths price data applying more weight to recent prices. Signals on price/MA crossovers, MA crossovers, or price pullbacks to the MA. |
| Moving Average (Simple) | Sum of periods divided by the period. Signals on price/MA crossovers, MA crossovers, or price pullbacks to the MA. |
| Moving Average (Weighted) | Linear weighting applied to prices, with most recent carrying higher weighting. |
| Price ROC | Rate of Change measures percent price change from one period to another. Used to determine overbought/oversold conditions. |
| Price Oscillator | Difference between two simple moving averages. Similar to MACD. Crosses of zero define trend direction changes. |
| Relative Strength Index | Momentum oscillator between 0 and 100. Overbought above 70; oversold below 30. Tracks divergences between RSI and price. |
| Standard Deviation | Volatility metric measuring variability around an average. Used to identify low-risk opportunities as volatility declines. |
| Stochastic Oscillator | Momentum indicator measuring the close relative to the high-low range. Available in Full, Fast, and Slow variants. |
| Swing Index | Compares relationships between current and previous period open, high, low and close prices. Used to determine overbought and oversold conditions. |
| Support / Resistance | Identifies potential demand and supply areas around reversal points based on open or closing price. A sensitivity setting adjusts the levels found. |
| TRIX | Percent rate of change of a triple exponential smoothed moving average. Centerline crossovers determine momentum; reversals marked by divergence. |
| True Range | Volatility indicator: the greatest of current high minus low, current high minus previous close, or current low minus previous close. |
| Typical Price | The arithmetic average of High, Low and Close. |
| Ultimate Oscillator | Captures momentum across three time frames to avoid pitfalls of single time frame oscillators. Divergence-based trade signals. |
| Welles Wilder Smoothing | Identifies price trends using a smoothing factor applied to a simple moving average. Similar output to an EMA at double the period setting. |
| Williams %R | Momentum indicator measuring close relative to the highest high for the look-back period. Overbought above -20; oversold below -80. |
| ZigZag | Filters out smaller price movements below a set percentage threshold. No predictive quality but useful alongside Fibonacci retracements or Elliott Wave. |
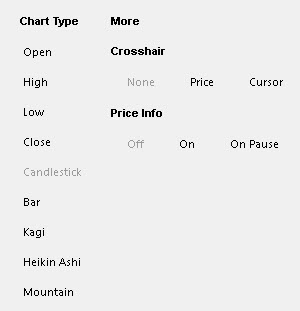
Options
The Options dialog allows the user to configure the Chart Type, including Line (O, H, L, C), Candlestick, Bar, Kagi, Heikin Ashi and Mountain Charts.
The Crosshair can be toggled from off, to the position of the cursor, or to align with the closing price.
The Price Info can be toggled on, off, or to "on pause" — which appears after the cursor stops moving and hides when it moves.