Offline Maps
Build a custom map without any external api calls.
Use cases for Offline maps include:
- Visualizing and animating geographic data
- No external access to the internet or external apis
- Adding points, circles, lines and popups to maps programmatically
- Display and interacting with large quantities of data on a map
- Querying and filtering features on a map
- Dynamically displaying and styling custom client-side data on a map
- Annotating polygons and lines on geographic data
- Visualizing streaming and moving data geographically
- Layering multiple layers of data on top of each other
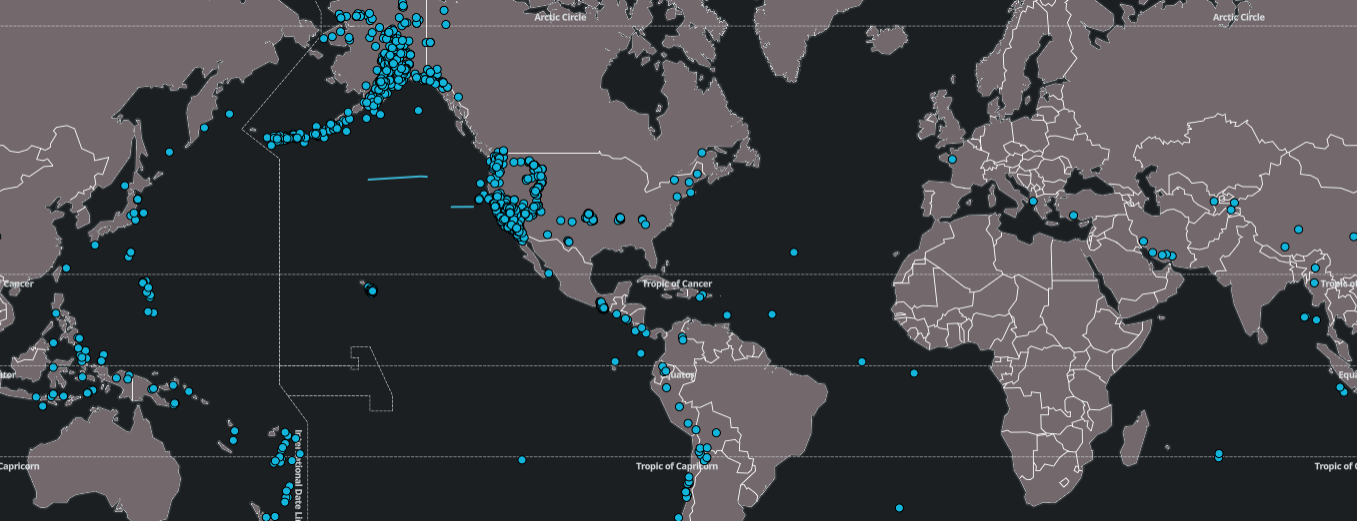
A Map with defined circles
Map
Determine the loaded zoom, coordinates and the style of the map style being used to determine which tilesets the map includes and how they are styled.
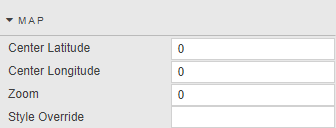
- Center Latitude/Longitude
- Sets map center on dashboard load; define longitude and latitude values.
- Zoom
- The initial zoom level
- Style Override
-
If set, then the default style is overrided with the JSON/GeoJSON set in the style.
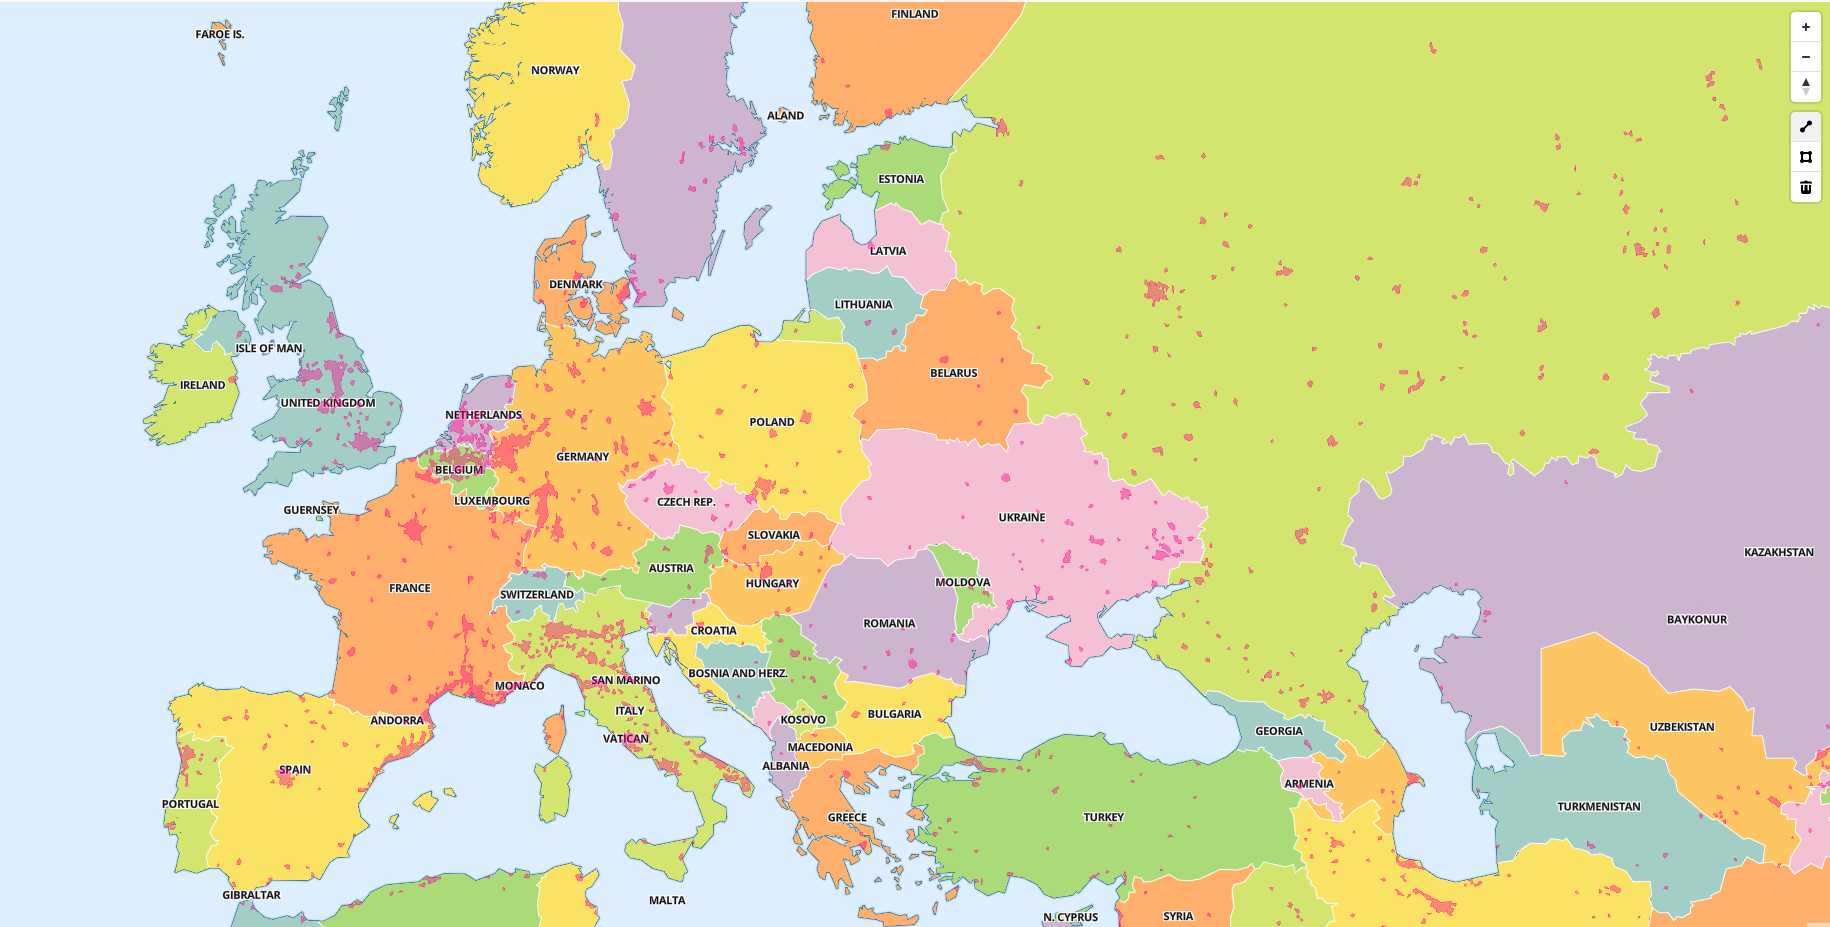
Default Style
The Offline map component is set with a default map style.
This style uses:
- For its source used a baked in vector and a country tile server (.pbf file)
- For the glyphs, there is a baked in font
- For the layout, there is a set of countries defined with a colour scheme
All of the above can be overriden by this property
All of the default properties are part of the component and no external api requests are needed
Point
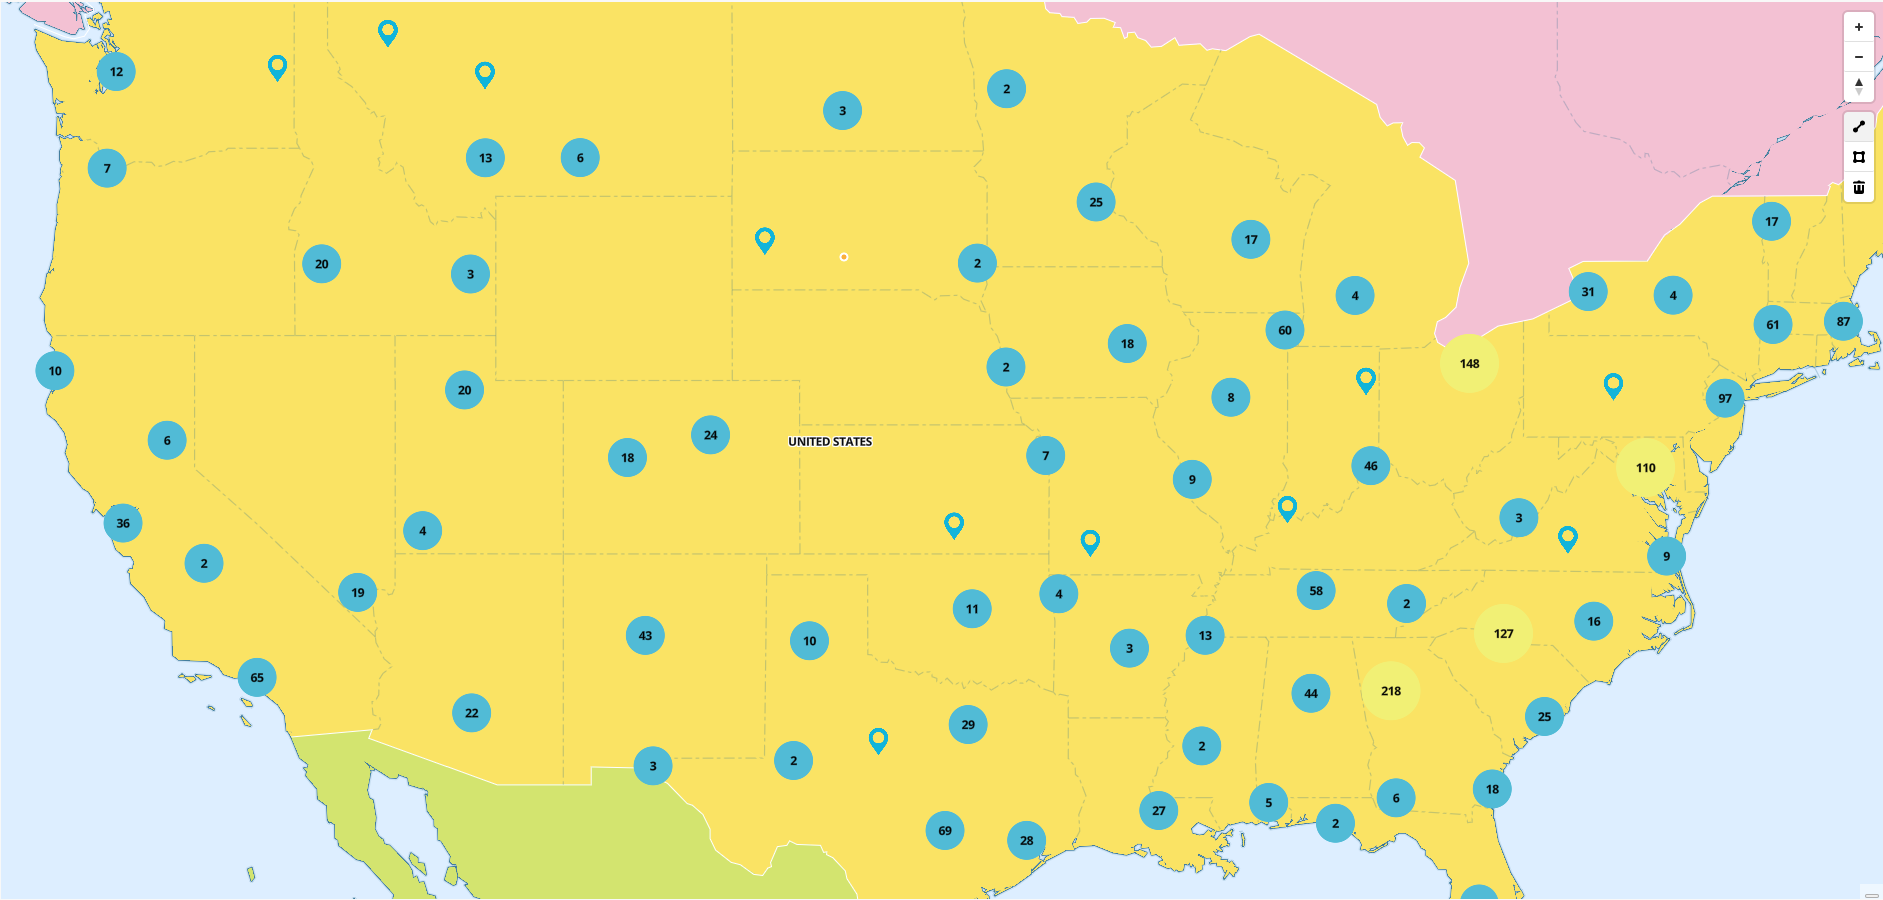
A Map of with points using clustering
Can display a custom point image at a developer-specified geographic coordinate with an option to add clustering
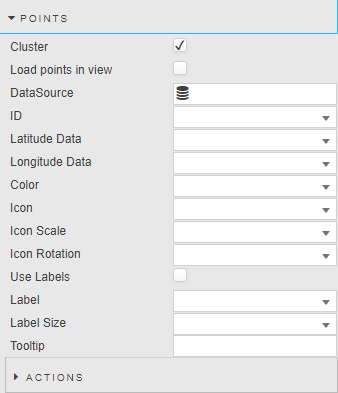
Points properties
- Cluster
- When checked, replaces grouped individual points with a numeric cluster icon. Circles outside cluster remain displayed as individual points.
- Data Source
- A data source that includes geographic coordinates
- ID
- A distinct identifier for a point
- Latitude / Longitude Data
- Data Source columns for latitude and longitude
- Color
- Color of the map point graphic
- Icon
- The shape of the map point graphic. Uses a pointer by default.
- Icon Size
- The proportial size of the shape. Uses 1 by default
- Icon Rotation
directionaluses point icons- Use Labels
- When checked, displays a label for each of the points
- Label
- The label displayed next to each point
- Label Size
- The label font size
- Tooltip
- When checked, displays a tooltip on points mouseover
Action
Circle
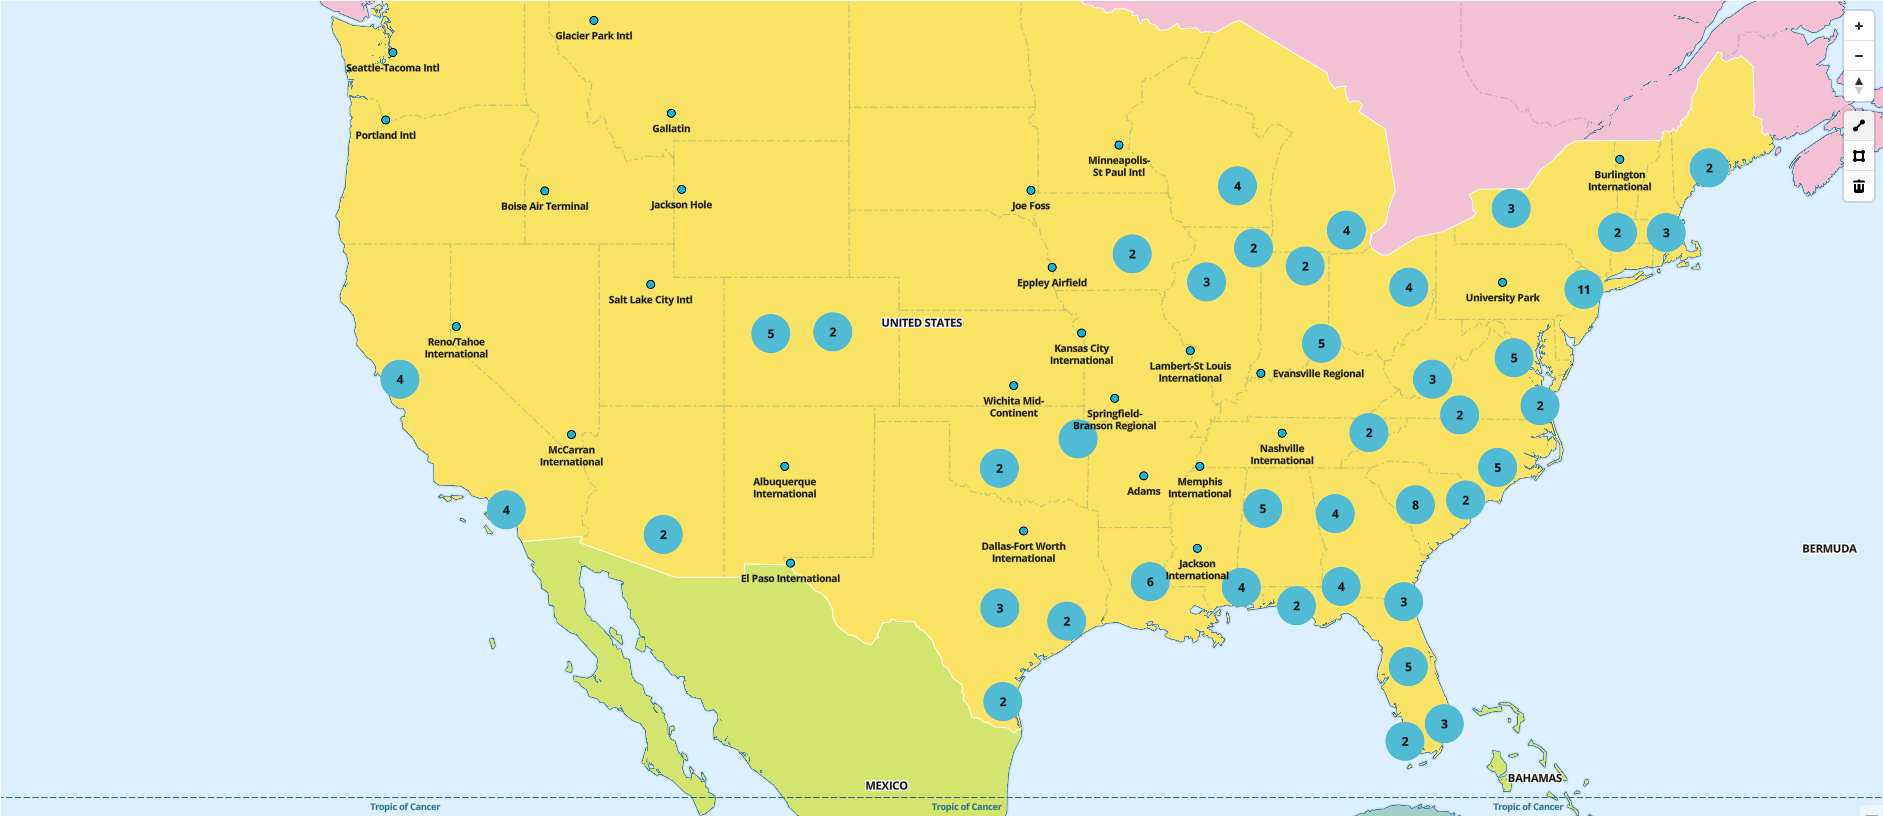
A Map of with circles using clustering
Determine custom circle with clustering
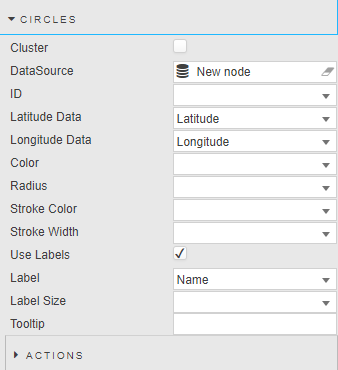
Circles properties
- Cluster
- When checked, replaces grouped individual circles with a numeric cluster icon. Circles outside cluster remain displayed as individual circles.
- Data Source
- A data source that includes geographic coordinates
- ID
- A distinct identifier for a circle
- Latitude / Longitude Data
- Data Source columns for latitude and longitude
- Color
- Color of the map circle graphic
- Radius
- Radius of the map circle graphic
- Stroke Color
- The border color of the map circle graphic
- Stroke Width
- The border width of the map circle graphic
- Use Labels
- When checked, displays a label for each of the circles
- Label
- The label displayed next to each circle
- Label Size
- The label font size
- Tooltip
- When checked, displays a tooltip on circle mouseover
Action
Line
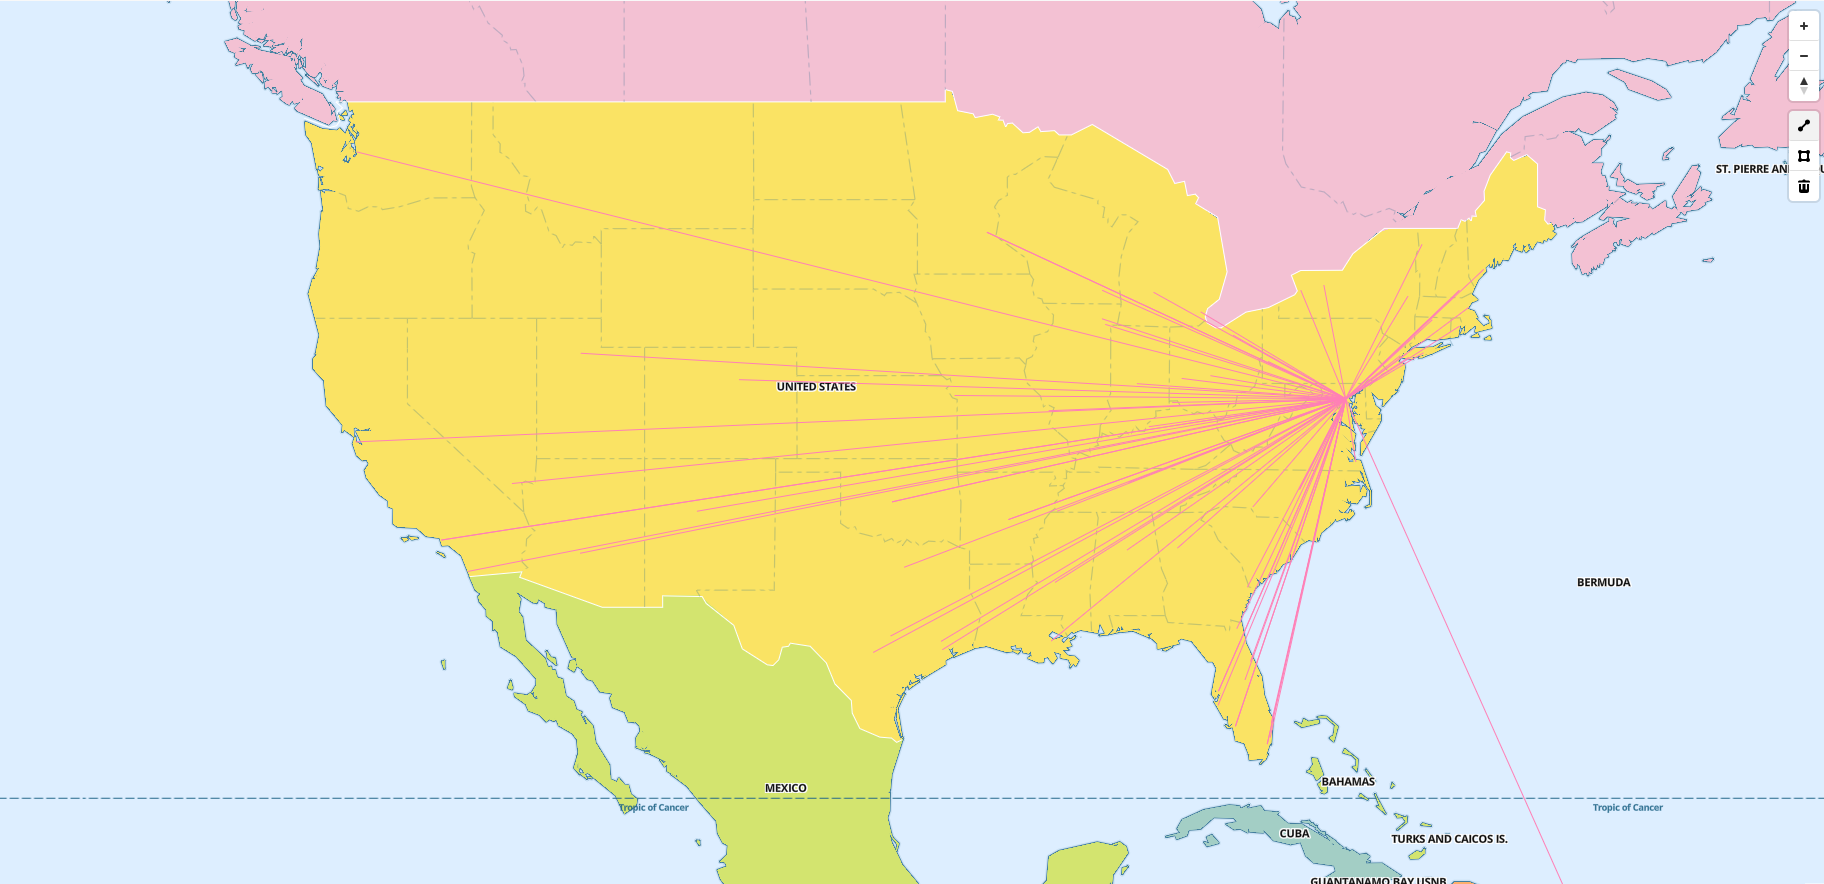
A Map of with a line layer
Determine lines with customizable styling
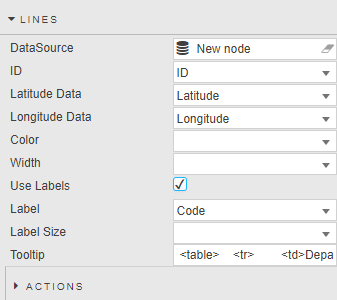
Lines properties
- Data Source
- A data source that includes geographic coordinates
- ID
- Lines are grouped by common ids
- Latitude / Longitude Data
- Data Source columns for latitude and longitude
- Color
- Color of the map line graphic
- Width
- The width of the map line graphic
- Use Labels
- When checked, displays a label for each of the lines
- Label
- The label displayed next to each line
- Label Size
- The label font size
- Tooltip
- When checked, displays a tooltip on circle mouseover
Action
Annotation
Add annotations to the map using line, polygon shapes.
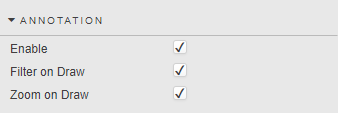
Annotation properties
- Enable
- When checked, Users can annotate on the map, using either line or polygons
- Filter on Draw
- When checked, if using a polygon, the user can draw on an area of the map and when finished drawing the all the points/circles inside the area remain and the rest of the points/circles are filtered out
- Zoom on Draw
-
When checked, if using a polygon, the user can draw on an area of the map and when finished drawing the map zooms to the area
Annotation Control
There are 3 options in the Annotation Control.

- Line Draw
- Polygon Draw
- Delete Annotation
Drawing a line
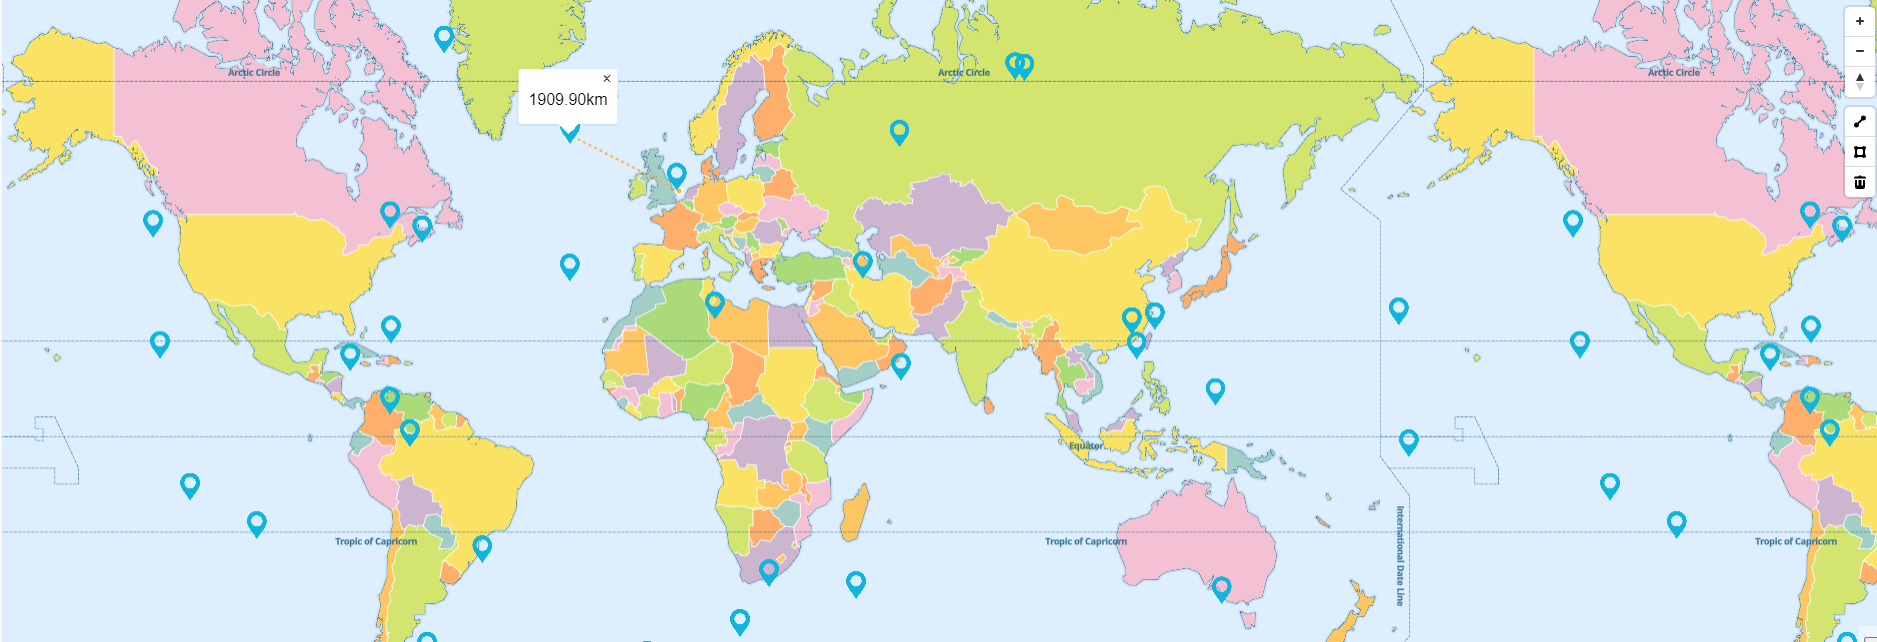
Use case
- A user can draw a line annotation on a map to calculate the distance between 2 or more points.
- Once the user is done drawing the distance will appear in a popup (in kilometres)
How to draw
- In the annotation control (displayed on the right hand side), click on the line icon
- Then simply selected the starting point on the map (by using a left or right mouse click)
- You can click at any other point on the map to connect this line.
- The line will be displayed as a yellow dashed line while editing
- Once done editting, you can click on the line (this will set the line to blue)
How to delete
- To delete simply select the line and click on the trash icon in the annotations menu
- The line will be then removed from the map
Drawing a polygon
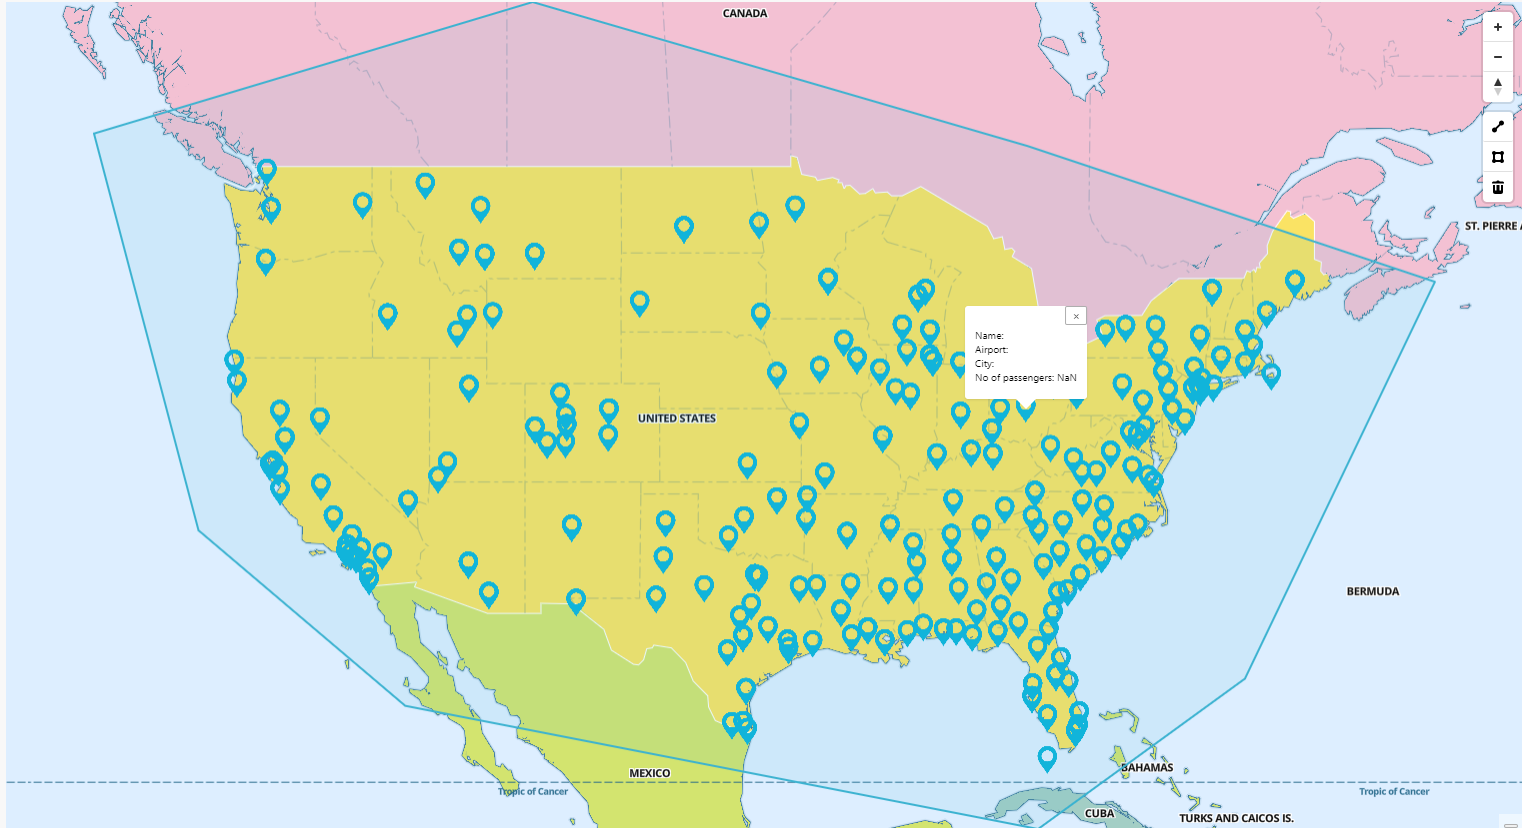
Use case
- The polygon annotation, allows the user to draw on the map and select a set of points/circles
- If Zoom on Draw is checked then it will zoom in on the polygon after the polygon is applied
- If Filter on Draw is checked then it will display only the points/circles inside the polygon shape after the polygon is applied
How to draw
- In the annotation control (displayed on the right hand side), click on the polygon icon
- The click on the map where you want to start the polygon, after this you can click on multiple sections of the map to connect the polygon points
- The polygon will be displayed as a yellow dashed line while editing
- Once done editting, you can click on the line (this will set the polygon to blue)
How to delete
- To delete simply select the polygon and click on the trash icon in the annotations menu
- The polygon will be then removed from the map
Layers
Demo of Layers - showing all the ubran areas on the map
Each layer provides rules about how the renderer should draw certain data in the browser, and the renderer uses these layers to draw the map on the screen.
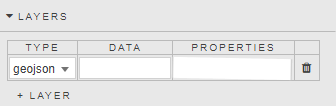
Layers properties
- Type
- Determine the layer type (either GeoJSON or vector)
- Data
-
The data used by the layer (specified in eithe JSON or GeoJSON format)
Example
{ "type":"FeatureCollection", "features": [{ "type":"Feature", "properties": { "scalerank":3, "area_sqkm":1002.565, "featureclass":"Urban area" }, "geometry": { "type":"Polygon", "coordinates": [[[-121.37881303595779,38.39168793390614],[-121.37881303595779,38.39168793390614],[-121.37881303595779,38.39168793390614],[-121.42144609259859,38.3858743352733],[-121.48040890184362,38.39168793390614],[-121.51616899298959,38.444811306302185],[-121.58203060594559,38.4678848333205],[-121.5930118478076,38.626428127591964],[-121.46772233771595,38.671102403308296],[-121.39491024461671,38.75068410903778],[-121.31532853888723,38.82349620213702],[-121.23913163947286,38.82349620213702],[-121.19226111538413,38.73701569269657],[-121.13750993537089,38.65836416274834],[-121.19386308478518,38.61312144627681],[-121.26453060594432,38.58219310155013],[-121.32057369676485,38.53666616470099],[-121.37881303595779,38.4933096380081],[-121.37062232143953,38.43667226821621],[-121.37881303595779,38.39168793390614]]] } } }] }
- Properties
-
The style properties used by the layer
Example
{ "id": "urban-areas-fill", "type": "fill", "source": "urban-areas", "layout": {}, "paint": { "fill-color": "#f08", "fill-opacity": 0.4 } }
Bounds
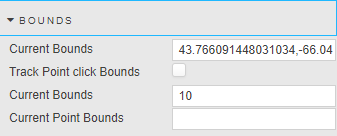
Bounds properties
- Current Bounds
- Map selected bounds coordinates of the overlay to a View State Parameter
- Track Point click Bounds
- When checked, tracks the bounds coordinates of a point when clicked
- Current Bounds
- Sets a radius for the Track Point click Bounds
- Current Point Bounds
- Displays the point bounds coordinates + the Current Bounds radius
Icons
A list of icons that have been added to the "css\assets\images" on the server. These icons can be used by the Icon properties in Point
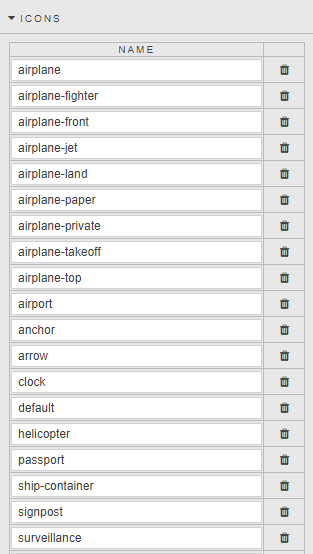
Icon properties
Style
Override the dafaut colours used in the Offline map component
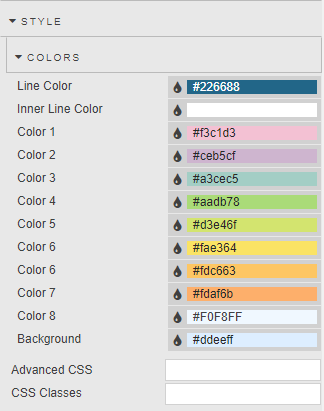
Style properties
Info
To avoid having to use any external APIs - we store all our assets including glyphs, images and tiles in the "css\assets\" folder in side the component code