Gauge
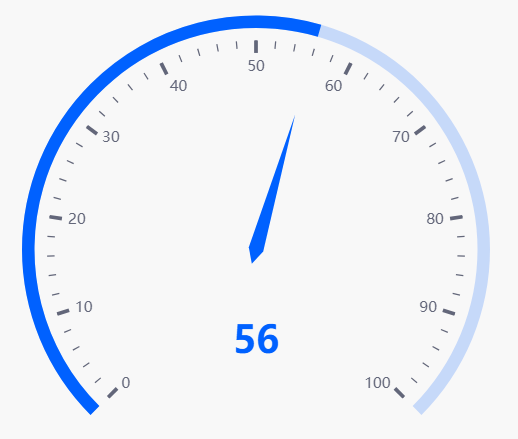
A Gauge chart is used to display a single value of quantitative data.
Set up
- Select a Data Source
- Select a Data Column
- Set your Min and Max
Basics
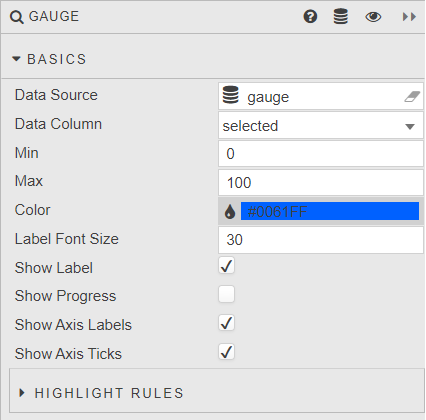
- Data Source
- Data sources
- Data Column
- Select data column to plot from the data source.
- Min
- Max
- Set min and max of the chart.
- Color
- Default color used when
Progressis enabled or when highlight rules not set. - Label Font Size
- Define font size of label.
- Show Label
- Toggle display of label.
- Show Progress
- Show the Progress bar. When enabled, toggles off the highlight rules and uses default color
- Show Axis Labels
- Toggle display of axis labels.
- Show Axis Ticks
- Toggle display of axis ticks.
- Highlight Rules
- Highlight Rules
Style, Margins, Format
Style for common settings