Query
The purpose of this walkthrough is to guide you through the steps to query stored data on an active databases.
This walkthrough makes reference to data ingested through pipelines created in the other walkthroughs and deployed to the insights-demo database. Therefore, before you can create the queries in this walkthrough you must ensure the insights-demo database is created, as described here.
You must also build the pipelines to ingest the data. Details on these are provided on these pages:
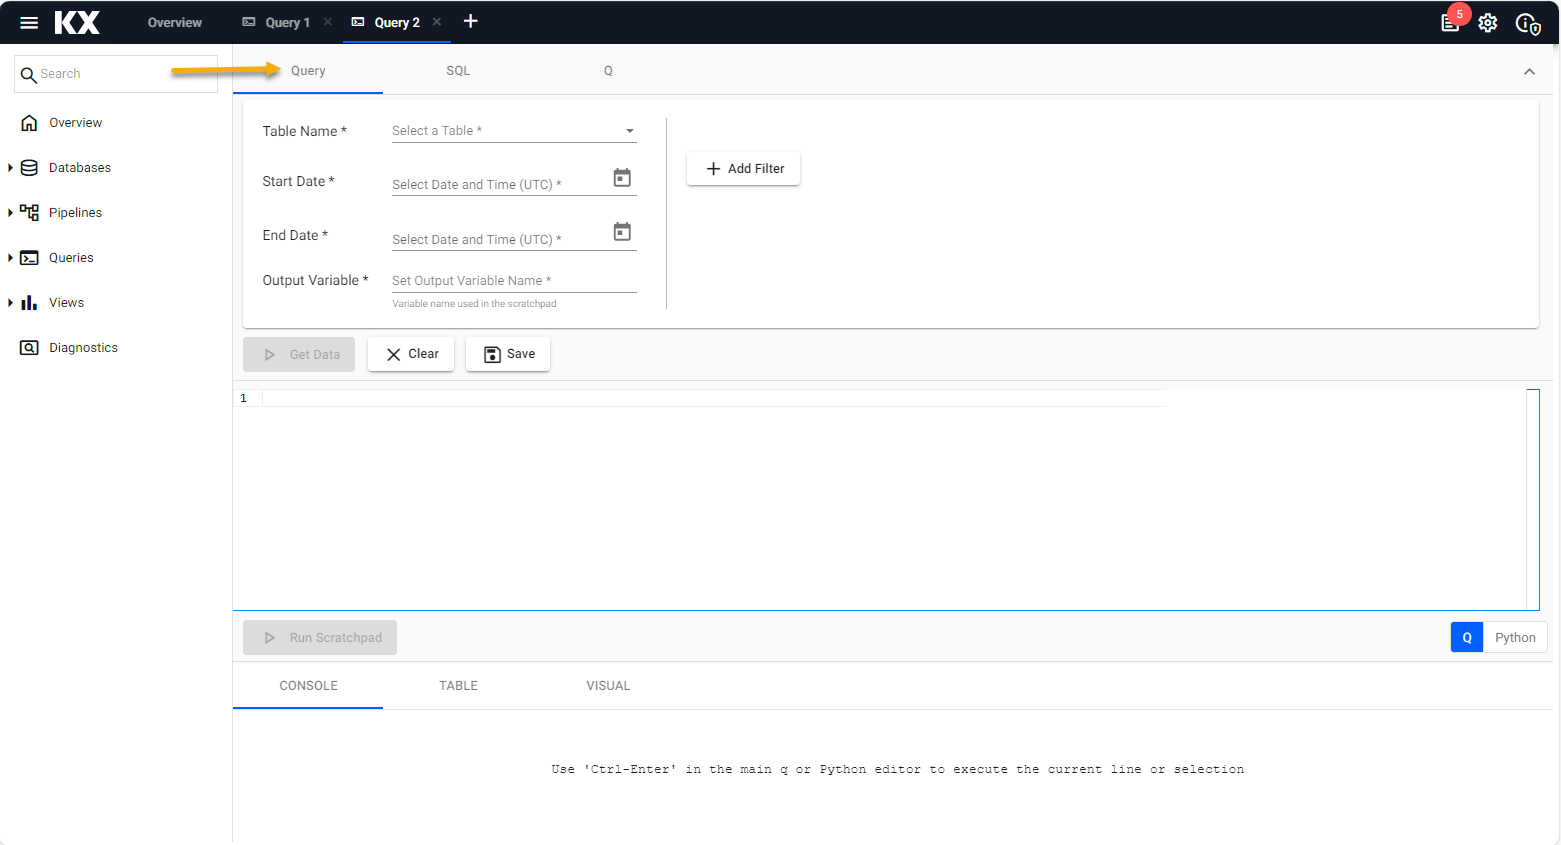
Use one of the following methods to access the Query screen:
- Click + on the ribbon menu
- Click + beside Query on the left-hand menu
- Click 3. Query on the Overview page.
![Open the query tab from the left-hand or ribbon menu by clicking [+], or from the Overview page.](img/query-new.png)
View Data
There is more than one method to query data from a database. We are going to start with the Query filter, shown below, as no coding experience is required for this. Click the SQL tab for details on how to run a query using SQL.
Query is the simplest way to explore your data.
-
Select one of the available tables; weather, crime, subway, health, taxi for the Table Name field.
-
Define the Start Date and End Date filters. The following table gives these dates for each of the walkthrough examples. Typically, the pipeline deployment date is the Start Date and End Date; for example, if you deployed a sample pipeline today, then the start and end date would be from midnight to 23:59 of today's date. The exceptions are the crime and weather data sets.
data table name output variable start date end date weather weather weather 2022-07-28T00:00:00.000000000 2022-07-28T23:59:00.000000000 crime crime crime 2022-03-31T00:00:00.000000000 2022-03-31T23:59:00.000000000 subway subway subway deployment date T00:00:00.000000000 deployment date T23:59:00.000000000 health health health deployment date T00:00:00.000000000 deployment date T23:59:00.000000000 taxi trips trips 2021-12-31T00:00:00.000000000 2021-12-31T23:59:00.000000000 -
The Output Variable is auto-assigned for each of the guided walkthrough examples, but this can be changed if required.
-
Click Get Data to return data.
If you want to query the data in the insight-demo database with SQL, enter one of the sql queries from the following table.
-
Type in the SQL below, replacing tablename with that table you wish to query.
select * from tablenamedata SQLqueryweather select * from weather crime select * from crime subway select * from subway health select * from health taxi select * from trips -
Define an Output Variable before getting data.

-
Click Get Data to return data.
-
To see the number of events generated in the subway pipeline:
select count(*) from subway
- If you want to query the data in the insight-demo database with Q, enter a query such as the following:
q
    select from weather
1. Select insights-demo from the list of Assemblies and select an instance.
-
Define an Output Variable before getting data.
-
Click Get Data to return data.

You always need to define an Output Variable as this is used for querying in the scratchpad and is valid for the current session.
Reserved keywords for Output variable names
Avoid naming pipelines with reserved keywords for SQL or q; e.g. table, as this results in an error on the query.
Scratchpad
You have the option to run additional data investigations in the Scratchpad with q or python. Scratchpad queries must reference the Output Variable defined in the previous section. For this walkthrough it is also the table name. For example, to focus on crimes committed in the Bronx, use the kdb+/q query:
select from crime where borough like "BRONX"
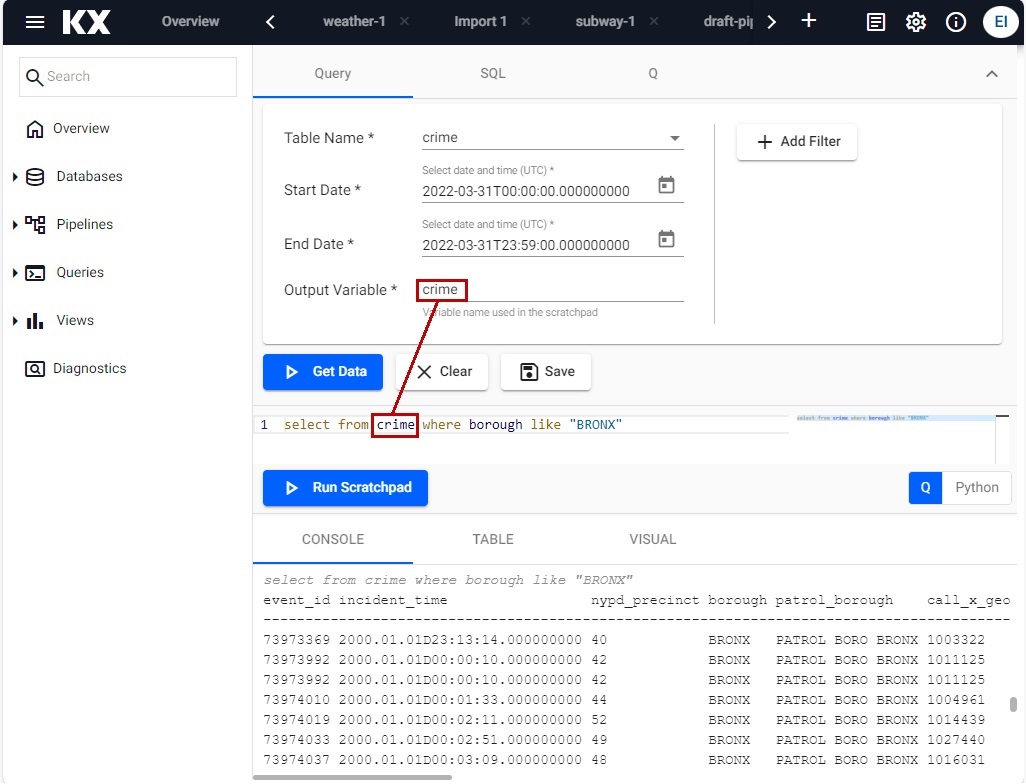
Click Run Scratchpad to return data.
If you are using python, only the first line of code is processed.
Note
"There is no requirement to use the Scratchpad to view data. The Scratchpad is for ad hoc analysis of the data and is done after Get Data is run."
Console, Table, Visuals
Once you have run queries either by clicking Get Data or Run Scratchpad the results are returned to lower portion of the screen in three tabs. Right-click inside the console window to clear results. For more information on each of these tabs see:
Note
The console shows results of the most recent query irrespective of the selected tab. When switching between tabs, re-run Get Data or Run Scratchpad to repopulate results for the selected tab.
Next Steps
- Go to View for details on how to visualize data.
Further Reading
Use the following links to learn more about specific topics mentioned in this page: