Licensing for self-managed deployments
The self-service licensing model previously in use for KX products has been deprecated. Contact your sales representative if you have questions about this, and wish to discuss moving to the new model.
The methods for auditing RAM capacity are described in the following sections:
Self-managed customers are required to run the reporting to gather max RAM capacity. To assist in this reporting, guidance below describes how to extract the RAM capacity for each target environment.
The scripts provided below are examples, and may need adaptation for your deployment environment, including where cgroups have been set up outside of the context of full orchestration.
Please refer to the links in this page for guidance and raise a ticket on the support portal for assistance in setting this up, if required.
Obligations for self-reporting customers on existing arrangements remain unchanged.
Physical Hosts/ Named VMs
The method used to extract your provisioned RAM depends on the operating system as described in the following examples.
Unix
Run free -m in a shell session and review the output. For example:
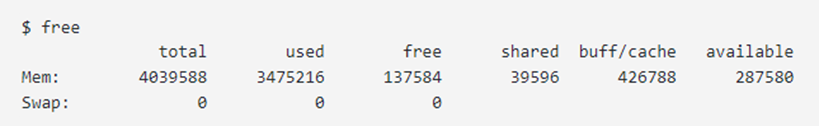
Record total as the provisioned RAM.
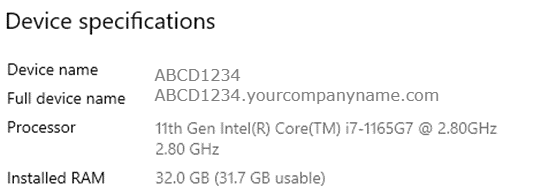
Windows
Access - Control Panel | System & Security | System | Installed RAM
Record Installed RAM as the provisioned RAM.
MacOS
Access - Activity Monitor | Memory | Physical Memory
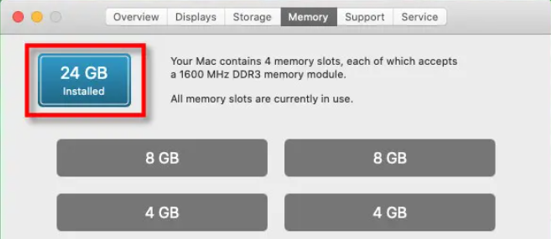
Record the RAM displayed as the provisioned RAM, in this example, 24GB.
Orchestrated environments
Overview
For Kubernetes and Docker orchestrated environments, the required information may be extracted using the sample script described below.
These are the prerequisites:
- jq and bc need to be installed
- uuidgen needs to be installed, to create a unique UUID for each run
- The running user must be able to run kubectl and/or docker exec, as this mode is used to access the RAM information
Orchestration method
RAM Capacity
- Max RAM usage (in bytes) is extracted from the pod’s cgroup metric
memory.max_usage_in_bytesin the case of cgroups version 1, andmemory.peakin the case of cgroups version 2.
Kubernetes
Using the example script below, the following information is gathered:
- RunId
- Date/Time
- Namespace
- Pod
- Container
- Max RAM (GiB)
Script
The owner of the cgroup must not be root in control group v2 implementations. The memory.peak value is not available if it is owned by root. Control Group v2.
The following script can be saved as extract-max-RAM-k8s-namespace.sh
#!/bin/bash
set -ue
NS=$(kubectl config view --minify -o jsonpath='{..namespace}')
SCALE=3
RUNID=$(uuidgen)
echo "RunId,Date/Time,Namespace,Pod,Container,Max RAM (GiB)"
for POD in $(kubectl get pods -n $NS --no-headers | grep "Running" | awk '{print $1}'); do
        for CONTAINER_IMAGE in $(kubectl get pods $POD -n $NS -o json | jq -r '.spec.containers[] | "\(.name)|\(.image)"'); do
                DATETIME=$(date '+%Y-%m-%d %H:%M:%S')
                CONTAINER="$(echo $CONTAINER_IMAGE | cut -d\| -f1)"
                if [[ "$(kubectl exec -it $POD -n $NS -c $CONTAINER -- stat -fc %T /sys/fs/cgroup/)" != "cgroup2fs" ]]; then
                   MAX_RAM_CGROUP="/sys/fs/cgroup/memory/memory.max_usage_in_bytes"
                else
                   MAX_RAM_CGROUP="/sys/fs/cgroup/memory.peak"
                fi
                RAM_MAX_USAGE_B="$(kubectl exec -it $POD -n $NS -c $CONTAINER -- cat $MAX_RAM_CGROUP | tr -d '\r')"
                RAM_MAX_USAGE_MiB=$(bc <<< "scale=$SCALE;($RAM_MAX_USAGE_B/(1024 * 1024))")
                RAM_MAX_USAGE_GiB=$(bc <<< "scale=$SCALE;($RAM_MAX_USAGE_MiB/1024)")
                echo "$RUNID,$DATETIME,$NS,$POD,$CONTAINER,$RAM_MAX_USAGE_GiB"
        done
done
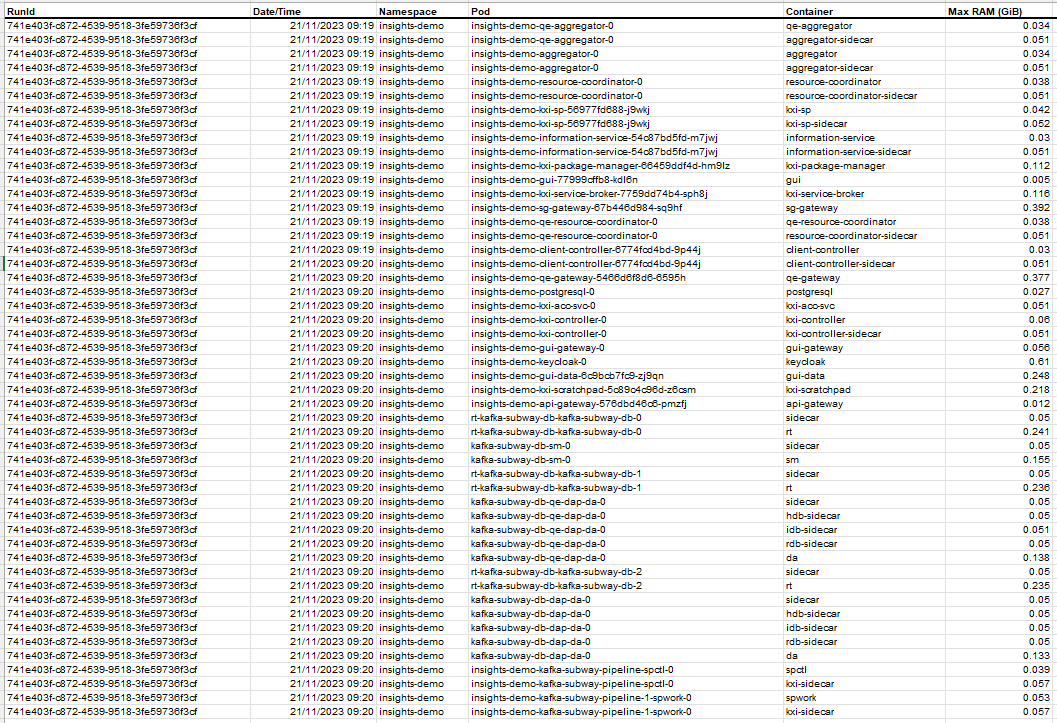
Output
The output produced is as follows:
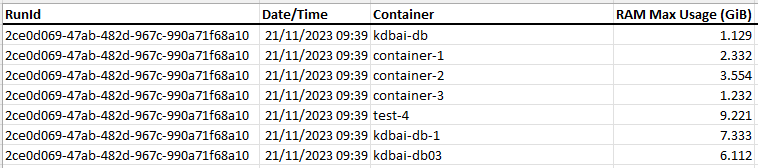
Docker
Using the script below the following information is gathered:
- RunId
- Date/Time
- Container
- Max RAM (GiB)
Script
The following script can be saved as extract-max-RAM-docker.sh
#!/bin/bash
set -eu
SCALE=3
RUNID=$(uuidgen)
echo "RunId,Date/Time,Container,RAM Max Usage (GiB)"
for CONTAINER in $(docker ps --format '{{.Names}}'); do
    DATETIME=$(date '+%Y-%m-%d %H:%M:%S')
    if [[ "$(docker exec -it $CONTAINER stat -fc %T /sys/fs/cgroup/)" != "cgroup2fs" ]]; then
        MAX_RAM_CGROUP="/sys/fs/cgroup/memory/memory.max_usage_in_bytes"
    else
        MAX_RAM_CGROUP="/sys/fs/cgroup/memory.peak"
    fi
    RAM_MAX_USAGE_B="$(docker exec -it $CONTAINER cat $MAX_RAM_CGROUP | tr -d '\r')"
    RAM_MAX_USAGE_MiB=$(bc <<< "scale=$SCALE;($RAM_MAX_USAGE_B/(1024 * 1024))")
    RAM_MAX_USAGE_GiB=$(bc <<< "scale=$SCALE;($RAM_MAX_USAGE_MiB/1024)")
    echo "$RUNID,$DATETIME,$CONTAINER,$RAM_MAX_USAGE_GiB"
done
Output
The output produced is as follows:
FinSpace
In order to generate the reports to audit RAM capacity for FinSpace deployments, refer to the following links and example report generation.
AWS Metrics
Retention Periods
Amazon CloudWatch retains metric data as follows:
- Data points with a period of less than 60 seconds are available for 3 hours. These data points are high-resolution metrics and are available only for custom metrics that have been defined with a StorageResolution of 1
- Data points with a period of 60 seconds (1-minute) are available for 15 days
- Data points with a period of 300 seconds (5-minute) are available for 63 days
- Data points with a period of 3600 seconds (1 hour) are available for 455 days (15 months)
For further detail refer to Get Metric Statistics in the Amazon Cloudwatch documentation.
Generate Report
There are two steps required to generate a report:
Generate TSV File
Use the following commands to generate a TSV file licensing.tsv, in your /tmp directory.
Remember to set kx_start and kx_end variables to the correct dates for your reporting window.
#!/bin/bash
export kx_metric="MemoryUsageBytes"
export kx_start="2024-06-23T00:00:00"
export kx_end="2024-06-24T00:00:00"
export kx_period="300"
export kx_licfile="/tmp/licensing.tsv"
rm -f $kx_licfile
for cluster in $(aws cloudwatch list-metrics --namespace AWS/FinSpace --metric-name $kx_metric | jq '.Metrics[].Dimensions[] | select(.Name == "KxClusterId") | .Value'); do echo Running for $cluster ; echo $(aws cloudwatch get-metric-statistics --metric-name MemoryUsageBytes --start-time $kx_start --end-time $kx_end --period $kx_period --namespace AWS/FinSpace --statistics Average --dimensions Name="KxClusterId",Value=$cluster | jq -r --arg cluster $cluster '.Datapoints[] | [$cluster, .Timestamp, .Average, .Unit] | @tsv' >> $kx_licfile); done
Process TSV file
The following q commands process this TSV file into a format that can be saved and shared back to KX.
q)system"c 500 500"
q)period:0D00:00:01*"I"$getenv`kx_period
q)report:`ts xasc flip `cluster`ts`val`unit!("SPJS";"\t") 0: hsym`$getenv`kx_licfile
q)aggregate:select totalGB:(sum val)%1e9 by period xbar ts from report
q)aggregate

ts                           | totalGB
-----------------------------| -----------
2024.06.23D00:00:00.000000000| 42.35248
2024.06.23D00:05:00.000000000| 42.35249
2024.06.23D00:10:00.000000000| 42.35249
2024.06.23D00:15:00.000000000| 42.35249
2024.06.23D00:20:00.000000000| 42.35249
2024.06.23D00:25:00.000000000| 42.35249
2024.06.23D00:30:00.000000000| 42.3525
2024.06.23D00:35:00.000000000| 42.3525
2024.06.23D00:40:00.000000000| 42.35251
2024.06.23D00:45:00.000000000| 42.35251
2024.06.23D00:50:00.000000000| 42.35251
2024.06.23D00:55:00.000000000| 42.35251
2024.06.23D01:00:00.000000000| 42.35251
...

q)summary:select avg totalGB by 0D01 xbar ts from aggregate
q)summary
ts                           | totalGB
-----------------------------| -----------
2024.06.23D00:00:00.000000000| 42.3525
2024.06.23D01:00:00.000000000| 42.35253
2024.06.23D02:00:00.000000000| 42.35256
2024.06.23D03:00:00.000000000| 42.3526
2024.06.23D04:00:00.000000000| 42.35263
2024.06.23D05:00:00.000000000| 42.35266
2024.06.23D06:00:00.000000000| 42.35269
2024.06.23D07:00:00.000000000| 42.35273
2024.06.23D08:00:00.000000000| 42.35276
2024.06.23D09:00:00.000000000| 42.35279
2024.06.23D10:00:00.000000000| 42.35282
2024.06.23D11:00:00.000000000| 42.35286
2024.06.23D12:00:00.000000000| 42.35149
2024.06.23D13:00:00.000000000| 0.002702809
2024.06.23D14:00:00.000000000| 7.194445
2024.06.23D15:00:00.000000000| 0.0126699
2024.06.23D18:00:00.000000000| 0.002735492
...
summary_output_path:"/home/<your output path>/"
save `$summary_output_path,"summary.csv";
This CSV can now be shared with KX to report on FinSpace usage.