Build Dashboard
Let's get started!
In order to make use of the data that has been ingested, KX wants to help all users with a brief guide to building visualizations in KX Insights Platform. These guides only touch on what dashboards can be built but we hope this will help with the initial stumbling points.
Creating a New Report

-
Start by selecting the report icon in the bottom of the left and pane
-
From there we can select
+ NEWto create a new Report screen -
This will open a new report screen, from here you can toggle the design mode which allows you to drag and drop widgets in the view
-
When you drag and drop a widget you will be presented with the below dialogue box Click to populate Data source
-
From here, select
newto create a new node, define the expression in the node, execute to test the output, and finally save the node definition. Change the following parameters to see an example output:- Enter the table name (weather is used as an example)
- Set a start and end date, typically
T-1toTfor previous day's data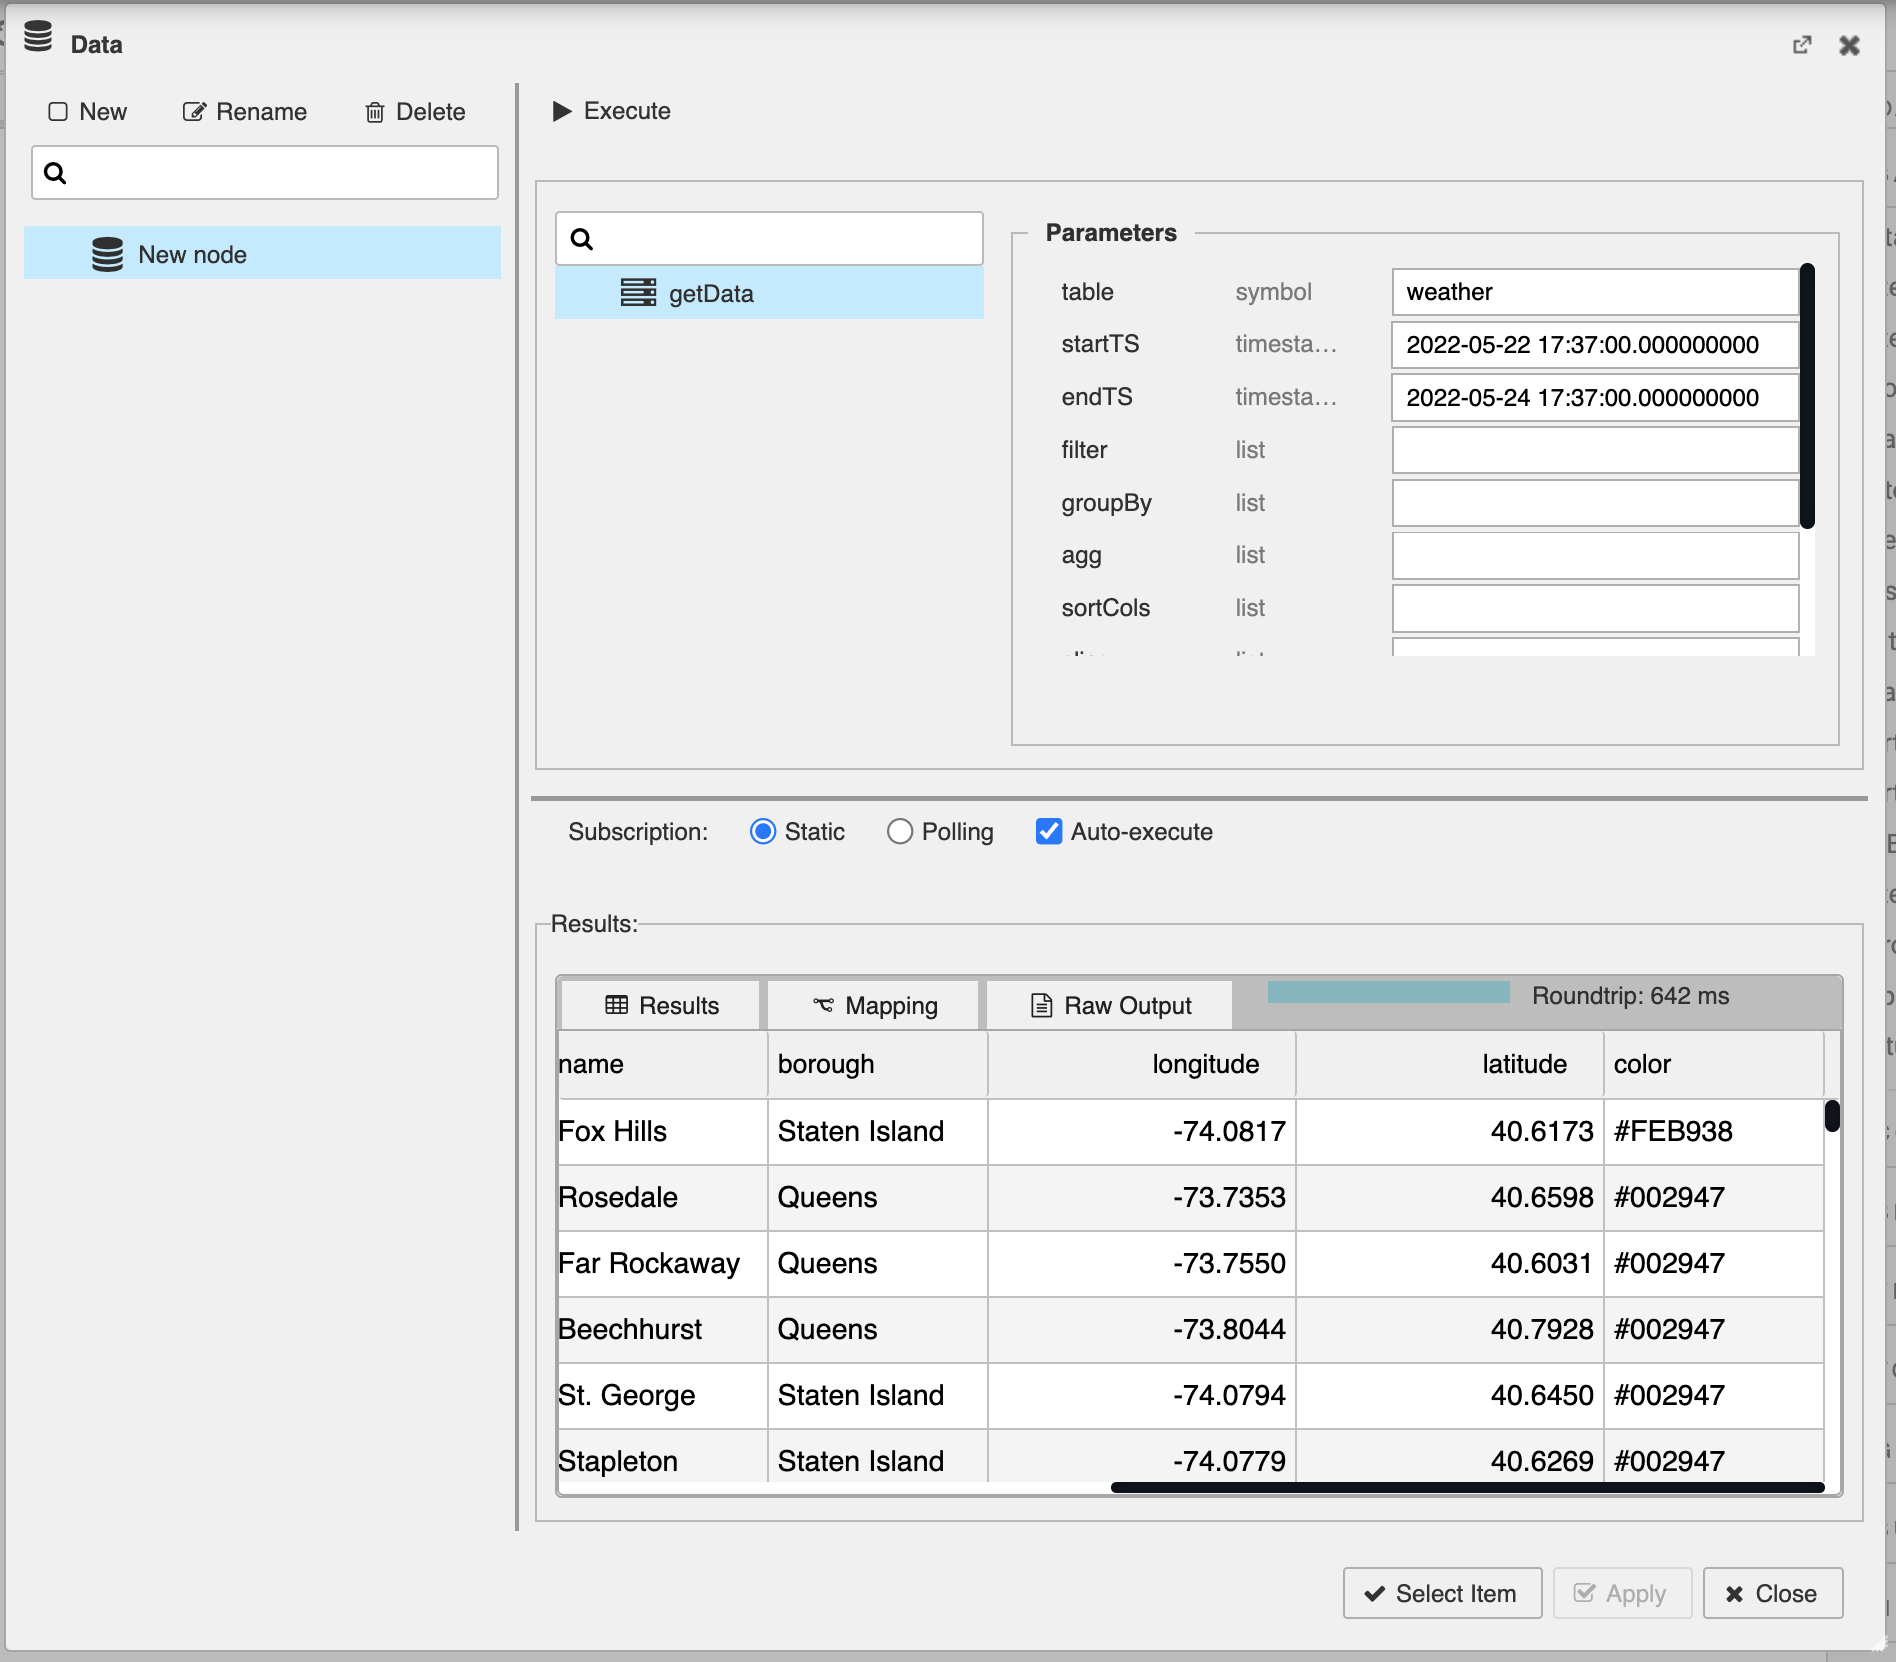
Remember to
Click apply to save the expression to the node
Click Select Item to connect new node to widget
After this you should see your widget populated with data, from here you can toggle the preview mode to interact with the widget
Tada! Your widget is complete! But please look at other guides to help you build even more to your report!
Next Steps
You may notice some longitude and latitude data in the result set above - let's try to visualize some of this geographic data in a map.