Protocol Buffer (Crime)
No kdb+ knowledge required
This example assumes no prior experience with q/kdb+ and you can replace the endpoints provided with any other Protocol Buffer endpoint to gain similar results.
What are protocol buffers?
Protocol buffers are Google's language-neutral, platform-neutral, extensible mechanism for serializing structured data – think XML, but smaller, faster, and simpler. You define how you want your data to be structured once, then you can use special generated source code to easily write and read structured data to and from a variety of data streams using a variety of languages. More documentation can be found here.
More information on protocol buffers and how they work with the KX Insights Platform can be found here
Crime Dataset
The KX Insights Platform helps users easily decode Protocol Buffer data natively, the Evangelism team has provided a crime dataset hosted on our documentation site code.kx.com. The dataset contains crime events occurring in NYC with details such as which precinct the event was recorded in, location coordinates of the call, dispatch times and description of the crime.
This file is a protocol buffer file and so has an associated crime.proto file. This is provided in the decoding section below.
Ingesting Data
The following is a guide to help users pull data from a Protocol Buffer same day feed. Using a proto config users can decode messages to kdb messages.
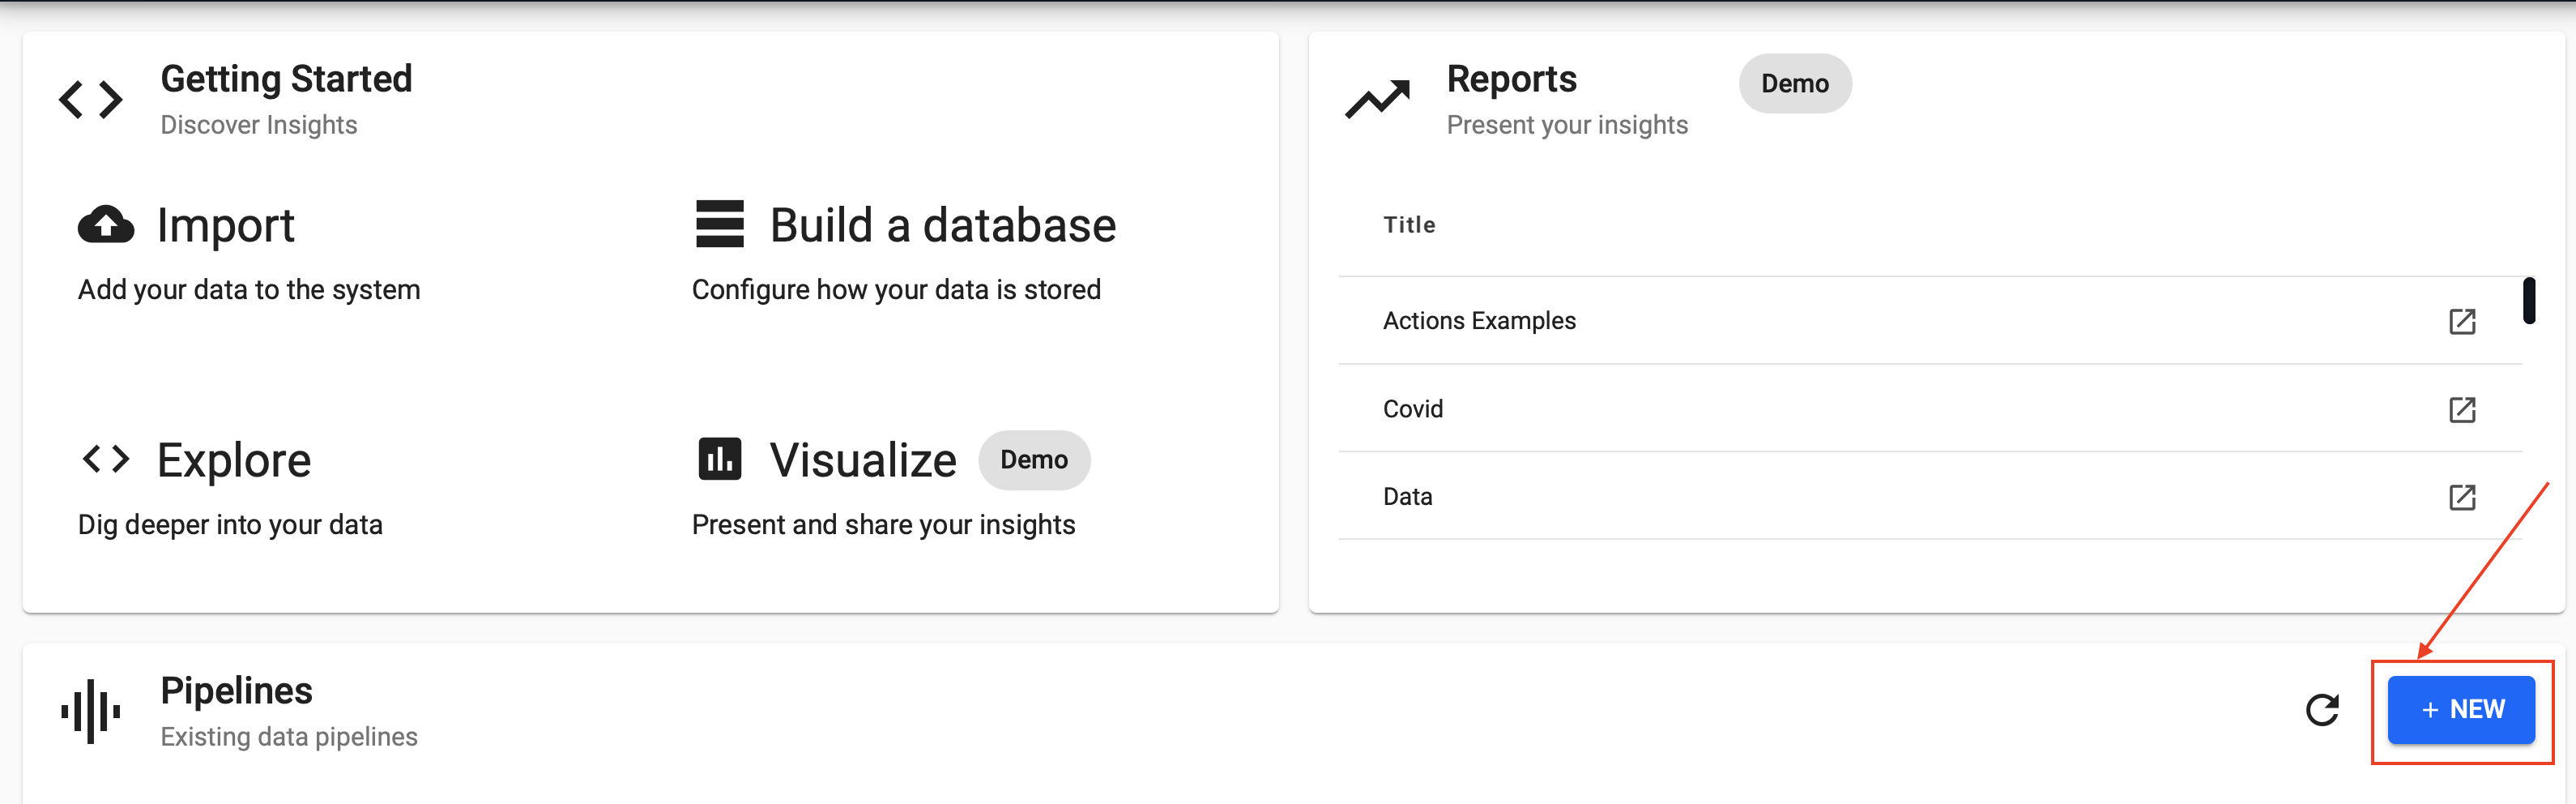
In the previous examples we have used the Import Wizard to load in new data. You can also create a new pipeline from scratch, let's use this example to show you how.
Importing
Select New from the Overview panel to start the process of loading in new data. This should open a new empty pipeline.
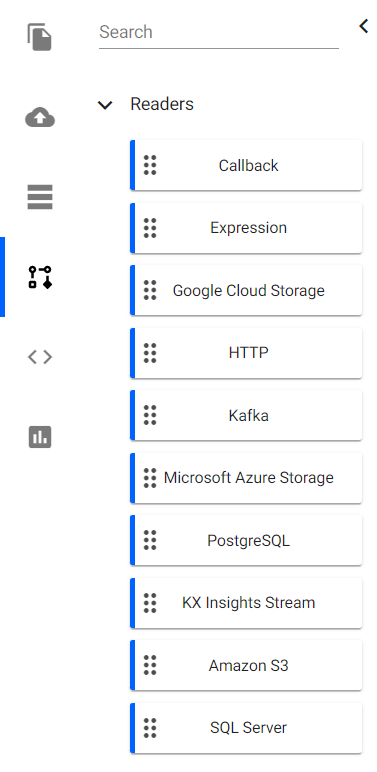
Using the left-hand entity tree, expand Readers and drag and drop the kdb+ Expression node and enter the details to connect to the datasource.
Here you are going to take advantage of native REST interfacing functionality in the KX Insights Platform using .kurl.sync.
URL:"https://code.kx.com/kxiwalkthrough/data/crime.msg";
resp:.kurl.sync[(URL;`GET;(::))];
if[200 <> first resp; ' last resp];
"\n" vs last respDecoding
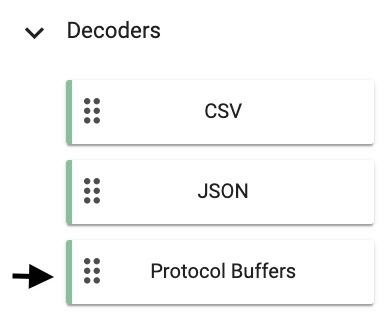
The output of last resp will resemble a binary format without decoding. Drag and drop the Protocol Buffers node from Decoders.
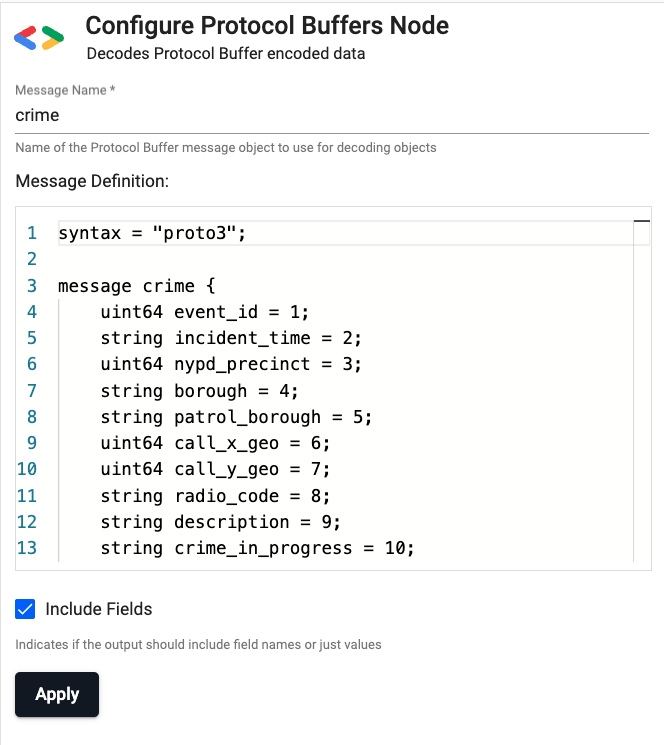
In order to decode the message from binary to kdb+ two values must be supplied in the Decoder node:
1) Message Name: crime
2) Message Definition:
syntax = "proto3";

message crime {
    uint64 event_id = 1;
    string incident_time = 2;
    uint64 nypd_precinct = 3;
    string borough = 4;
    string patrol_borough = 5;
    uint64 call_x_geo = 6;
    uint64 call_y_geo = 7;
    string radio_code = 8;
    string description = 9;
    string crime_in_progress = 10;
    string call_timestamp = 11;
    string dispatch_timestamp = 12;
    string arrival_timestamp = 13;
    string closing_timestamp = 14;
    double latitude = 15;
    double longitude = 16;
}
Transforming
Additional Functions
For readability additional nodes can be added to continue transforming the data, and moreover, if functions are predefined the name of the function can be provided here to improve reusability.
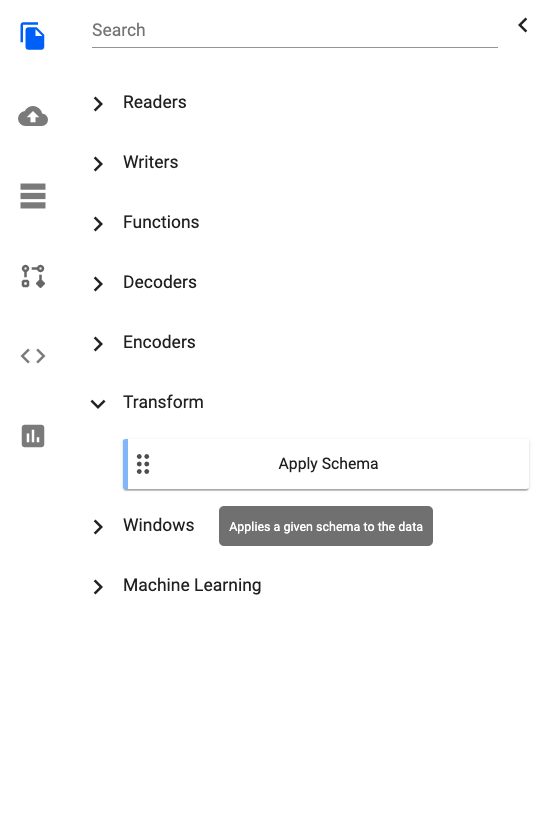
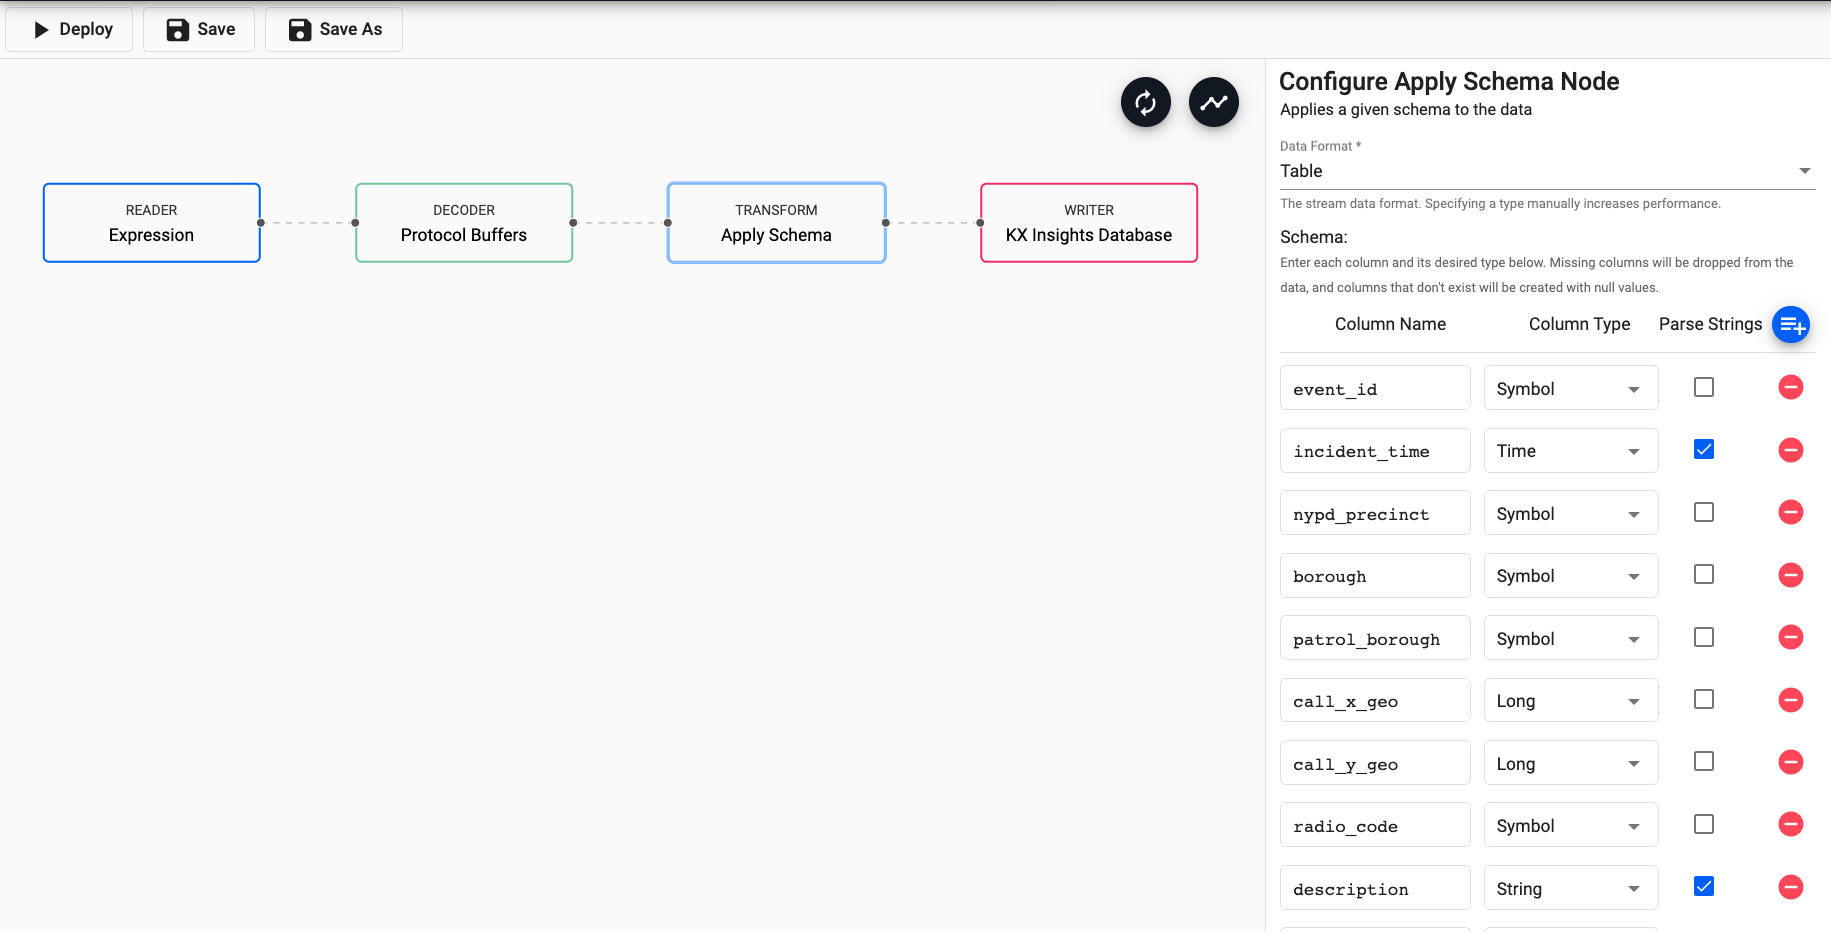
Drag and drop Apply Schema from the Transform section. This is a useful tool that transforms the upstream data to the correct datatype of the destination database.
Select Data Format as Table from the dropdown.
Next, click on the blue + icon next to Parse Strings and you should be presented with the Load Schema popup.
Select insights-demo database and crime table from the dropdown and select Load.
For any fields of type time, timestamp and string check the box that says Parse Strings.
Parse
This indicates whether parsing of input string data into other datatypes is required. Generally for all time, timestamp, string fields you should have Parse Strings ticked unless your input is IPC or RT.
Finally, drag and drop Writer node for KX Insights Database and from the dropdown select the insights-demo database and the crime table to write this data to.
As you have created your own pipeline manually, you must add in your own edges. Edges are used to connect nodes and are applied by clicking and dragging from one node to the next until a line appears showing a connection.
Deploying
Next you can Save your pipeline, and finally you can select Deploy.
Once deployed you can check on the progress of your pipeline in the Overview pane. When it reaches Status=Running, the pipeline has deployed and your data should be queryable.
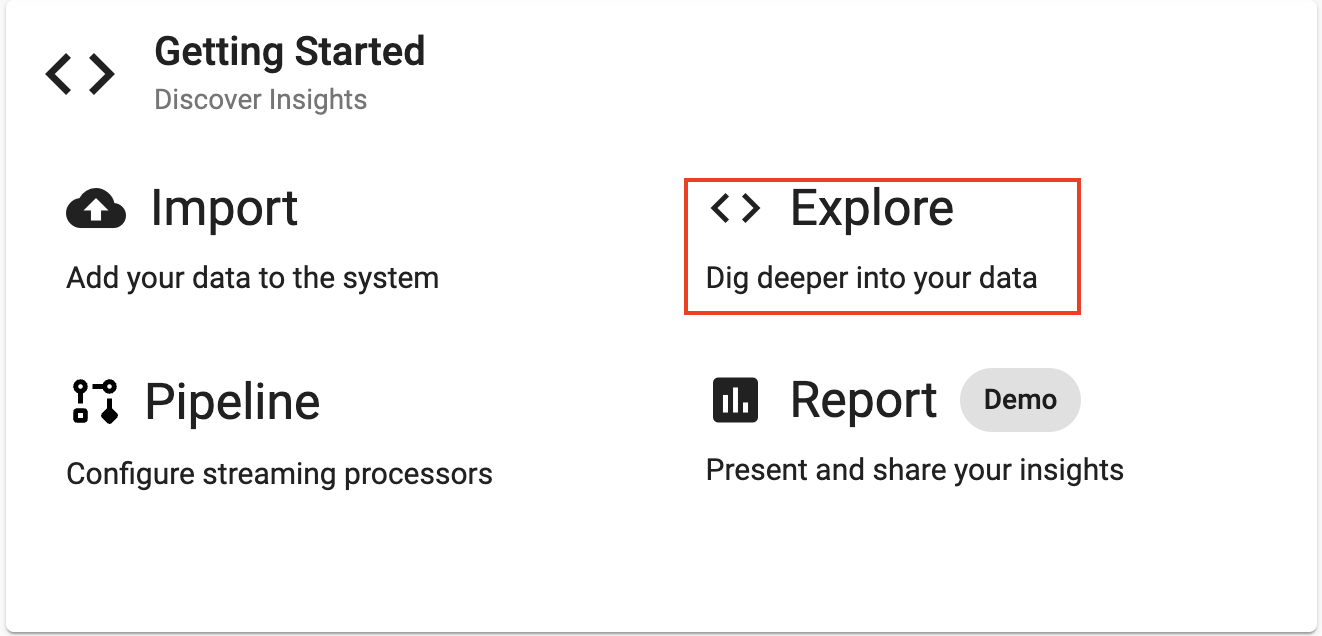
Exploring
Select Explore from the Overview panel to start the process of exploring your loaded data.
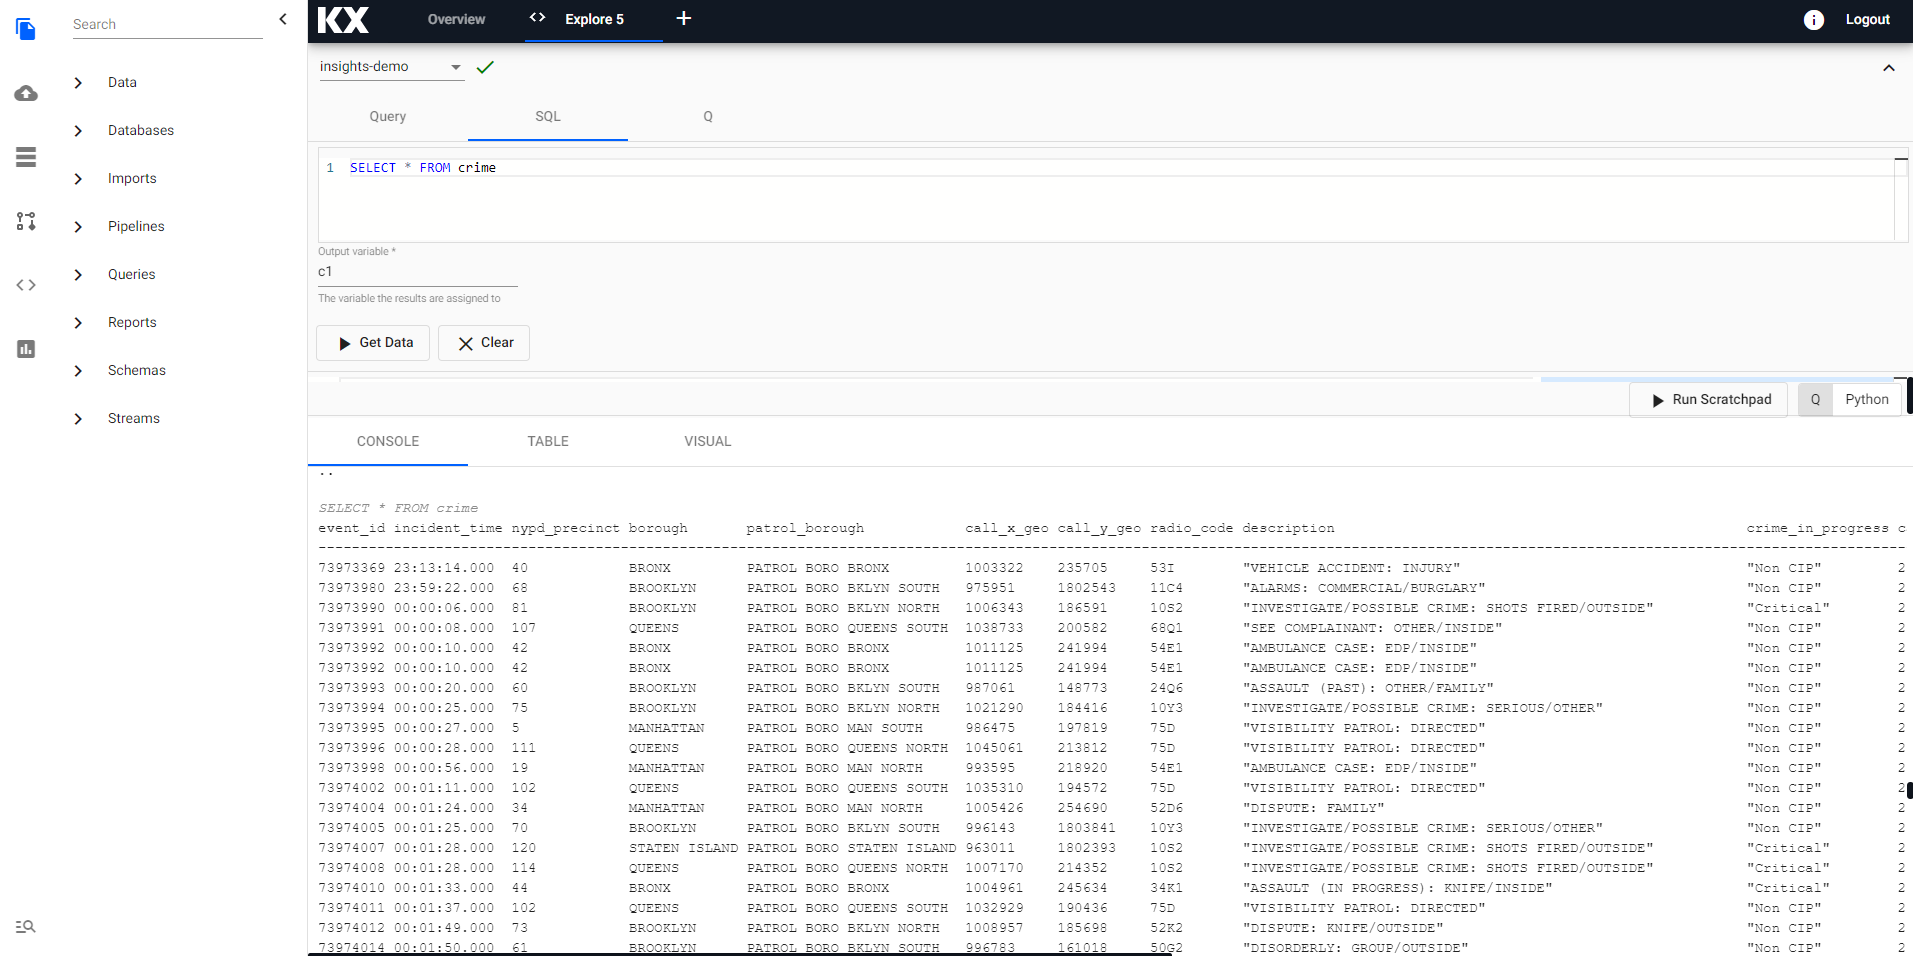
First, select insights-demo from the assembly dropdown on the top left hand side.
In the Explore tab there are a few different options available to you, Query, SQL and q. Let's look at SQL. You can run the following SQL to retrieve all records from the crime table.
SELECT * FROM crimeNote that you will need to define an Output Variable and then select Get Data to execute the query. You should see the output below.
Refresh Browser
If the database or tables are not appearing in the Explore tab as expected - it is a good idea to refresh your browser and retry.
Troubleshooting
If the database or tables are still not outputting after refreshing your browser, try our Troubleshooting page.
Next let's visualize some data on a Report to better understand it. Head over the Reports to get started.