Data sources
A data source is used to retrieve data from connected databases for use by dashboard components. Data sources are edited using the Data Dialog.
-
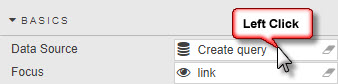
The Data Dialog is opened by clicking a component’s Data Source property.
-
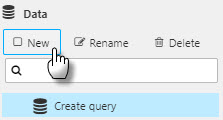
Click New to create a new data source. Name it.
-
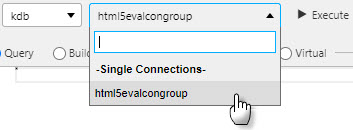
Pick its connection or connection group.
-
Select from:
SQL and enter SQL query text, or
kdb+/q and enter kdb+/q query text, or
Builder to build a query using input nodes, or
Virtual to build a query using javascript, or Streaming to build a real-time streaming query, or Analytic and pick from a pre-defined list of functions -
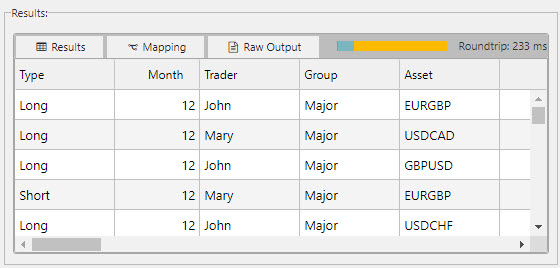
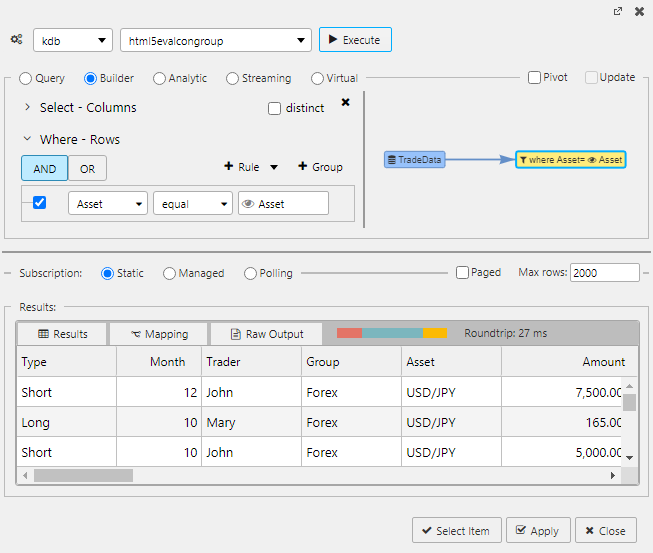
Click Execute to preview, success will populate the Results table or display an error.
Performance metrics are also displayed to indicate query performance.Results
-
Finally, Click Apply to keep the changes made to the data source and/or Select to choose the selected data source for the component property.
SQL
String queries use text-based SQL to query data from the database.
SELECT * FROM FXTradeData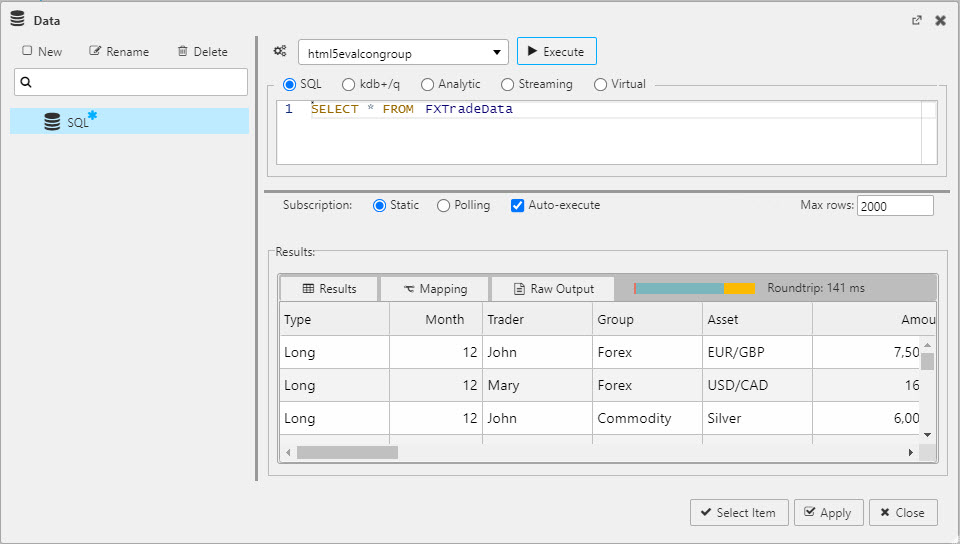
Simple SQL query
will return all column data in FXTradeData from the html5evalcongroup connection.
Available if SQL is supported on the target q process via s.k_
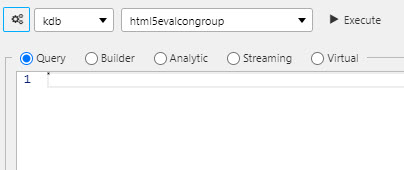
Query
String queries use text-based q to query data from the database.
FXTradeData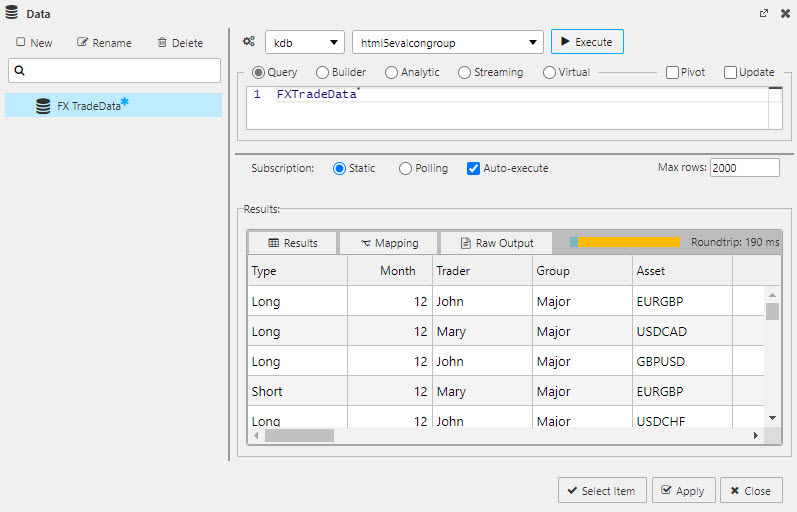 Simple q query
will return all column data in FXTradeData from the html5evalcongroup connection.
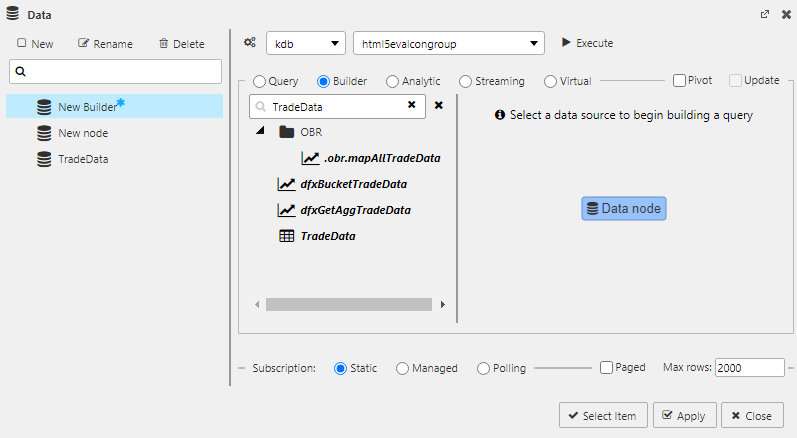
Builder
Visual queries allow dashboard users with no programming experience to build queries using a range of configurable dialogs.
-
Select Builder; it may be easier to expand the editor to full screen mode
 .
. -
Select Data node in the menu of available data sources
-
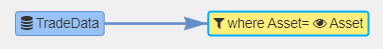
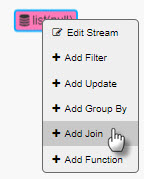
Right-click on an existing node to add a filter, update, group-by, function, or perform a join.
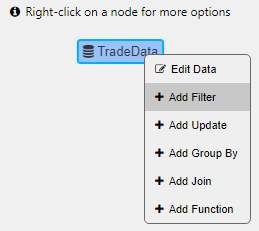
-
Each node-type displays its own unique dialog used to define the query.
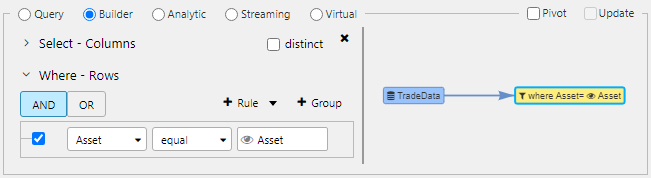
Use a data filter to build a where clause with the option to add view state parameters.
-
Queries can be linked to view state parameters. E.g., the filter node below has a where clause that filters for items equal to the view state parameter "Asset."
-
Execute - Apply - Select
For more on building visual queries
Streaming query
Static and real-time data can be combined where data shares the same node. The following example connects static fundamental data for equities to streaming equity prices, using the ticker symbol as a join between the data sets. This data is available in Kx Dashboards.
-
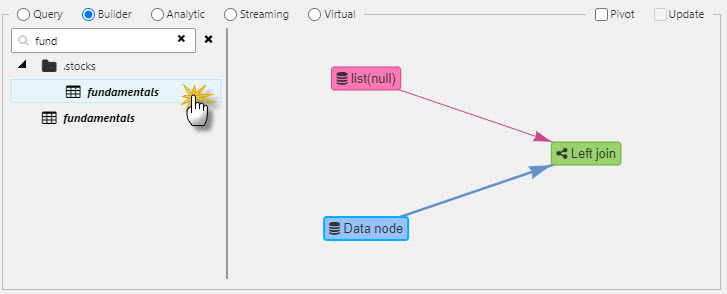
In Builder, search and select the streaming data source, list. The parameter x can be left unassigned as this will be handled by the join.
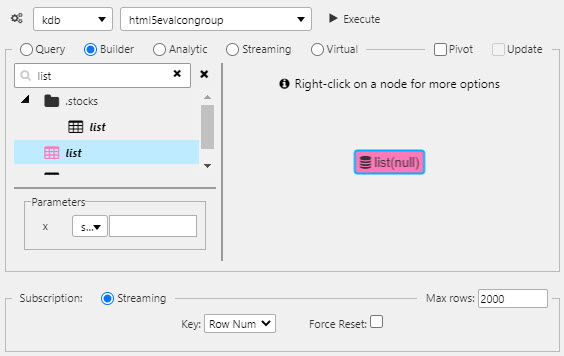
Streaming vs static data
In Data Editor, streaming data sources have a colored icon, static data sources are black.
-
Right-click on list node to Add Join
-
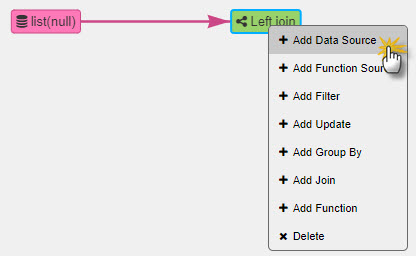
For the join node, right-click to Add Data Source and select fundamentals from the Stocks folder. This is a static data source of stock fundamentals.
-
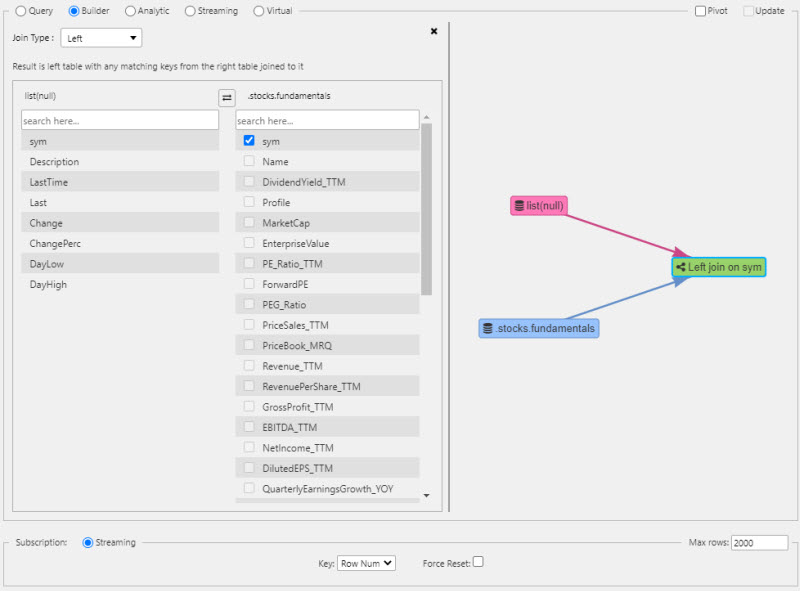
Define how the data sources are connected. There has to be a common key between each data source to create the join, in this case, "sym". Edit Join and check the key which connects the two data sources; only shared keys are selectable. A left join will add content matched by the key from the right table, to the left table.
-
Execute the query
Analytic
Analytics are pre-defined functions with required input parameters exposed in the dashboard.
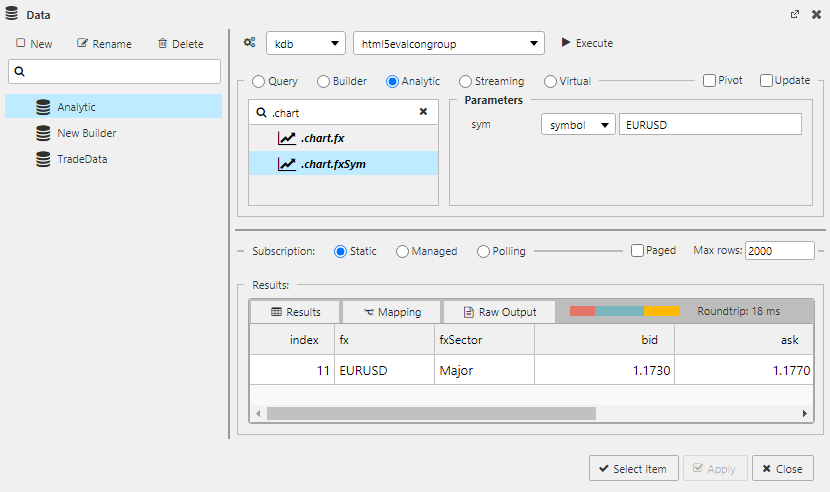 Sample Analytic
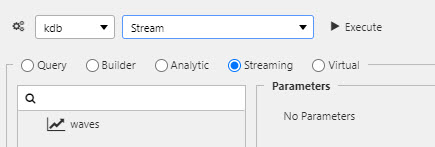
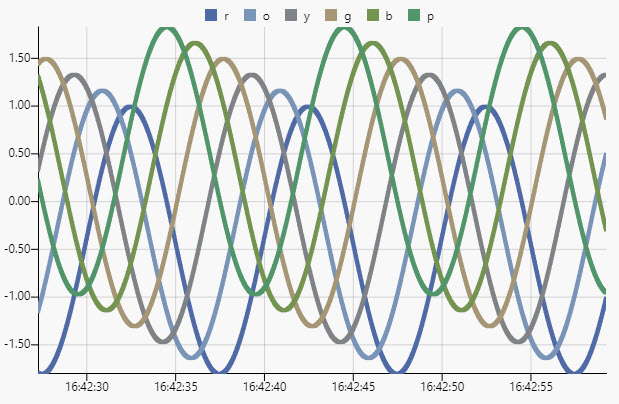
Streaming
Build a streaming, time series data set to display in a chart at 60 fps.
- Create a streaming q process on an assigned port; for example,
stream.qon port 6814:
C:\User\Desktop\Direct\sample>q stream.q -p 6814
stream.quses a sinewave to generate sample data over time:
/ define stream schema
waves:([]time:`timestamp$(); r:`float$(); o:`float$(); y:`float$(); g:`float$(); b:`float$(); p:`float$());

/ load and initialize kdb+tick
/ all tables in the top level namespace (`.) become publish-able
\l tick/u.q
.u.init[];

/ sinwave
/ t, scalar t represents position along a single line
/ a, amplitude, the peak deviation of the function from zero
/ f, ordinary frequency, the number of oscillations (cycles) that occur each second of time
/ phase, specifies (in radians) where in its cycle the oscillation is at t = 0
.math.pi:acos -1;
.math.sineWave:{[t;a;f;phase] a * sin[phase+2*.math.pi*f*t] }

/ publish stream updates
.z.ts:{ .u.pub[`waves;enlist `time`r`o`y`g`b`p!(.z.p,{.math.sineWave[.z.p;1.4;1e-10f;x]-0.4+x%6} each til 6)] }
.u.snap:{waves} // reqd. by dashboards

\t 16

// ring buffer write in a loop
.ringBuffer.read:{[t;i] $[i<=count t; i#t;i rotate t] }
.ringBuffer.write:{[t;r;i] @[t;(i mod count value t)+til 1;:;r];}

// cache updates for the snapshot
.stream.i:0-1;
.stream.waves:20000#waves;

// generate and save new record to buffer
.stream.wavesGen:{
    res: enlist `time`r`o`y`g`b`p!(.z.p,{(x%6)+.math.sineWave[.z.p;1.4;1e-10f;x] - 0.4} each til 6);
    .ringBuffer.write[`.stream.waves;res;.stream.i+:1];
    res
 }

/ generate & publish waves
.z.ts:{ .u.pub[`waves;.stream.wavesGen[]] }

// implement snapshot function
.u.snap:{[x] .ringBuffer.read[.stream.waves;.stream.i] }- Create a data connection in dashboards to the streaming process on the selected port
- Select the data source, keyed by
time.
Virtual
Virtual queries are built using Javascript and utilize data pre-loaded to the client; assigned data sources in a virtual query do not re-query the database.
Virtual queries can meld data from more than one data source, view state parameter or text insert.
function(source, viewstate, text, callback) {

   var result = {
        "columns": [
            "Data Source",
            "View State",
            "Text"
        ],
        "meta": {
            "Data Source": 9,
            "View State": 11,
            "Text": 11
        },
        "rows":[]
    }

    result.rows= _.map(source.rows, function(row) {
        return {
            "Data Source": row.Month,
            "View State": viewstate,
            "Text": text
        };
    });

    callback(result);
}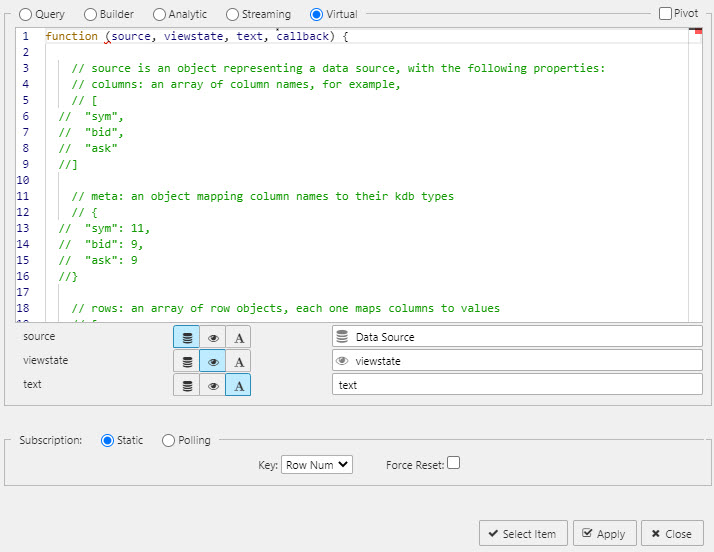
In the aforementioned example, data from the Month column is returned from the New Node data source. Substituting row.columnname; e.g. row.Return would return the values from the Return column in the parent data source.
The meta definitions are the kdb datatypes for each column where "columns" are the names of your table headers.
Lodash for more on supported functions.
Subscription
Static
Default setting. Single request for data
Polling
A client-side poll of the database; this is a direct client request to the database. Server paging can be enabled to limit the amount of data returned to the dashboard.
| option | effect |
|---|---|
| Interval | Time between client poll request |
| Key | Select which data source column to define Subscription handling; e.g. to have continual or static update |
| Force Reset | By default, for updating data sources Dashboards merges updates from the server with its existing dataset, unless a parameter is changed in which case the existing dataset is cleared. Enabling Force Reset will clear the existing dataset each time it receives an update, regardless of whether a parameter has changed or not. |
Check paged if server paging is enabled; only data viewable in the dashboard is loaded when server paging is enabled. Each change of page is treated as a new request for data. In the absence of server paging, a query will return all data from the database to the dashboard, with any required paging then organized client-side.
Streaming
Streaming subscriptions push data to the dashboard in place of a client or server-side poll.
Auto-execute

True by default. When auto-execute is true, the data source will automatically execute whenever an input parameter is changed or on load if mapping is used.
When auto-execute is false, subsequent parameter changes won't execute the query. However, it will still execute normally if associated to a component, e.g., a data grid on load, or as an action tied to a button.
Max Rows
Default is 2,000 rows of data for any subscription type.
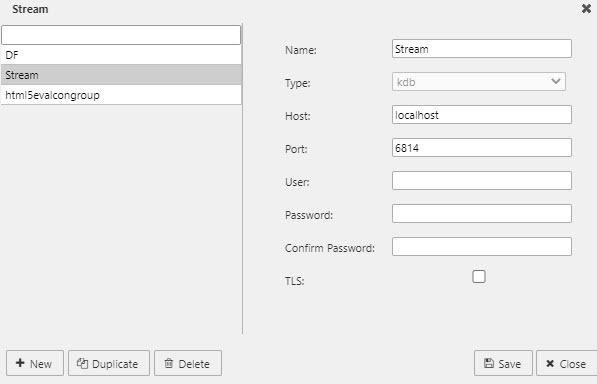
Connections
The connection manager can be opened from the Query Editor.
Individual connection
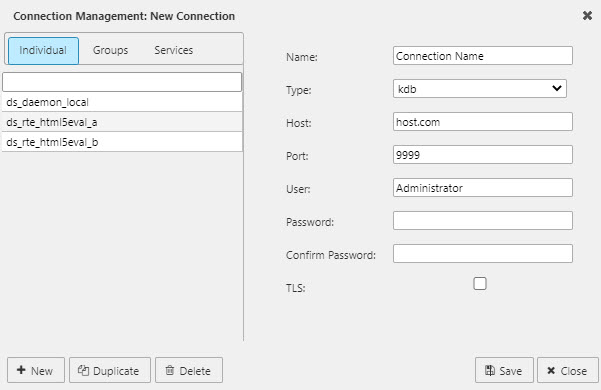
A connection has the following properties:
- Name
- Type
- Host
- Port
- Credentials: user and password
Host can be the server name or IP address.
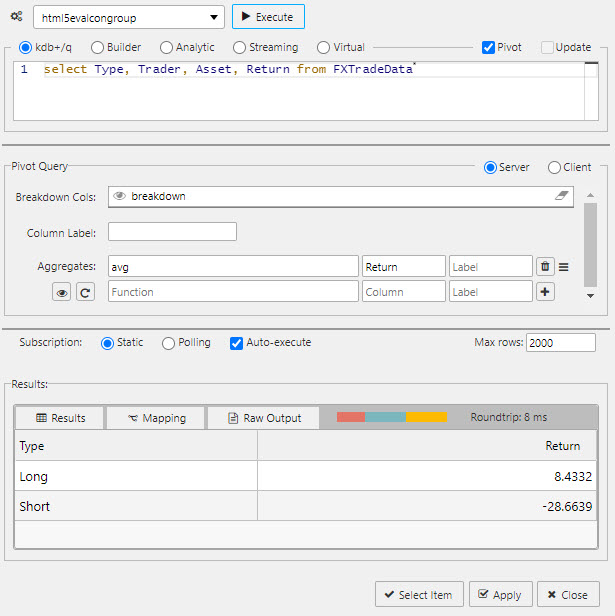
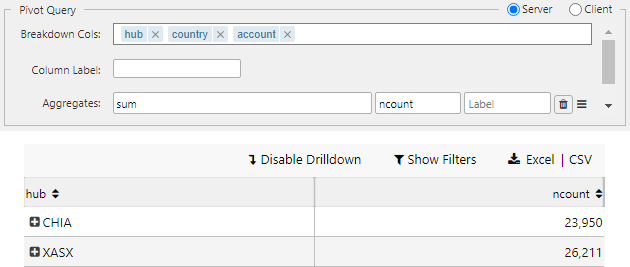
Pivot query
Pivot queries are used by the Pivot Grid component.
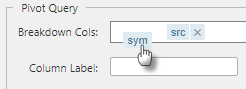
Pivot data are split between independent variables (Breakdown Cols) and dependent variables (Aggregates).
 A pivot query
Case-sensitive names
Names for Breakdown Cols and Aggregates are case-sensitive. If an error occurs, check that column-header names in source database match those used in dashboards.
The order of the Breakdown Cols can be changed using drag-and-drop
Client pivot
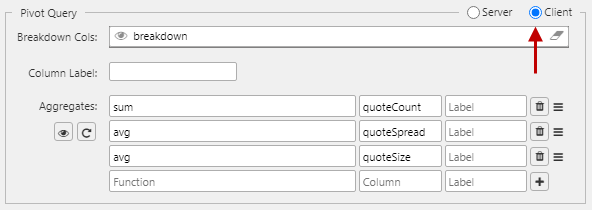
In a server pivot the data request is processed server-side and only viewed data is returned to the dashboard; each pivot interaction creates a fresh server-side request. A client pivot requests that all data on dashboard load, and processes all pivot interactions on the client.
For large data sets, the server pivot should be used. For smaller data sets, a client pivot will be faster
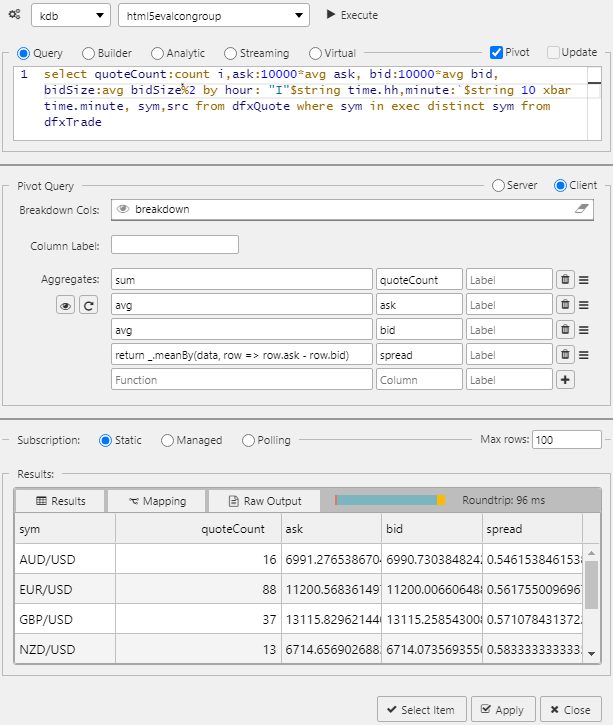
Custom binary analytics and client pivots
As a client pivot is not making a server request for data, custom binary analytics Aggregate functions using q will not operate. Use Javascript functions to build custom binary analytics Aggregate functions for client pivots.
Example of a multi-column client pivot
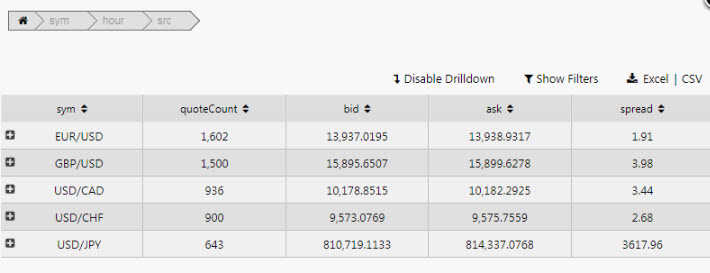
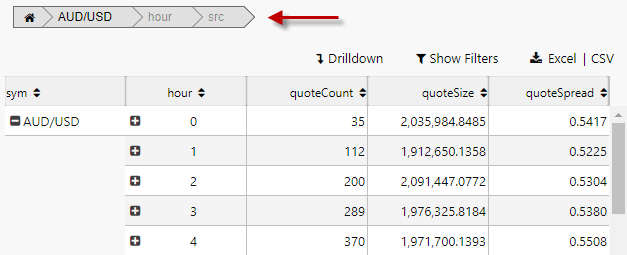
Pivot breakdown via breadcrumbs
The order of the pivot breakdown can also be controlled by the dashboard user, with the Breadcrumbs component.
-
Create a View State Parameter (say,
breakdown) and associate it with the Breakdown property in the Breadcrumbs component’s Settings.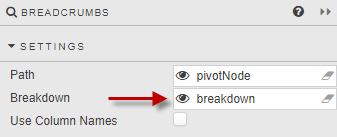
-
In the linked pivot query, set the Breakdown Cols to the
breakdownView State Parameter.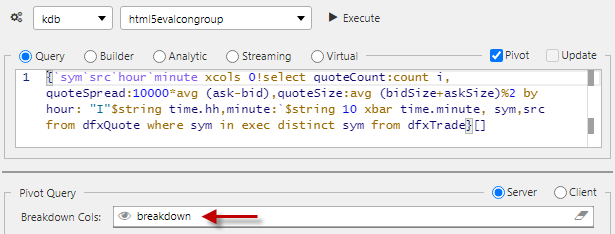
-
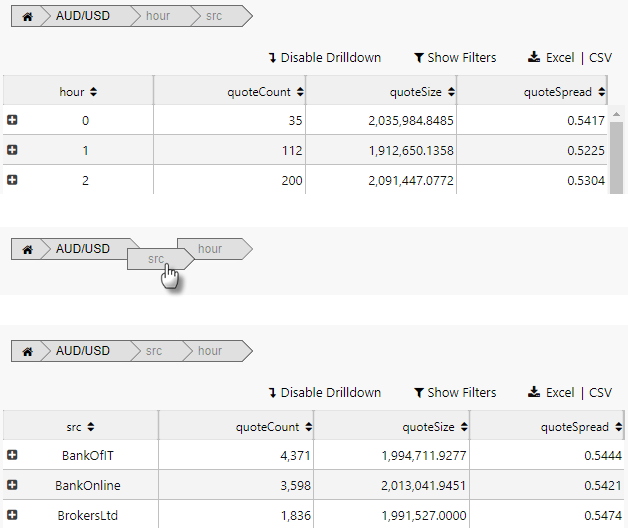
The resulting output shows the breakdown elements laid out in the Breadcrumb component. These can be dragged and repositioned to change the pivot order.
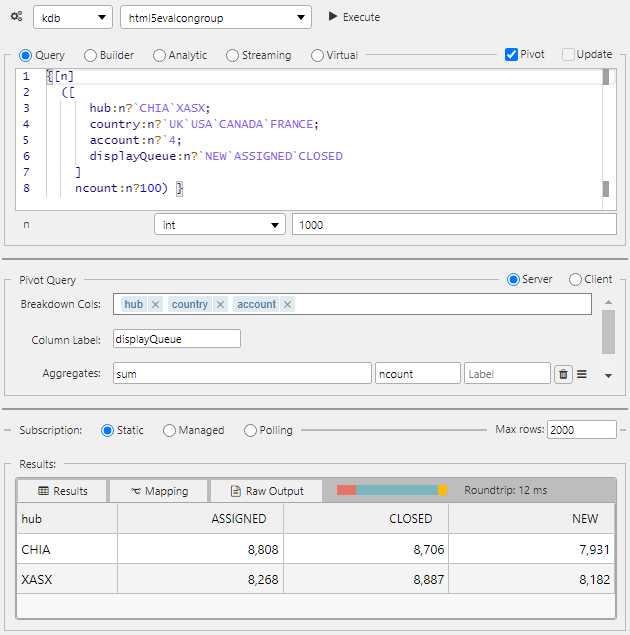
Column label
A two-dimensional pivot query:
{[n]
  ([
      hub:n?`CHIA`XASX;
      country:n?`UK`USA`CANADA`FRANCE;
      account:n?`4;
      displayQueue:n?`NEW`ASSIGNED`CLOSED
    ]
ncount:n?100) }- Standard Pivot
- 2D Pivot
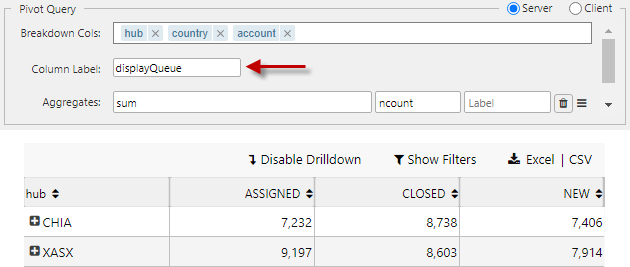
Column Label is used to support 2-dimensional pivots. An example query:
Navigation of a OLAP / Pivot control requires enabling Breadcrumbs in a component, or linking with a Breadcrumbs component.
Aggregate functions: unary and binary
- Binary Analytic
- In the Query Editor,
select fromthe database source 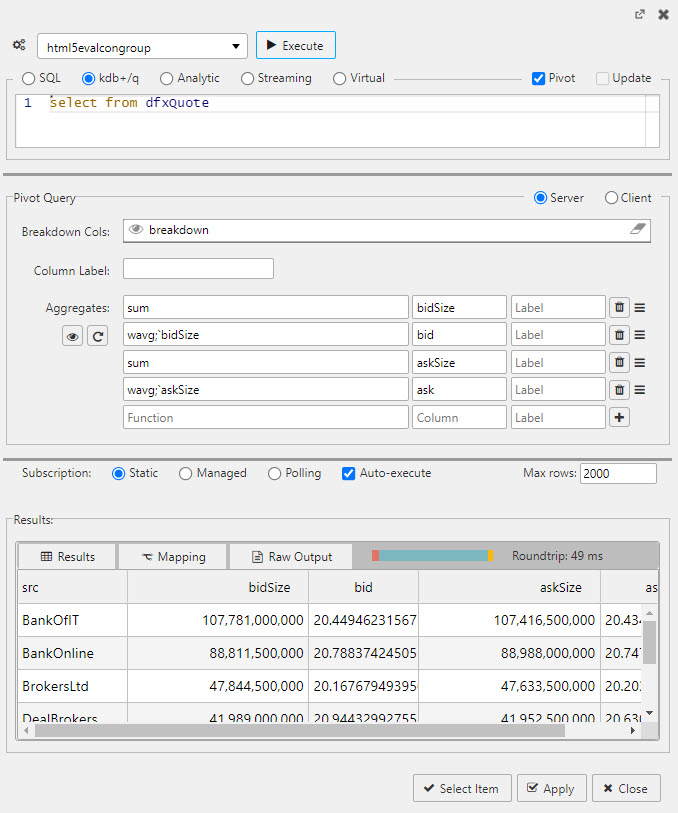
- Breakdown Cols
- The drill-down buckets, i.e. the independent variables
- Aggregates
- Functions of the dependent variables. Unary functions are
sum,avg,count,min,max.
Custom binary analytics
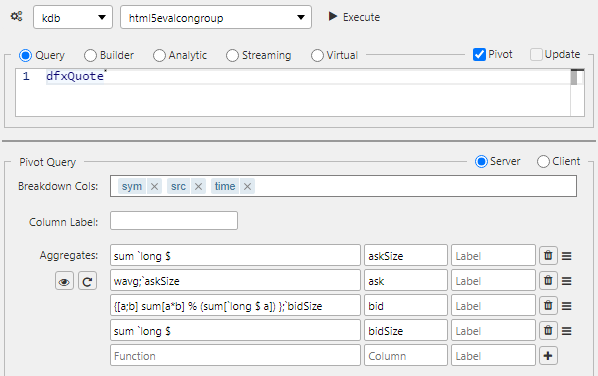
Example
A standard built-in binary function is available as part of the VWAP Analytic (subVWAP) found in Demo Trading dashboard in the Dashboard evaluation pack. bzise is bid size
{[a;b] sum[a*b] % (sum[`long $ a])};`bidSizeDynamic aggregate columns
To enable, click the View State icon in the basic pivot query control
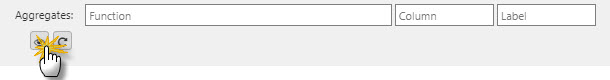
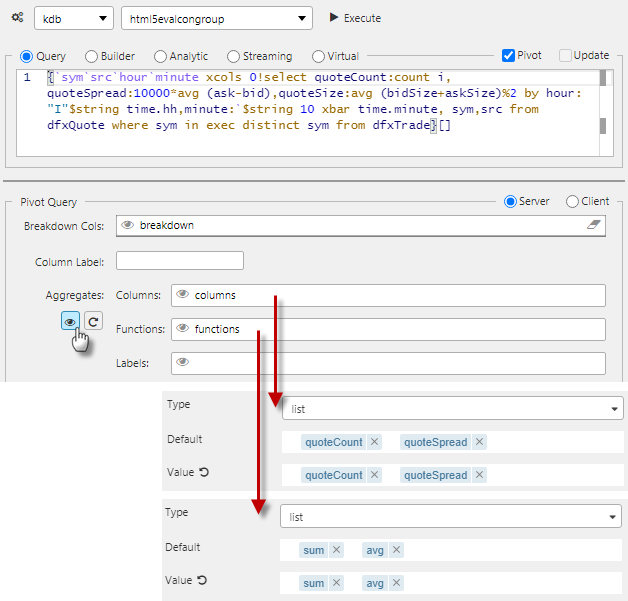
Using view states to define Breakdown columns, Aggregate Columns, Aggregate Functions and Labels. Each view state must be of Type list and each Aggregate Column must have a corresponding Aggregate function.
Remember to link to a Breadcrumbs component for navigation control of the pivot.
Update query
An update query allows a User to make permanent changes to source data from the Data Grid; for example, when adding a new client or customer. The update query requires both a query, and a settings check in Data Grid properties.
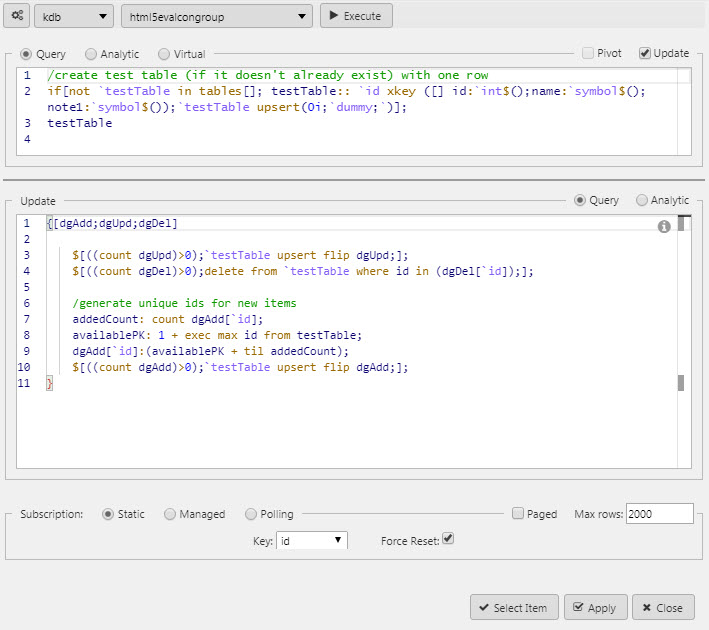 An update query
Force Reset
To ensure updates are returned to the user view, Force Reset must be enabled.
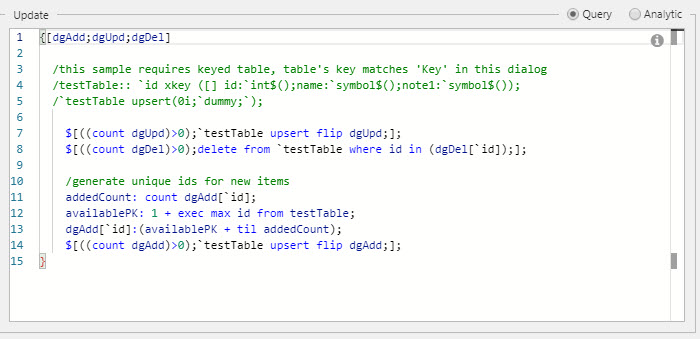
Update query definition example
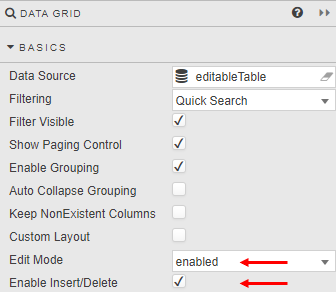
In addition to using an update query, Data Grid requires Edit Mode to be enabled or instant, and/or Enable Insert/Delete to be checked.
The user can then Edit in her dashboard
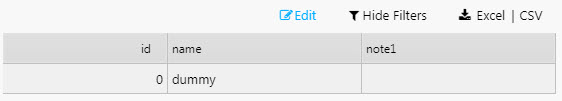 Activate Edit Mode
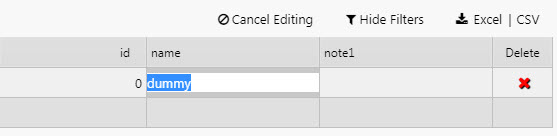
Make a change
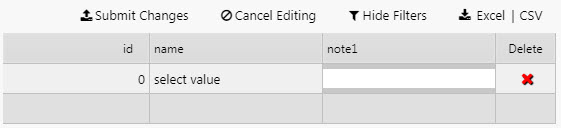
Submit a change
Permission to edit
If Update Query is enabled, all users with permissions for that dashboard will be able to make changes. If you want only some read-only users to have edit permissions do the following:
- Duplicate the dashboard
- Set Edit Mode to disabled and uncheck Enable Insert/Delete from the Data Grid properties
- Permission users who shouldn’t have edit control to this duplicate dashboard.
Mapping
Mapping maps results from a data source to View States. Results should include a column that contains keys and a column that contains values.
- Mapping configuation is accessible from the Mapping tab in the Results panel.
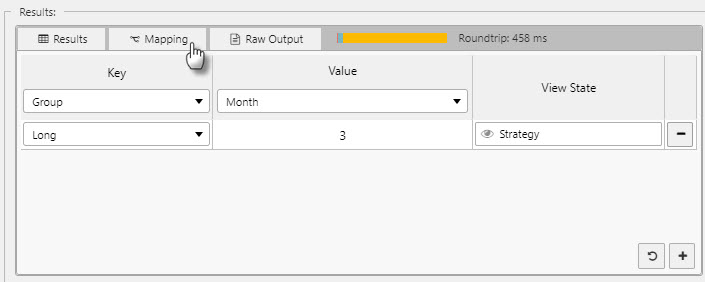
Key and value columns should be defined in the Key and Value dropdowns.
Mappings can be added using the + button. Within each mapping you can define the Key and the View State that the Value should be mapped to.
Keys in the current results can be added using the dropdowns. Other keys can be added by typing them into the dropdown input field and pressing enter.
The Reset button will populate the list of mappings with all available keys.