KX Insights Platform UI
KX Insights is a cloud based, easy-to-use, data investigation platform. Choose to import data from the cloud, file or relational data services, before querying your data in an exploration tab. Data can be represented in tabulated and visual formats, and is readily accessible from the platform. See how easy it is to import and interact with your data in the video below:
Access
To access the UI, a new user must be created in Keycloak via the admin account:
https://${INSIGHTS_HOSTNAME}/auth
Ensure this user is assigned all Available Roles before assiging a password for the user. Logout of the Admin Keycloak account and close the tab.
In a new browser tab, open https://${INSIGHTS_HOSTNAME} and sign-in as the newly created user.

This will open the UI Overview screen
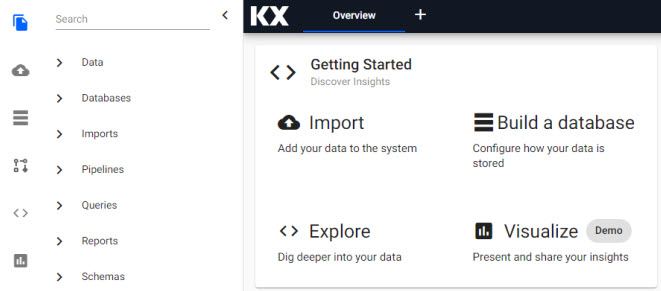
Overview
The Overview is a summary of generated reports and data pipelines. A prospective icon menu on the left offers quick access to data import, pipelines, exploration and visualization, and dashboard reports.

A Document Bar in the header menu can be used to switch between workspaces.
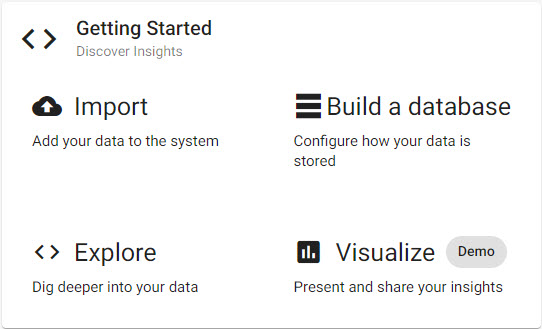
Getting Started
The quickest way to get started is to import data to the UI; click the  from the prospective menu or overview page to initiate a data import. Alternatively, start by building a database, create schemas and add data tables.
Reports
Reports is a list of embedded demo Dashboards; select-click to open. Click column header to sort in ascending or descending order. Select-click to filter
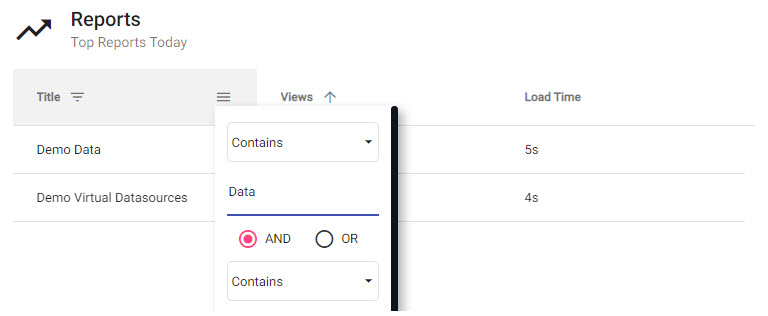
- Name
- Report name with jump link to the dashboard.
Pipelines
A status report of data service pipelines.
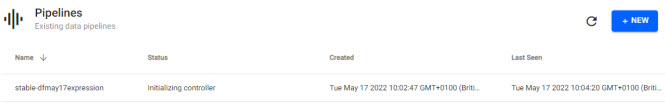
- Name
- The assigned pipeline name for the data connection.
- Status
- Pipeline process state; a pipeline state is either in the process of
Creating,RunningorErrored. Data from running pipelines can be queried in an explore tab.
- Created
- Date pipeline is created.
- Last Seen
- Date pipeline was last accessed.
Monitor
Select a pipeline, then click Monitor to open read-only view of the pipeline. This will open the selected pipeline in a workspace navigable from the Document bar.
Teardown
Select a pipeline, then click Teardown to remove a pipeline from the list.
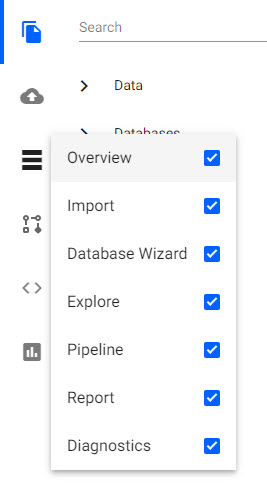
Prospective Menu
A customizable navigation toolbar, right-click to open the menu selector.
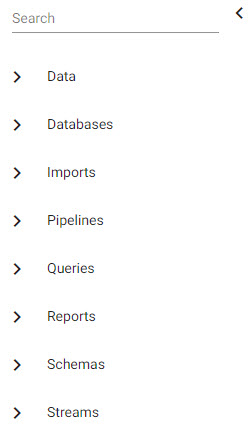
Entity Tree
A list of import, pipeline, report and query documents with global search functionality.
Databases
Create a Database with a simple wizard.
Imports
Import data from cloud, file or relational data services using a step-by-step wizard.
Pipelines
Create custom data pipelines.
Queries
Investigate your data. Click to + NEW to open an Explore workspace. Any running data service pipeline be queried from the Explore editor using qsql or SQL.
Reports
Preconfigured dashboards; click to view.
Streams
A list of configured streaming data services. Selecting a streaming data service will open an Explore workspace.
Tables
A list of available data sets. Selecting a table will open an Explore workspace.
Document Bar
The Document Bar is where workspaces are managed; add a Pipeline, Explore, Report or Import workspace with "+". Tab menus are scrollable.
