KX Dashboards
KX Dashboards is an interactive data visualization tool that enables non-technical and power users to query, transform, share and present live data insights.
Rich visualizations of both static and real-time streaming data can be built using drag-and-drop and point-and-click operations in an easy to use editor.
Powered by modern web technologies, Dashboards can be used in all major browsers across mobile and desktop environments.
Workspace
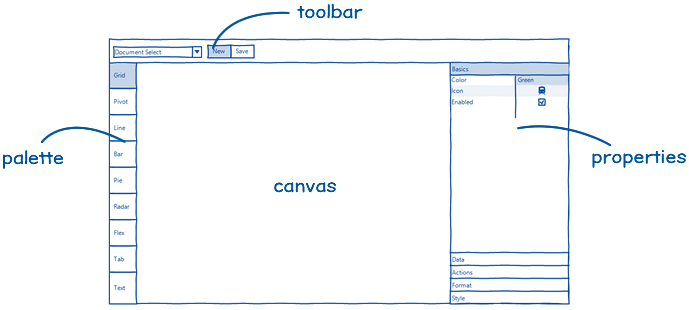
- KX Dashboards has an intuitive layout familiar to any user of office software. Components can be dragged from a palette on the left, arranged on a central canvas and modified via a property inspector on the right.
-
Components
Over 35 preinstalled components provide out-of-the-box functionality while custom components allow for complete extensibility.