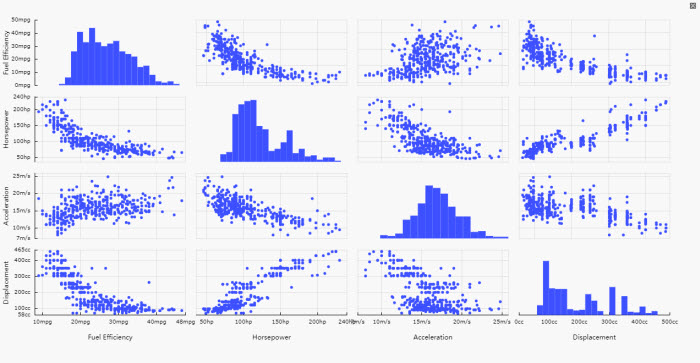
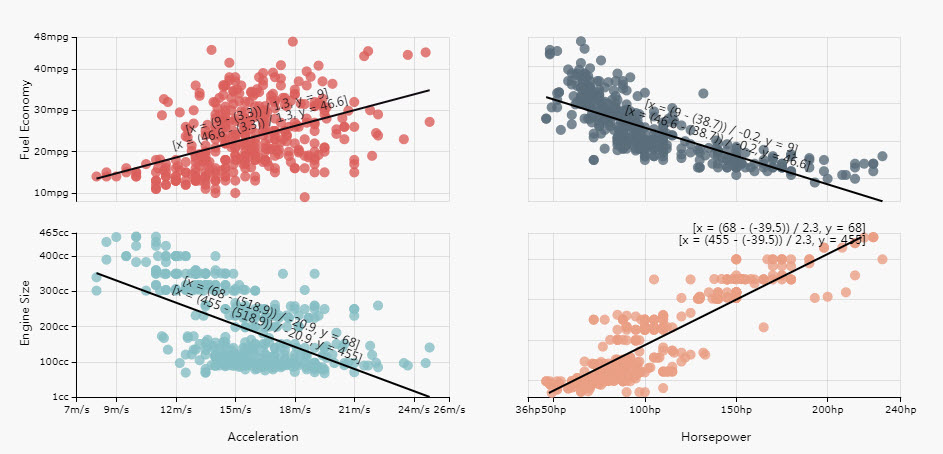
ScatterPlot Matrix
A matrix for plotting two or more variables against one another
Set up
-
Assign a data source.
-
Select between
quartetormatrixChart Type. -
Configure your Column Name per plotted item in a
matrix, or X Axis and Y Axis Data per chart n in aquartetplot.
Basics
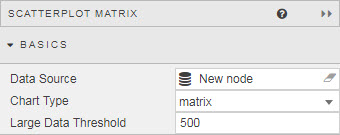
- Data Source
- Data sources
- Chart Type
- Switch between
quartetandmatrix - Large Date Threshold
- This is the number of data points per chart, above which performance optimizations kick-in; restricting some of the available functionality.
Overlay
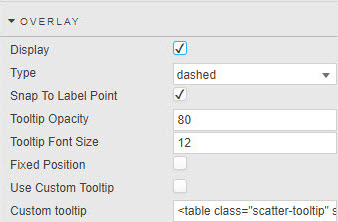
- Display
- Toggles display of tooltip
- Type
- Define crosshair style
- Snap to Label Point
- When enabled, tracks plotted points
- Tooltip Opacity
- Tooltip Font Size
- Style Crosshair. Opacity is a value between 0 and 100.
- Fixed Position
- Anchors overlay to the corner
- Use Custom Tooltip
- Custom Tooltip
- Defines data to display in the overlay
Data columns
Matrix
Column
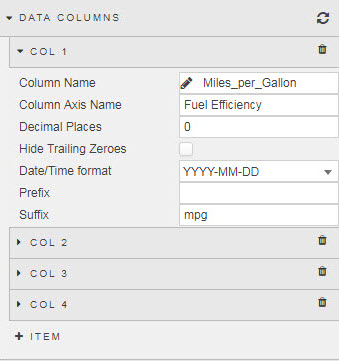
- Column Name
- Assigned from Data source
- Column Axis Name
- Text description name for the axis. Formatted in Title
- Decimal Places
- Number of decimal places for axis values
- Hide Trailing Zeroes
- Remove trailing zeroes.
- Date/Time Format
- Use for
DatetimeFormat - Prefix
- Suffix
- Additional text label to apply before or after label value
Quartet
Column
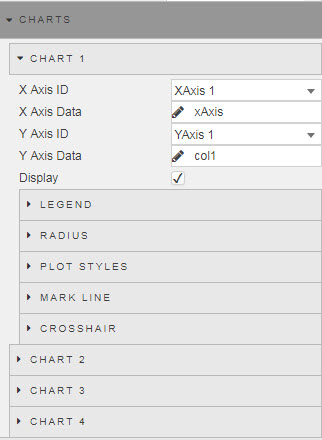
- X Axis ID
- X Axis Data
- Define data source data for x-axis
- Y Axis ID
- Y Axis Data
- Define data source data for y-axis
- Display
- Toggle display of chart. If only a single scatter plot is required, uncheck display of Charts 2,3 and 4.
Legend
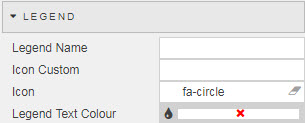
- Legend Name
- Legend Color
- Text name and color of Legend
- Icon Custom
- Set icon to a vector path; click for more information
-
Custom Icon Limitations
Icon custom does not supportarroworimage://url. - Icon
- Define Legend icon shape
Radius
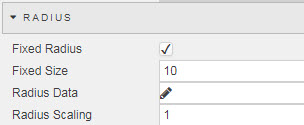
- Fixed Radius
- Fixed Size
- Enable and define fixed bubble size
- Radius Data
- Radius Scaling
- Assign radius to a data source variable and apply a scaling to this variable
Plot styles
- Plot Shape
- Plot Color
- Select from
circle,rect,roundRect,triangle,diamond,pin,arrowandnone
Mark line
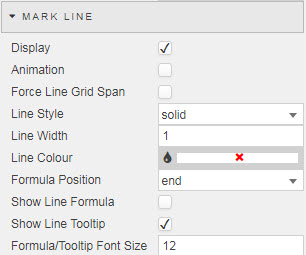
- Display
- Enable trend (best-fit) line
- Animation
- Include draw animation of line
- Force Line Grid Span
- Mark line extends to edge of chart
- Line Style
- Line Width
- Line Color
- Style Mark Line. Select from
solid,dashedanddottedline - Formula Position
- Select where the line equation is anchored from
start,middle, orendof line - Show Line Formula
- Display equation of line on chart
- Show Line Tootlip
- Display equation of line in tooltip
- Formula/Tooltip Font Size
- Set font size for line equation
Crosshair
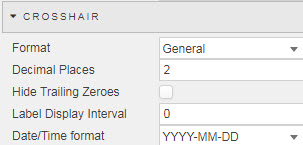
- Format
- Define data type:
General,Number,Smart Number,Formatted Number,Datetime - Decimal Places
- Define Format precision for
Number,Smart Number, andFormatted Number - Hide Trailing Zeroes
- Remove trailing zeroes.
- Label Display Interval
- Set frequency of label display
- Date/Time Format
- Use for
DatetimeFormat
X axes
Matrix
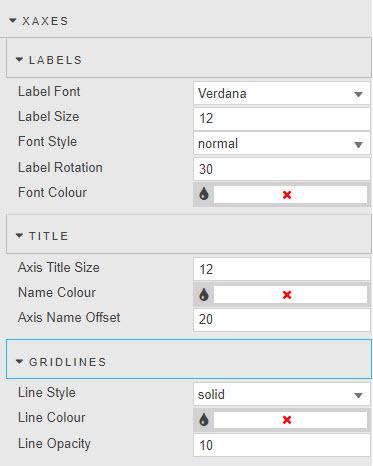
Axes name inherited from Column Axis Name in Matrix Col (Data Columns).
Labels
- Label Font
- Select from
Verdana,Fontawesome,Arial,Helvetica,Times,Courier - Label Size
- Font size for x-axes label in pixels
- Font Style
- Choose from
Normal,Bold,ObliqueorItalic - Label Rotation
- Set angle for X-axes tick value labels
- Font_Color
- Set font color
Title
- Axis Title Size
- Font size for X-axes label
- Name Color
- Format color of X-axes label
- Axis Name Offset
- Pixel distance between axes values and axes label
Gridlines
- Line Style
- Line Opacity
- Line Color
- Gridline style; select from
solid,dashedanddottedline. Opacity is a value between 0 and 100.
Quartet
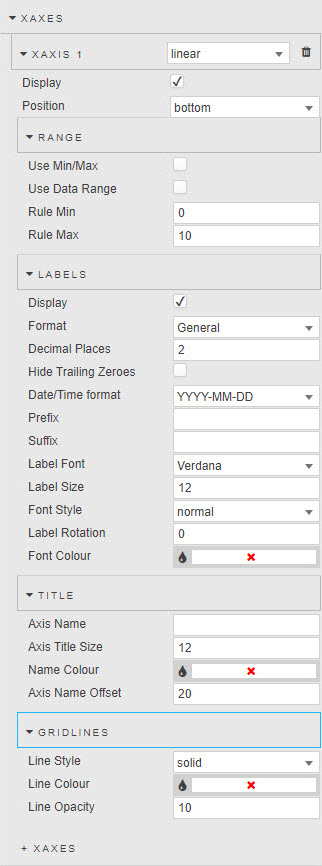
Select between linear, category, logarithmic, and time
- Display
- Toggle position of axes
- Position
- Set position of X axes at
toporbottomof chart
Range
- Use Min/Max
- Rule Min
- Rule Max
- Toggle and set range of X-axes minimum and maximum values
- Use Data Range
- Use plotted data to define minimum and maximum value of quartet chart range
Labels
- Display
- Toggle display of X axes
- Format
- Select data type from
Number,General,Smart Number,Formatted Number,Datetime - Decimal Places
- Define number of decimal places for
Number,Smart NumberandFormatted Number - Hide Trailing Zeroes
- Remove zeroes at the end of
Number,Smart NumberandFormatted Numbernumbers - Date/Time format
- Select from dropdown the date and/or time format when
Datetimeis used as label Format - Prefix
- Suffix
- Add text element to axes label before or after value
- Label Font
- Select from
Verdana,Fontawesome,Arial,Helvetica,Times,Courier - Label Size
- Font size for X axis label in pixels
- Font Style
- Choose from
Normal,Bold,ObliqueorItalic - Label Rotation
- Set angle for X-axes tick value labels
- Font_Color
- Set font color
Title
- Axis Name
- Text label used for X axis
- Axis Title Size
- Font size for X-axis label
- Name Color
- Format color of X-axis label
- Axis Name Offset
- Pixel distance between axis values and axis label
Gridlines
- Line Style
- Line Opacity
- Line Color
- Gridline style; select from
solid,dashedanddottedline. Opacity is a value between 0 and 100.
Y axes
Matrix
Labels
- Label Font
- Select from
Verdana,Fontawesome,Arial,Helvetica,Times,Courier - Label Size
- Font size for Y-axis label in pixels
- Font Style
- Choose from
Normal,Bold,ObliqueorItalic - Label Rotation
- Set angle for Y-axis tick value labels
- Font_Color
- Set font color
Title
- Axis Title Size
- Font size for Y-axis label
- Name Color
- Format color of Y-axis label
- Axis Name Offset
- Pixel distance between axis values and axis label
Gridlines
- Line Style
- Line Width
- Line Color
- Gridline style; select from
solid,dashedanddottedline
Quartet
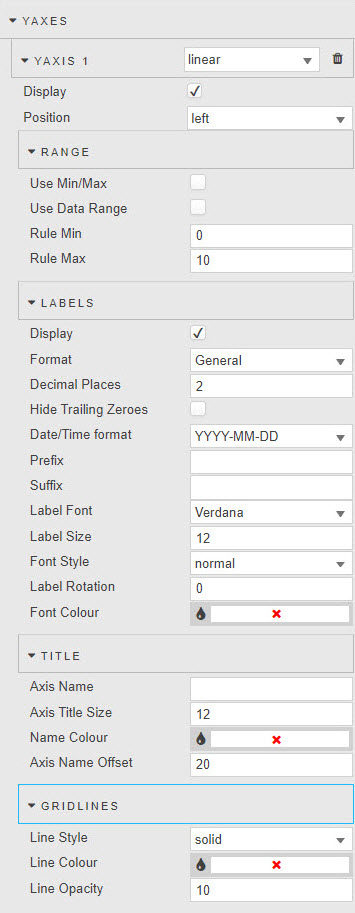
Select between linear, category, logarithmic, and time
- Display
- Toggle position of axis
- Position
- Set position of Y axis at
leftorrightof chart
Range
- Use Min/Max
- Rule Min
- Rule Max
- Toggle and set range of Y-axis minimum and maximum values
- Use Data Range
- Use plotted data to define minimum and maximum value of quartet chart range
Labels
- Display
- Toggle display of Y axis
- Format
- Select data type from
Number,General,Smart Number,Formatted Number,Datetime - Decimal Places
- Define number of decimal places for
Number,Smart NumberandFormatted Number - Hide Trailing Zeroes
- Remove zeroes at the end of
Number,Smart NumberandFormatted Numbernumbers - Date/Time format
- Select from dropdown the date and/or time format when
Datetimeis used as label Format - Prefix
- Suffix
- Add text element to axis label before or after value
- Label Font
- Select from
Verdana,Fontawesome,Arial,Helvetica,Times,Courier - Label Size
- Font size for X-axis label in pixels
- Font Style
- Choose from
Normal,Bold,ObliqueorItalic - Label Rotation
- Set angle for X-axis tick value labels
- Font_Color
- Set font color
Title
- Axis Name
- Text label used for Y axis
- Axis Title Size
- Font size for Y-axis label
- Name Color
- Format color of Y-axis label
- Axis Name Offset
- Pixel distance between axis values and axis label
Gridlines
- Line Style
- Line Opacity
- Line Color
- Gridline style; select from
solid,dashedanddottedline. Opacity is a value between 0 and 100.
Legend
For Quartet chart only
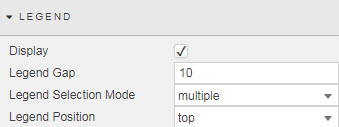
- Display
- Toggle header legend
- Legend Gap
- Pixel width between legend labels
- Legend Selection Mode
- Select from
single,multipleanddisabled;singlewill only show one data set from the quadrat, click on the Legend to switch to another data set of the quadrat. Default ismultiple - Legend Position
- Select from
top,bottom,leftorright
Style, Margins and Format
- Matrix Axis Padding
- Set Padding around axis labels
- Matrix Enable Brush Tools
- Cross chart highlight rules for data