Radar Chart
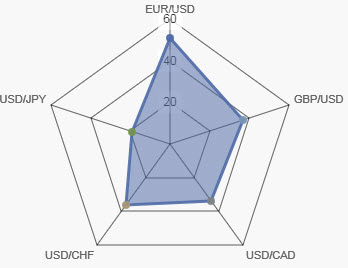
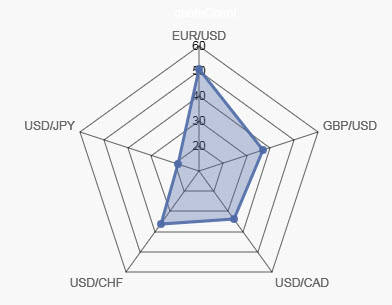 A Radar Map
Set up
-
Define a data source and select chart type to create.
-
Select Radar Columns for the category data.
-
Add a Layer and define the Series Data to plot.
Basics
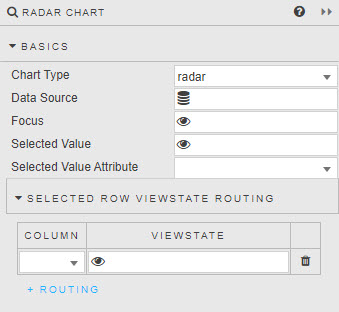
- Chart Type
- Dropdown selection between:
radar,polarAreaandpie. - Data Source
- A data source.
- Focus
- A View State Parameter for linking components.
- Selected Value
- Selected Value Attribute
- Selected Row ViewState Routing
- To capture clicks on the chart
Data
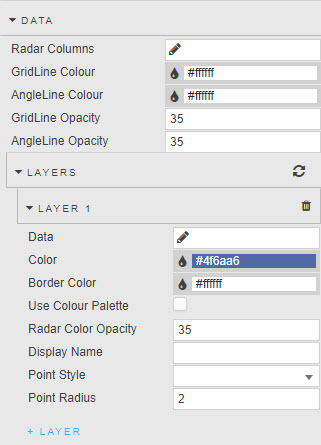
- Radar Columns
- Select from data source or view state parameter; values represent radar labels.
- GridLine color
- AngleLine color
- Gridline Opacity
- AngleLine Opacity
-
Define radar color and opacity line. Opacity is a value between 0 and 100.
Layers
Layer 1
- Data
- Determine which data column is charted.
- Color
- Border Color
- Use color Palette
- Radar Color Opacity
- Set area and border color of radar.
- Display Name
- Descriptive name of data layer (label in chart).
- Point Style
- Point Radius
- Define criteria of radar points. Select from
circle,cross,crossRot,dash,line,rect,rectRounded,rectRot,star, andtriangle.
Legend
- Show
- Toggle display of legend.
- LabelColor
- Set legend font color.
- Position
- Place legend
top,bottom,leftandright.
Chart padding
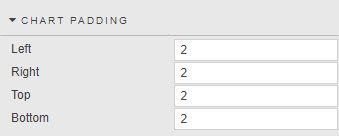
- Left
- Right
- Top
- Bottom
- Assigns internal pixel padding.
Ticks
Controls radar internal grid labels.
- Display
- Toggle display of tick labels.
- Font Color
- Font Size
- Define color and size of tick labels.
- Show Label Backdrop
- Adds white space around labels, improving clarity.
- Backdrop Color
- Backdrop Padding X and Y
- Sets radar tick label color and area padding.
- Max Ticks Limit
-
Sets number of radar zones.
- Begin at Zero
- Central point of radar starts at zero versus best fit.
- Format
- Select from
General,Number,Smart Number,Formatted Number,Datetime. - Decimal Places
- Where
Number,Smart Number,Formatted Numberis selected, set number of Decimal Places to use. - Hide Trailing Zeroes
- Doesn't display trailing zeroes in a number.
- Date/Time Format
- Set date type when
Datetimeis selected. - Prefix
- Suffix
- Apply text label, e.g.: "%", "£", "$".
- Radar Labels Size
- Set font size of outer radar labels.
Tooltip
- Stack Tooltip Data
- When checked, it will subtract current level from previous level to return a differential.
Color palette
Define when radar chart uses OLAP/Pivot data.
Animations
- Enabled
- When checked offers smoothing render animation.
File export
Format, Margins
Style for common settings