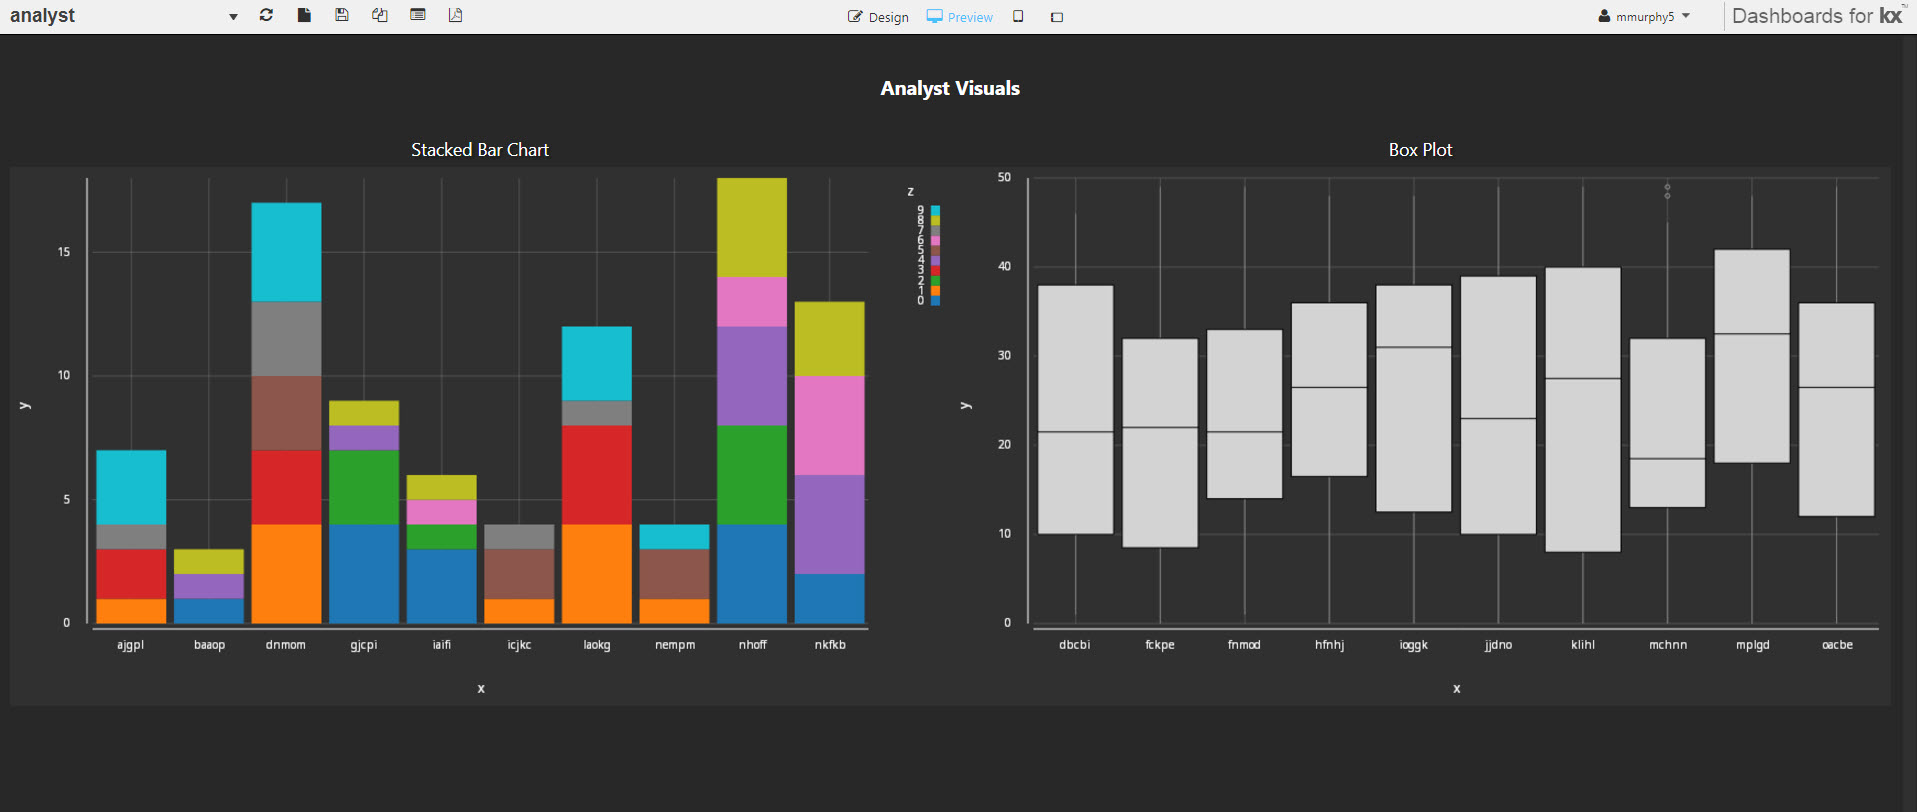
Analyst Visual
A container for a Grammar-of-Graphics visualization
Basics
- Data Source
- Grammar-of-Graphics written in the editor connecting to KX Analyst; see setup for an example. Data source
- Selected Value
- View State Parameters
Style, Format, Margins
Style for common style settings
Setup
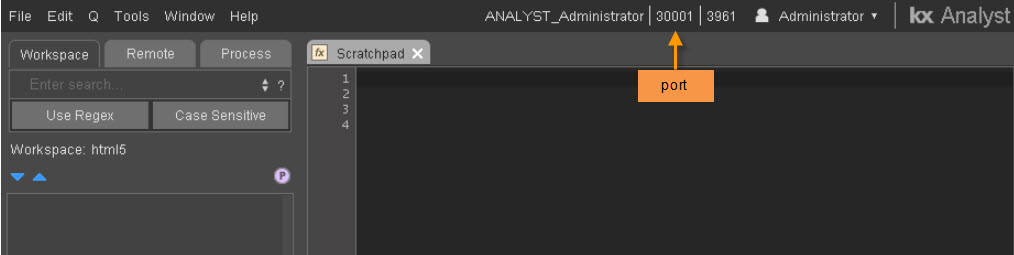
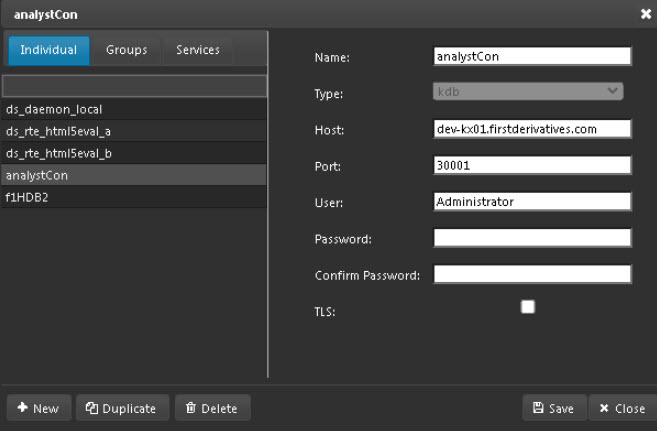
Step 1. Create a connection to Analyst in Dashboards.
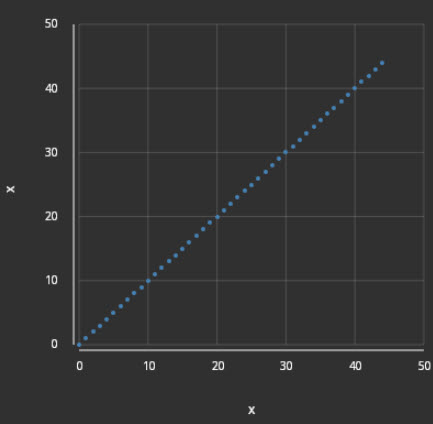
Step 2. Create a new data source in KX Dashboards using the Analyst connection; a simple Grammar of Graphics example:
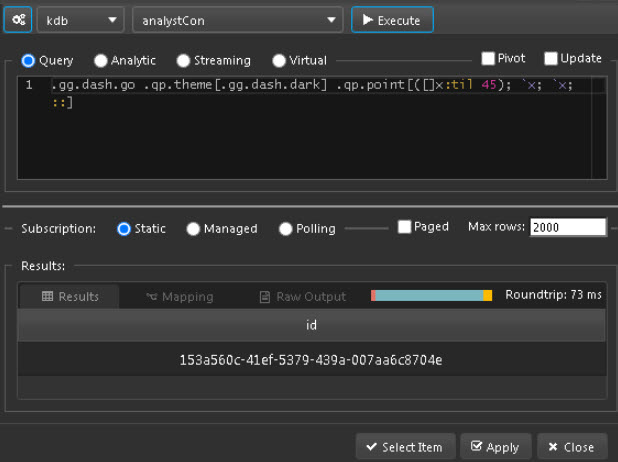
.gg.dash.go
.qp.theme[.gg.dash.dark]
.qp.point[([]x:til 45); `x; `x; ::]