Views Overview
This section provides an overview of kdb Insights Enterprise Views.
kdb Insights Enterprise Views is an embedded version of KX Dashboards which enables you to create visualizations of your data. Using the drag and drop interface you can build Views containing feature rich components such as charts, maps, data grids and many other components. These visualization help you to analyze and gain insights from your data.
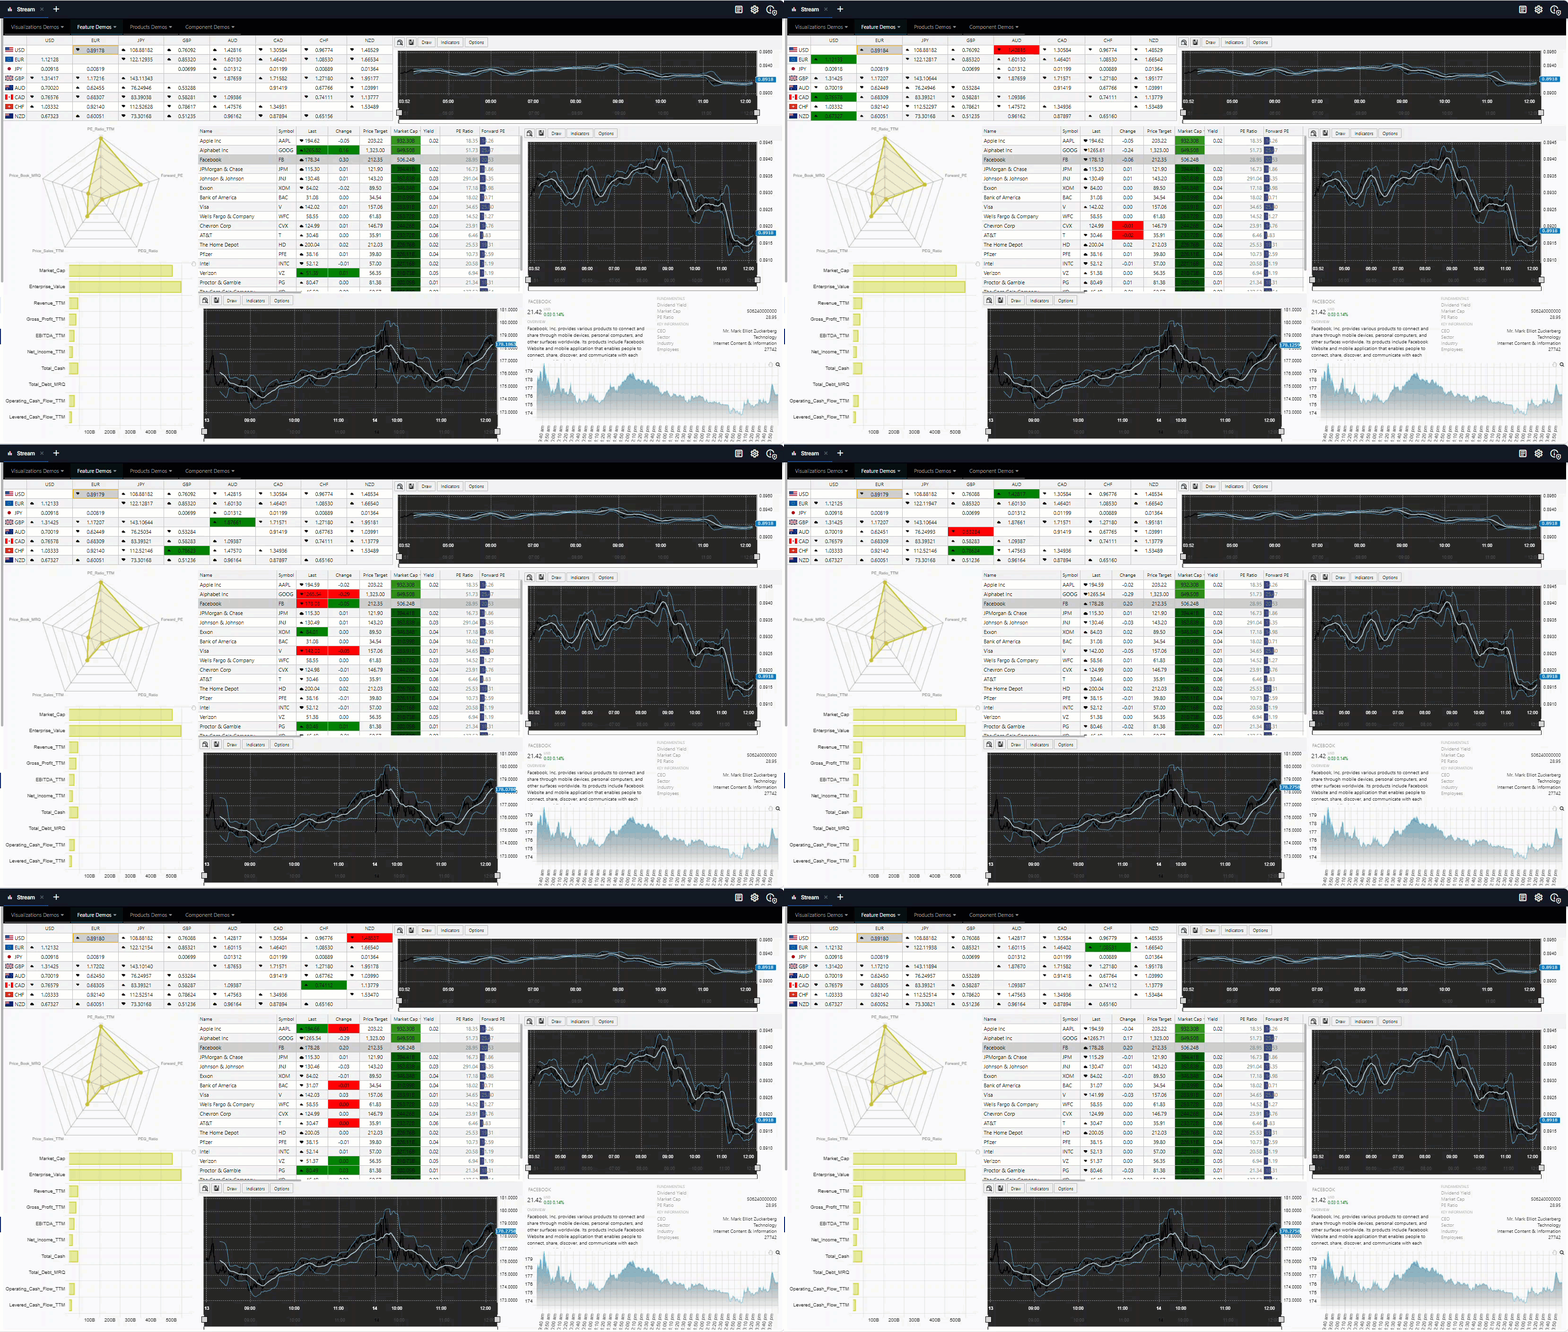
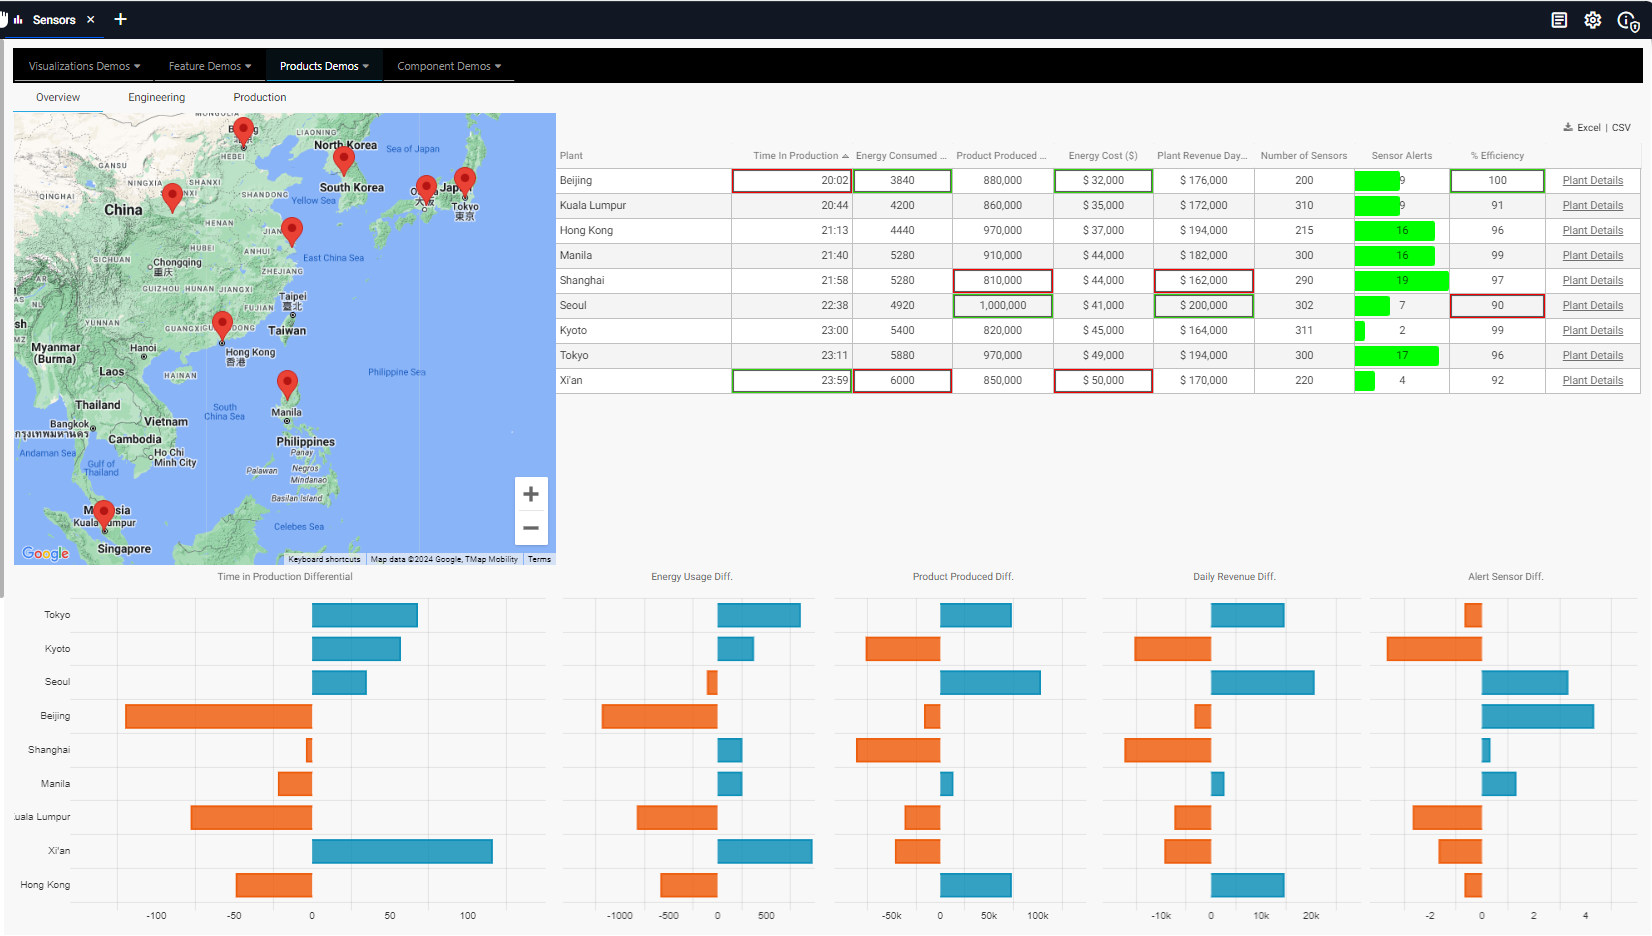
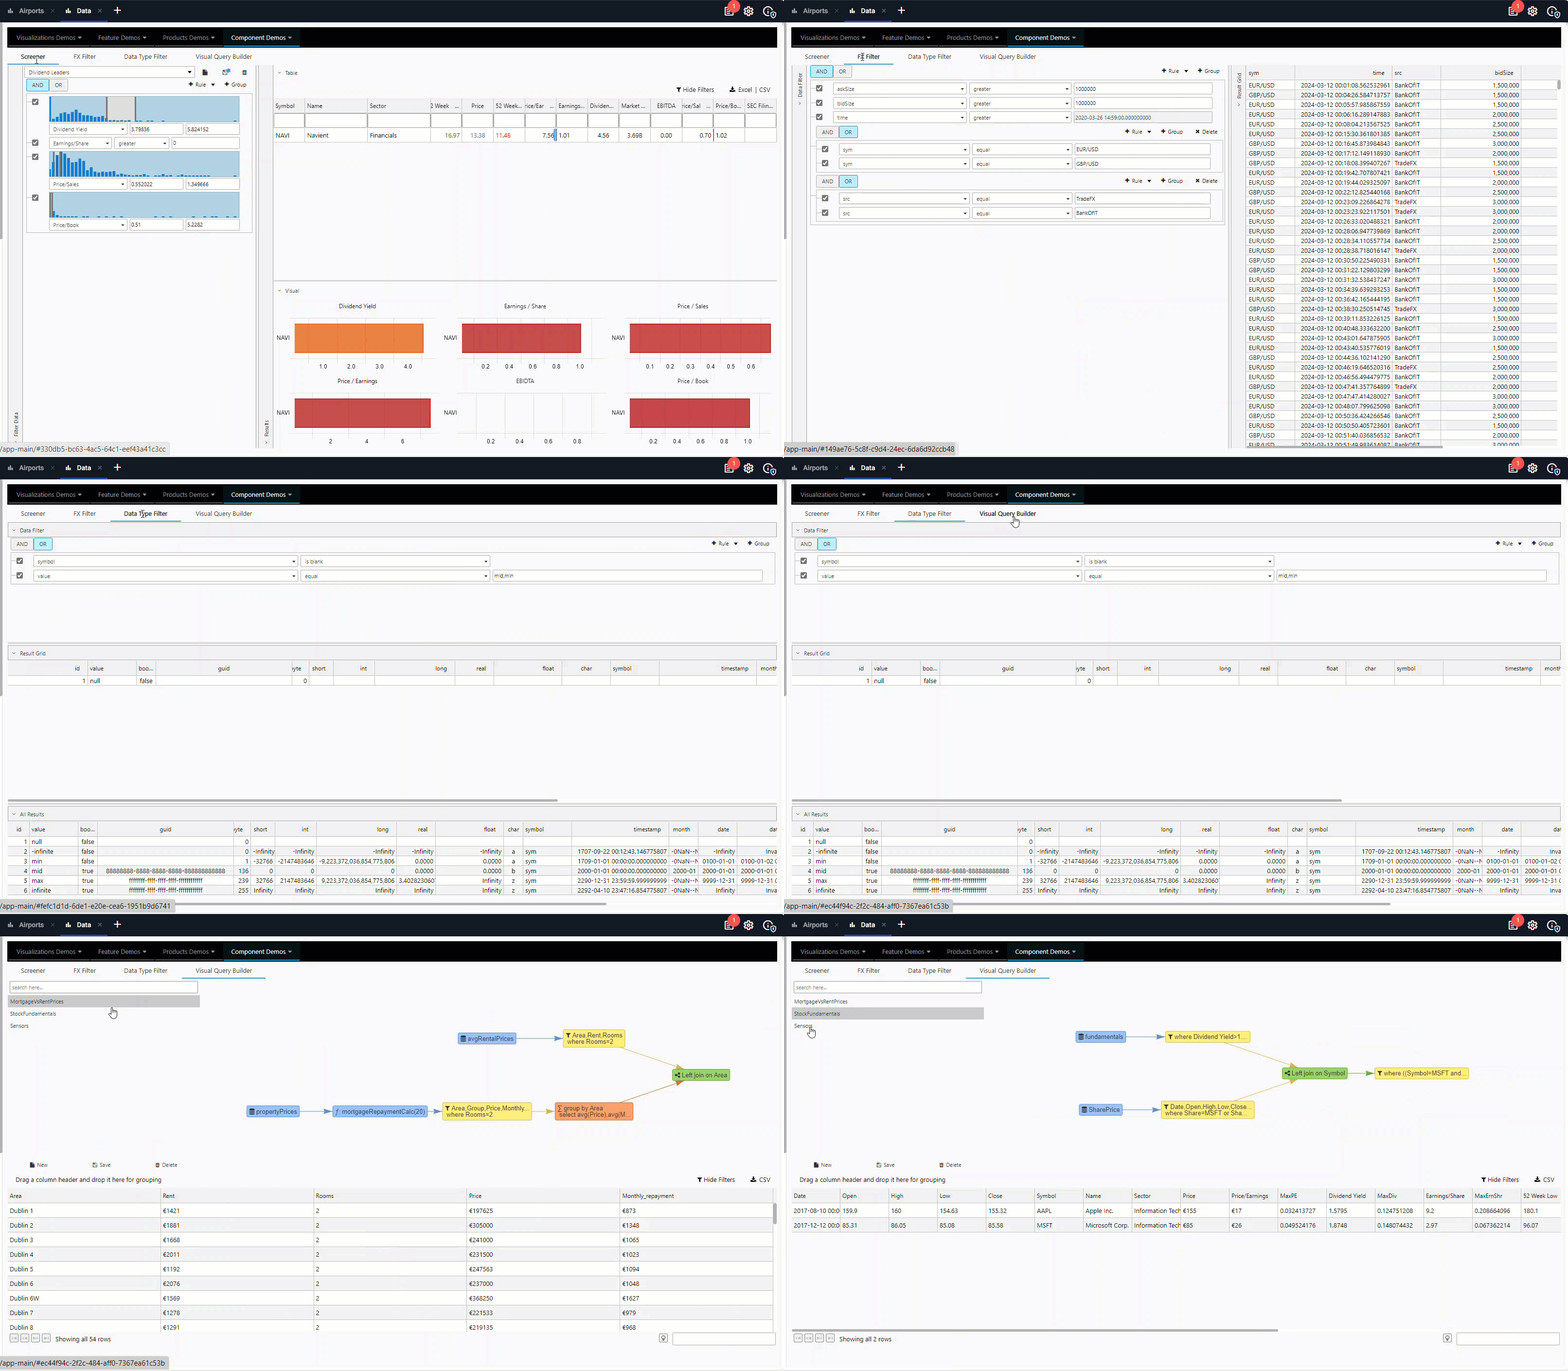
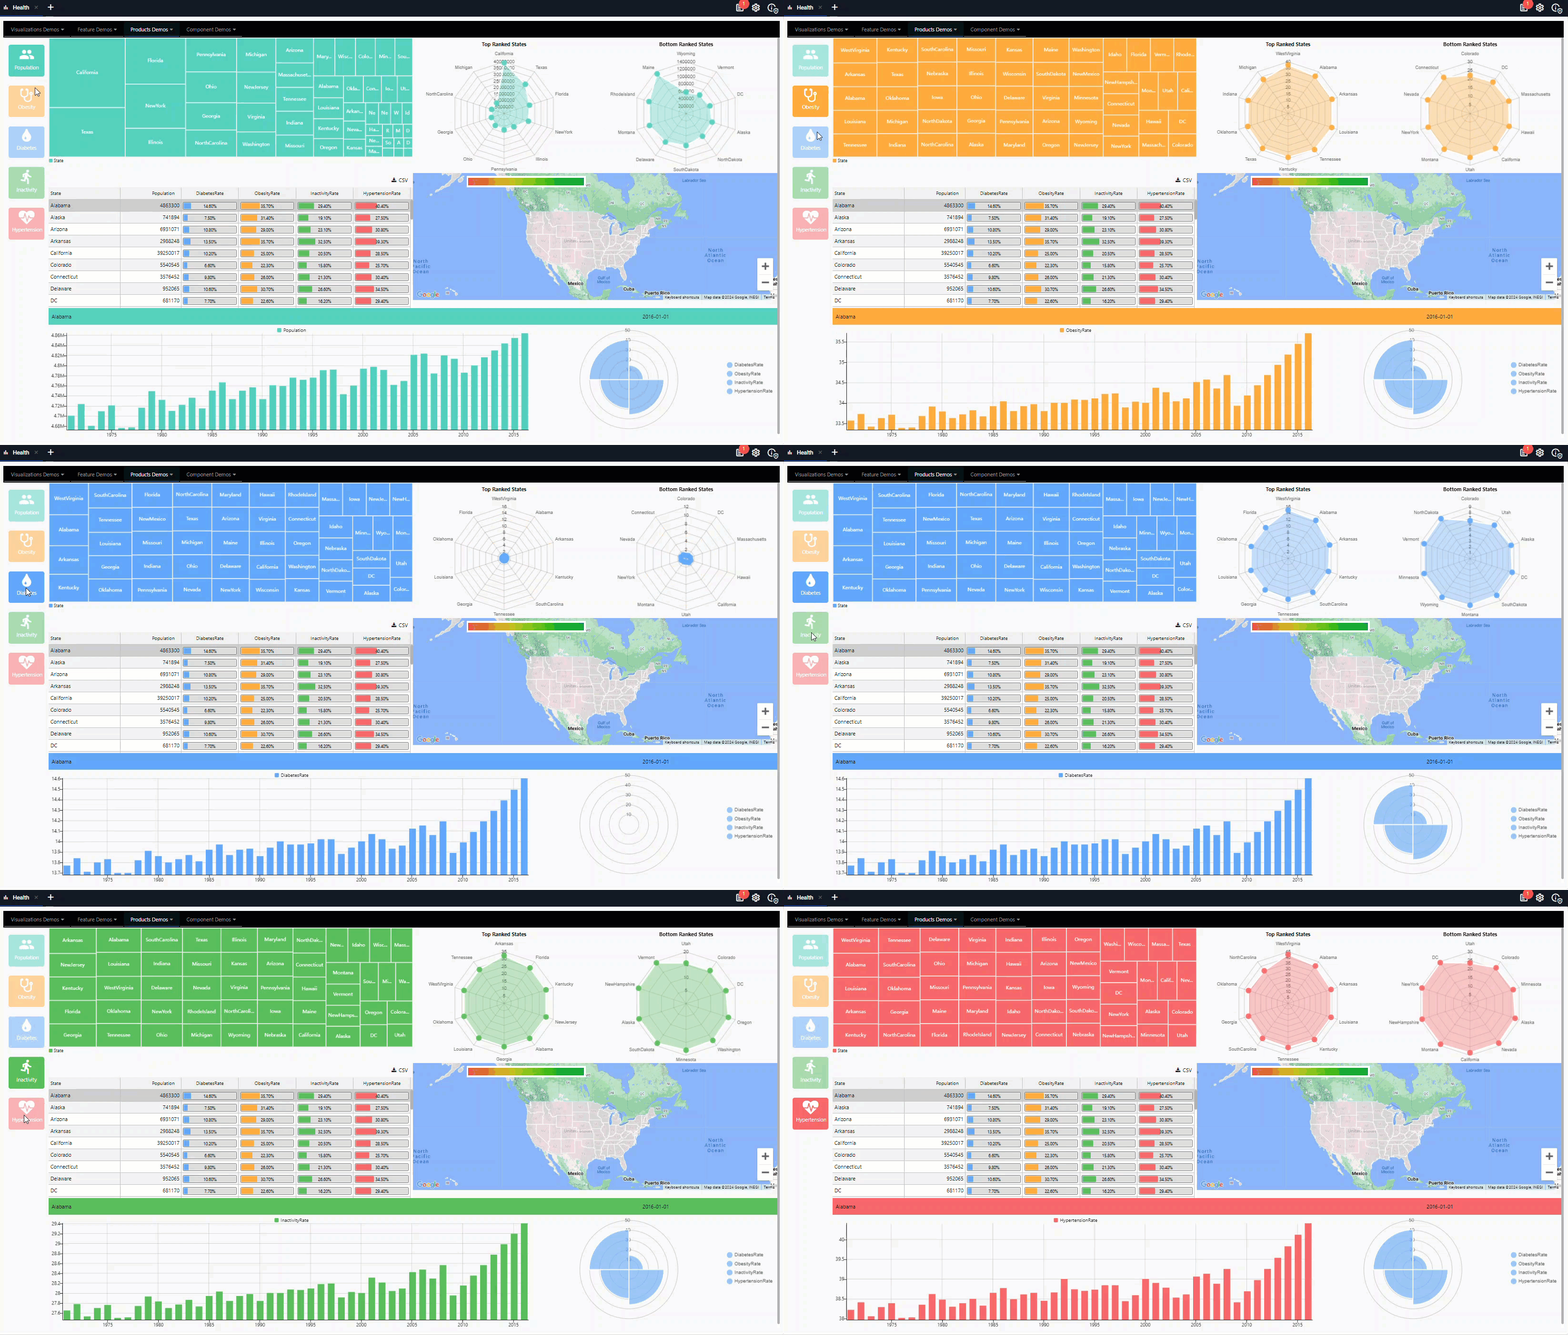
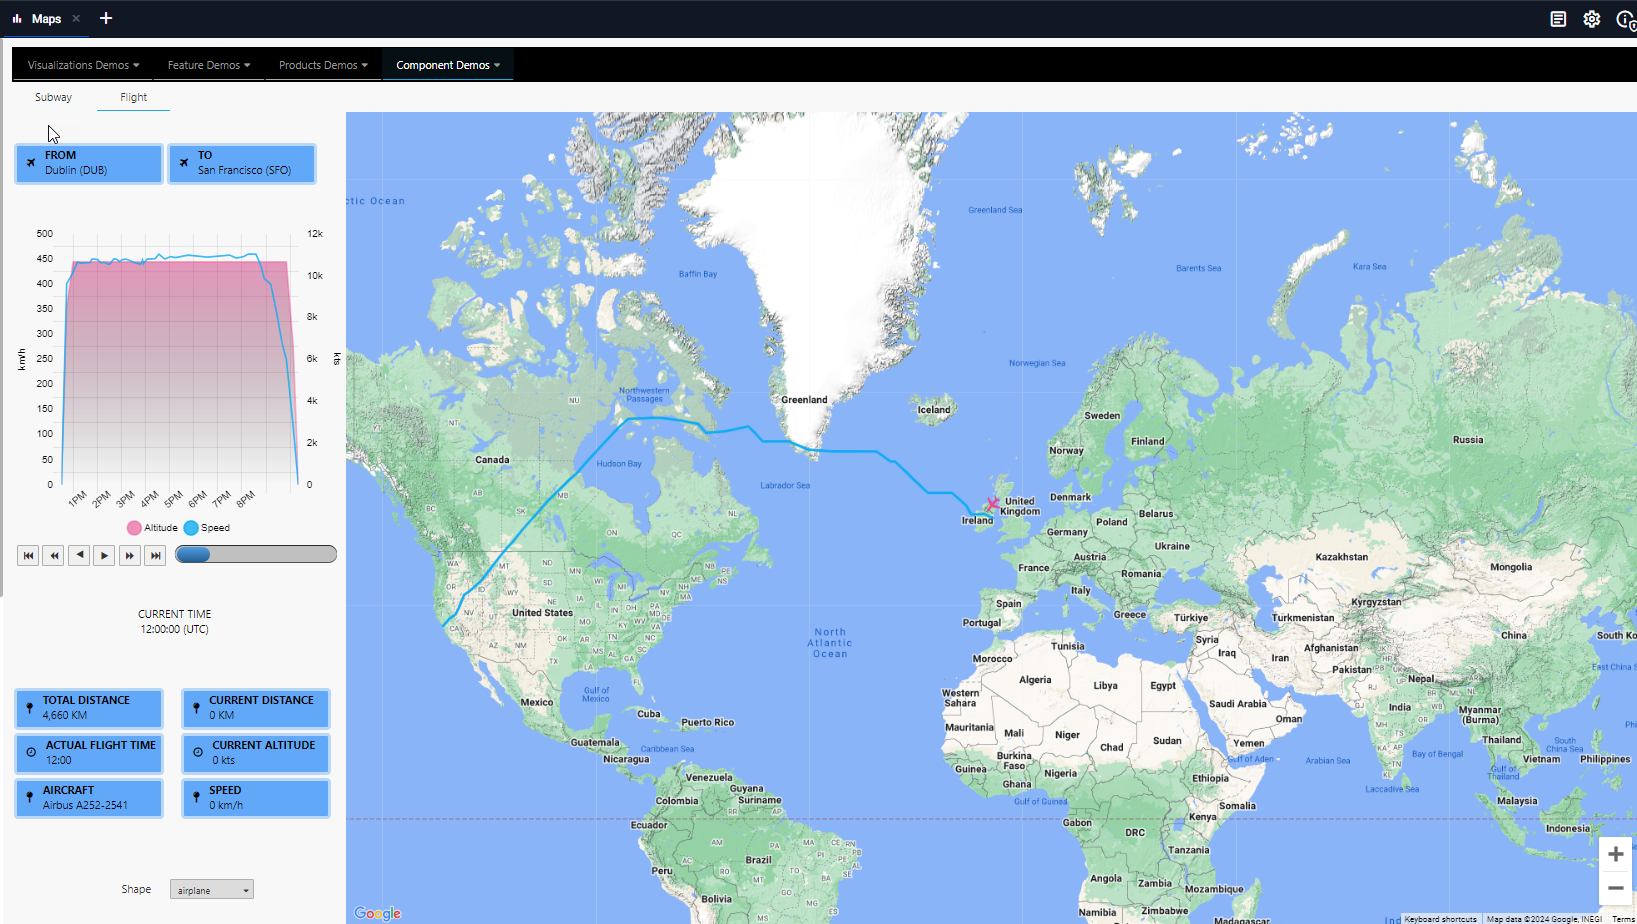
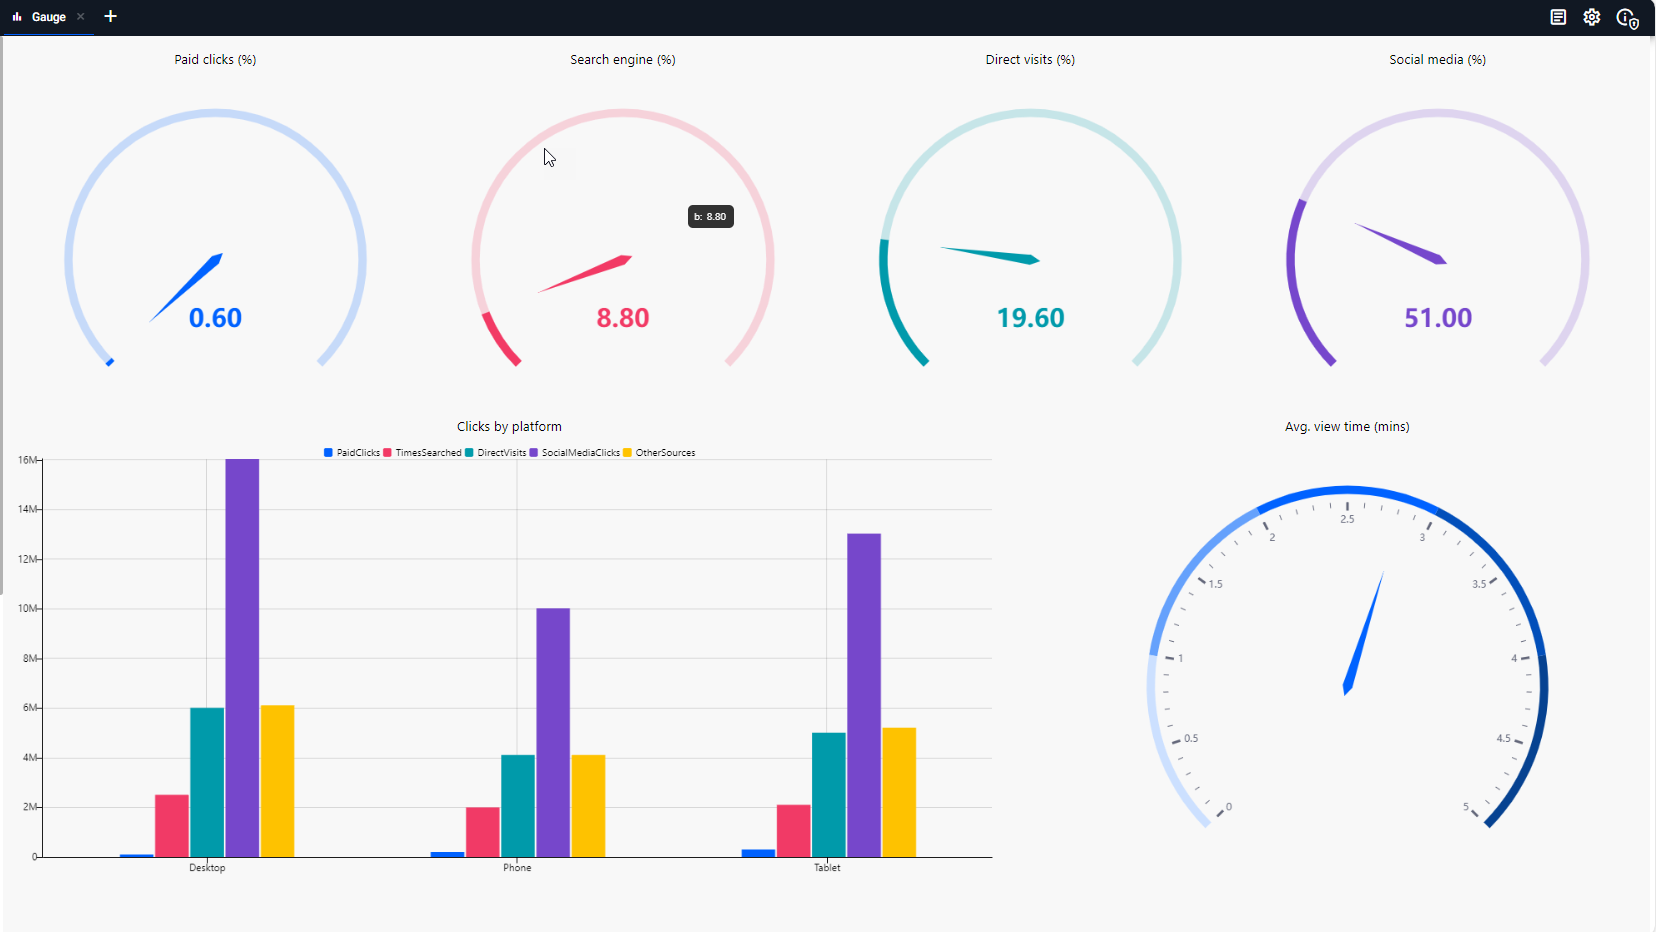
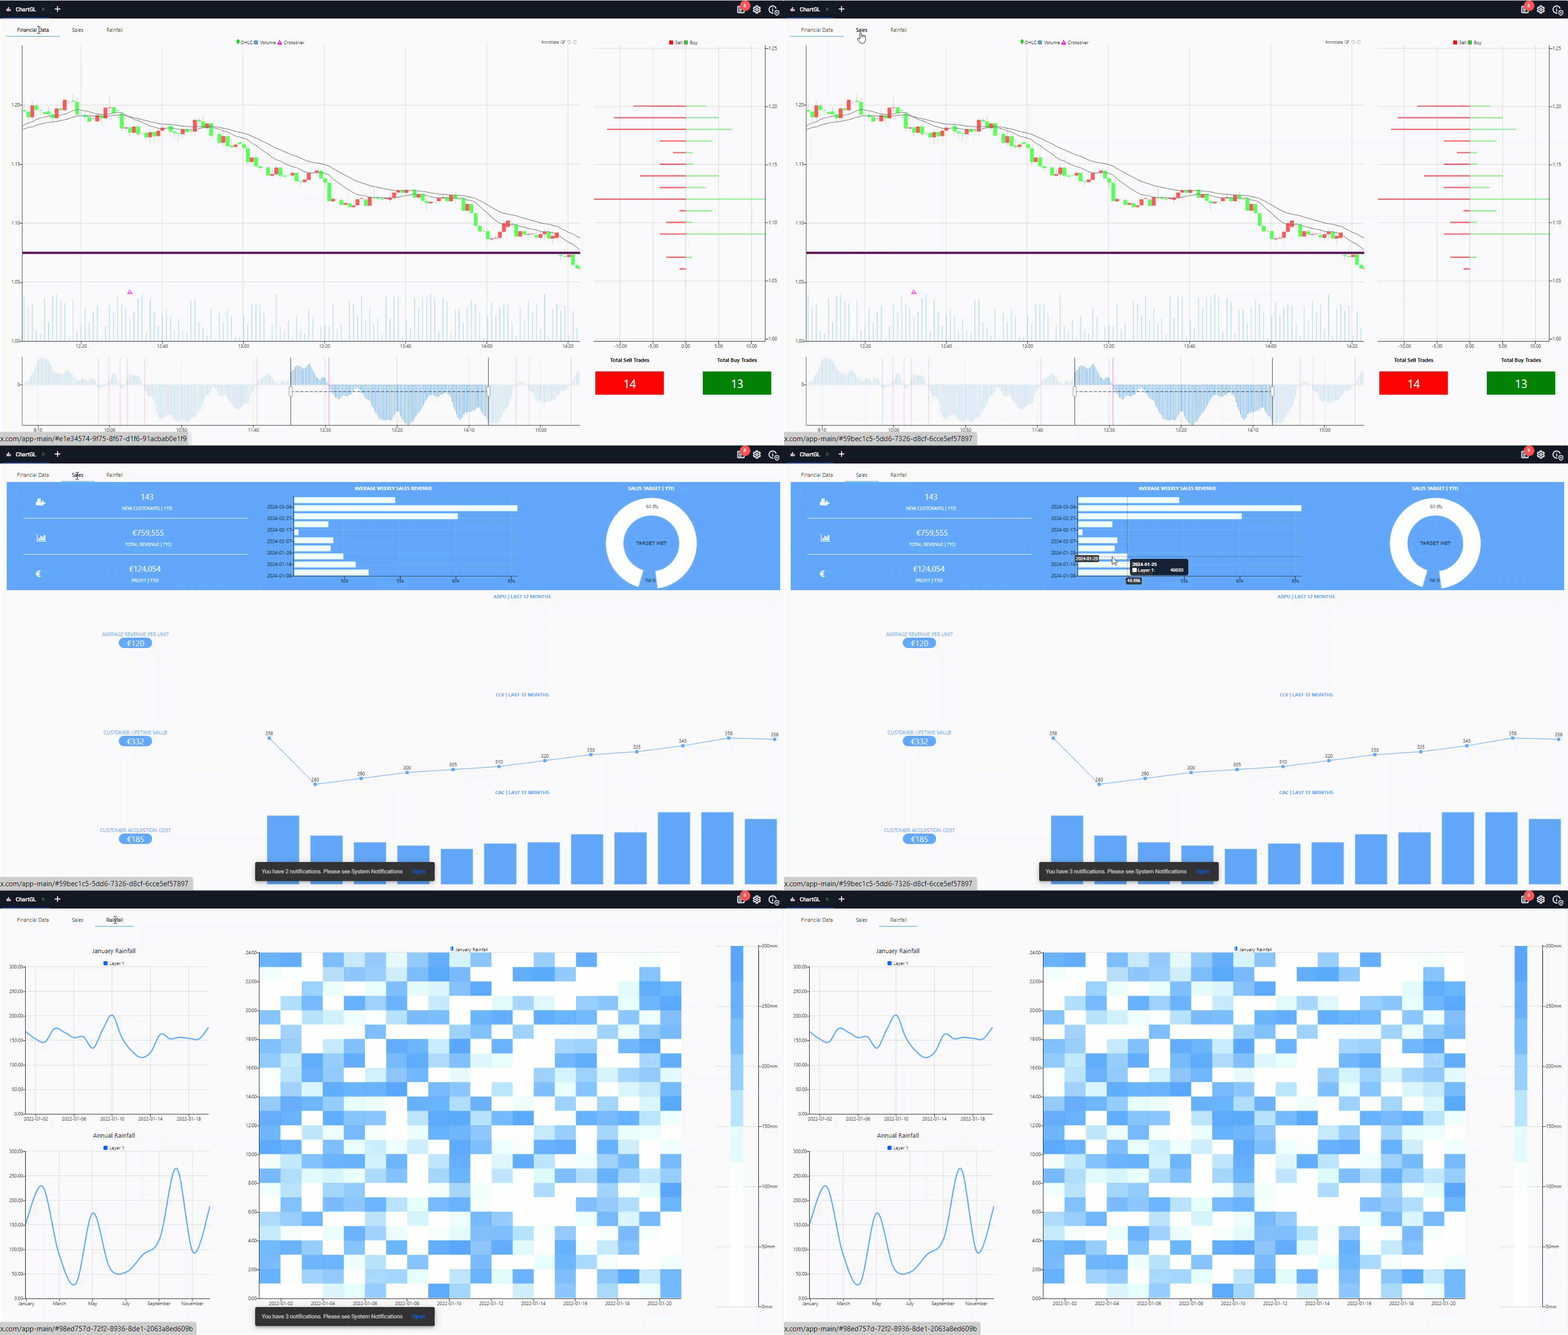
kdb Insights Enterprise supports over 40 components, which can be added to your Views. The following screenshot shows an example of the type of Views you can create.
Click on a tab below to see examples of different types of Views that can be created using kdb Insights Enterprise.
The following pages provide details on how to create and configure Views:
Further reading
The following pages provide guided walkthroughs on creating Views: