Scratchpad
This section describes how to use the Scratchpad, in the UI Query window to query the database, develop and debug pipelines, or run arbitrary q and Python code.
Once you are familiar with the features and layout of the Scratchpad you can proceed with using the Scratchpad to execute the functionality.
Scratchpad features
A scratchpad is a q process running in a Rocky Linux container. Each user gets their own scratchpad. It is an ephemeral process. The contents of the editor can be saved, but any in-memory state or on-disk state are only persisted until the scratchpad session is terminated.
This section describes:
Scratchpad resources
The CPU and memory resources for the Scratchpad can be configured within your values.yml. See Scratchpad resources for details. Any changes made to these resources apply to all users.
A Scratchpad is limited (by default) to 500 MiB of RAM and 50 MiB of disk. When exceeded, the Scratchpad process shuts down and restarts. To optimize performance, limit the amount of data returned in your query; for example: select[10000] from myTable to return 10,000 rows of data.
Disk operations
There is a 50 MiB disk mounted to /tmp that can be used for any purpose. This folder is ephemeral, and is cleared when the Scratchpad process terminates. The rest of the file system is read-only.
Scratchpad restart
Scratchpads terminate after one hour of inactivity, or if a resource limit is exceeded. After a Scratchpad restart, any in-memory or on-disk state is lost.
Logs
Each user gets their own Scratchpad. Each Scratchpad is a q process running in a pod. Use kubectl get pod <pod-name> to get information about your Scratchpad pod.
Scratchpad pods are named <release-name>-scratch-<first 7 characters of user name>-<hash> (e.g. insights-scratch-jsmith-c5415851ba45a47c4f7c50bc418dae46-vdhcc).
An example of the output returned when you run kubectl get pod insights-scratch-jsmith-c5415851ba45a47c4f7c50bc418dae46-vdhcc is shown below.
NAME                                                              READY   STATUS    RESTARTS       AGE
insights-scratch-jsmith-c5415851ba45a47c4f7c50bc418dae46-vdhcc    1/1     Running   0              15m
- NAME - The name of the pod (example-pod).
- READY - The number of containers in the pod that are ready (1/1).
- STATUS - The current status of the pod (Running).
- RESTARTS - The number of times the pod has been restarted (0).
- AGE - How long the pod has been running (5m).
Keycloak Permissions
The following Scratchpad roles are available for fine-grained permissions.
| Role | Description |
|---|---|
| insights.scratch.display | Evaluating q and Python expressions, and displaying or visualizing the results |
| insights.scratch.data | Querying a database using the query builder. |
| insights.scratch.sql | Querying a database SQL. |
| insights.scratch.qsql | Querying a database using the qsql. |
| insights.scratch.pipeline.test | Running "Quick Test" pipelines in the Scratchpad |
See keycloak permissions for further details on roles.
Scratchpad Layout
The Scratchpad is the central section of the Query window which is comprised of the following:
-
Editor - The Scratchpad is a scrollable editor window which is used to enter your code. There are 2 tabs at the bottom right-hand corner of the window that allow you to toggle between Q and Python editors.
-
Run Scratchpad - This button is used to run the code entered in the editor. The results are displayed in the tabs below the editor.

Firefox Users
If you’re having trouble scrolling in the Scratchpad while using Firefox, make sure that scrollbars are set to always be visible.
Scratchpad functionality
The Scratchpad supports the following:
- Creating ad hoc queries
- Viewing query results
- Developing and running q code in a Scratchpad
- Developing and running python code in a Scratchpad
- VSCode Integration
Create ad hoc queries in Scratchpad
To perform an ad hoc query using the Scratchpad:
- Create a query using the Query builder.
-
When analyzing the data retrieved from your kdb Insights Enterprise database you have two options for the language which can be used for this analysis, q or Python.
Click on either the Q or Python tab on the Scratchpad, depending on your language preference and enter your query. Note that when you use Python, only the first line of code is processed.
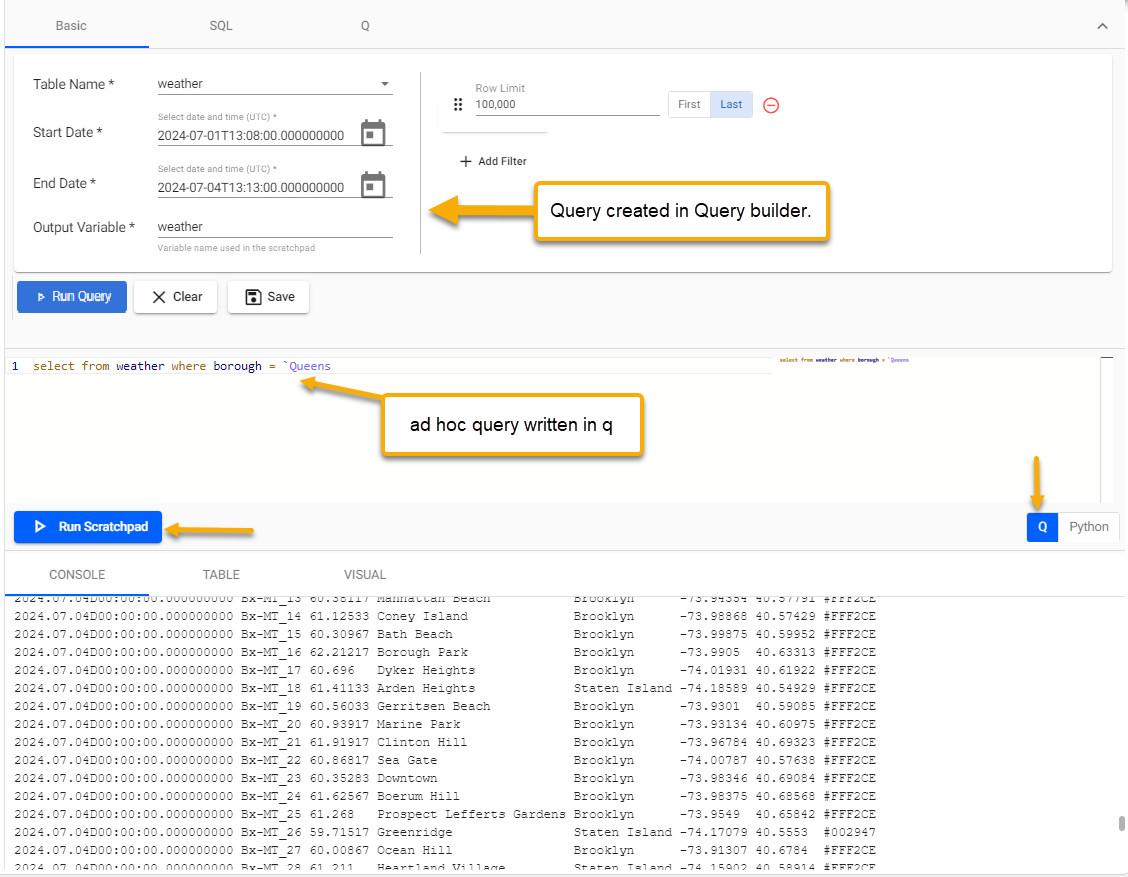
The following example shows a query which returns the results to an output variable called weather. This variable is then used in the Q query in the Scratchpad to perform a further ad hoc query to refine the results.
-
Click Run Scratchpad.
- View and analyse the results in the results panels.
Running Queries
Running a selected line of code context is set by preceding lines, similar to \d .myContext or system "d .myContext". The global context is used in the absence of a preceding line.
Read more about using q and Python in your queries.
Query results
Clicking Run Query returns the results of data queried using the Query builder or by ad hoc queries in the Scratchpad. These results can be viewed in one of the following tabs in the lower part of the Query Window:
By default, data is displayed in the Console tab. To display the results in another tab, switch the tab you want and click Run Query again and Run Scratchpad if you have an ad hoc query.
Console
The console is the default display for query results. Right-click in the console for additional options.

These options are described in the following table.
| Option | Description |
|---|---|
| Clear | Clears the console. |
| Toggle Source Expressions | Toggles the display of the code expression in the console. |
Console View
The console has a right-click menu for clearing the console, or toggling showing the source expressions above the result.
Table
The Table tab is a more structured display for query results with additional filter options. Results are paged and can be filtered.
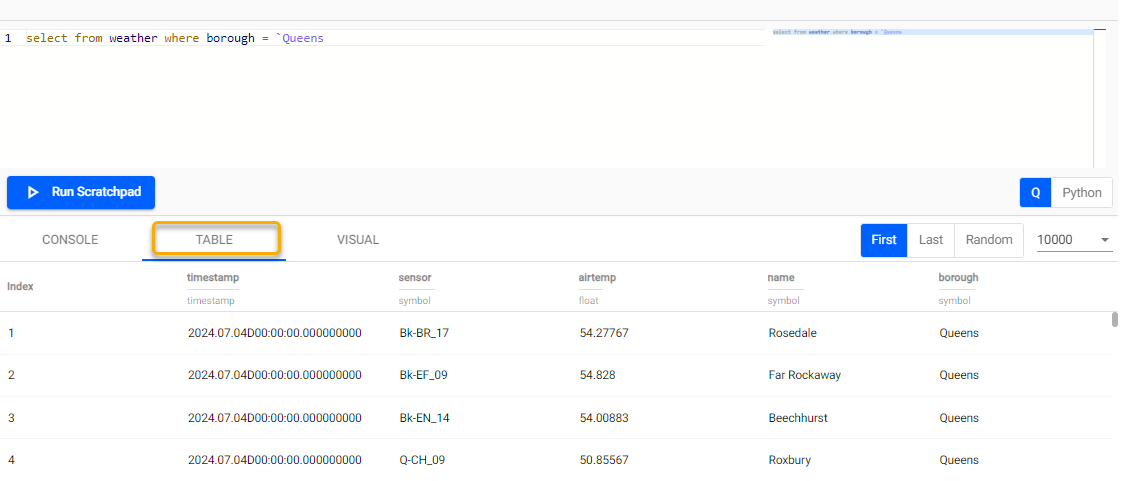
| Setting | Description |
|---|---|
| First | Display results from the start of the data source (page 1). |
| Last | Display results from the end of the data source (last page). |
| Random | Select a random point in the data set to display results. |
| # of results drop-down | This drop-down list lets you filter paged results by one of the selected numbers of results per page. |
Column Filter
Data columns, in the Table view can be sorted in ascending and descending order by clicking on the column header.
Additional filtering options are available from the triple-bar menu, above the data.
- Use AND/OR statements alongside operators Contains, Not contains, Equals, Not equal, Starts with, or Ends with for more comprehensive filtering.
- For example, the results below are filtered on the neighbourhood column where it Contain the value Tot. Filter criteria can be combined using AND and OR.

Visual
The Visual tab plots query results as a chart.
- You can choose between Bubble, Line or Bar charts.
- Chart settings give you options to configure the features of your chart.
The following example shows query results displayed in a bubble chart.
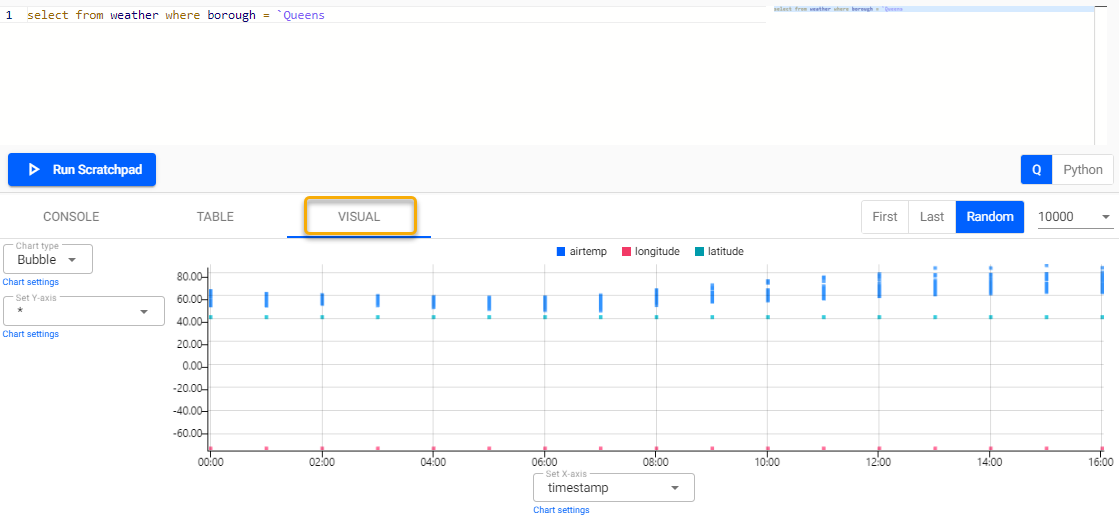
The following table defines how the data is to be displayed:
| Setting | Description |
|---|---|
| First | Displays results from the start of the data source (page 1). |
| Last | Displays results from the end of the data source (last page). |
| Random | Selects a random point in the data set to display results. |
| # of results drop-down | This drop-down list lets you filter paged results by one of these number of pages results per page. |
Chart Settings
You can define the following chart settings by clicking Chart settings under the Chart type drop-down. This provides you with the following settings:
To access the X and Y axis settings click on Chart settings under the Set X-/Y- axis drop-downs.

Display
The Display settings vary based on the chart type you select. The following screenshot shows the Display settings for a Bubble chart.
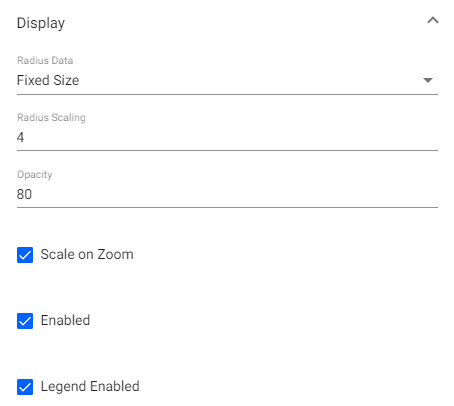
The following table describes the Display settings and indicates the chart types they apply to.
| Setting | Description | Bubble | Bar | Line |
|---|---|---|---|---|
| Radius Data | Choose between a data source variable or Fixed Size bubbles. | y | ||
| Radius Scaling | Set bubble size. | y | ||
| Color | Set the color of the bubble, bar, or line. | y | y | y |
| Opacity | Set the opacity of the bubble, bar, or line in the range 0 (transparent) to 100 (opaque). | y | y | y |
| Fill | Enable to fill the area of the line to the origin of the x-axis. | y | ||
| Scale on Zoom | Enable this option for bubbles to scale on zoom. When set the bubble size increases in size on zoom in and decreases on zoom out. | y | ||
| Bar Percentage | Toggle between Percentage or Fixed Width for bar width. | y | ||
| Enabled | The chart layer displays on the chart. | y | y | y |
| Legend Enabled | Enable for chart legend to appear above the chart | y | y | y |
Color Palette
Use the Color Palette settings to set the color for layers when wild card is used to plot data. Expand the dropdown for each data layer.
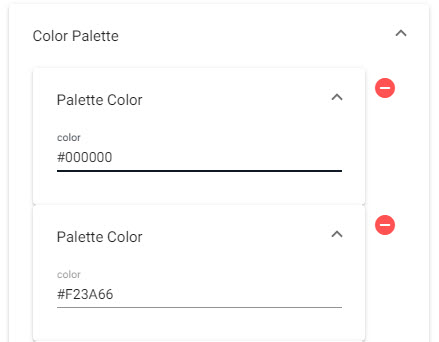
Sidebar chart settings
Use the drag-bar to reveal hidden chart settings if not already visible.
Animation
Use the Animation settings to specify what happens when layers are changed.
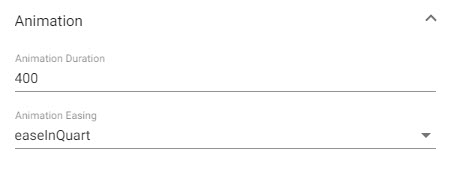
These settings are described in the following table.
| Setting | Description |
|---|---|
| Animation Duration | Set the time in milliseconds for animation duration. |
| Animation Easing | Choose animation behavior: swingFromTo, swingFrom, swingTo, easeFromTo, easeFrom, easeTo, easeInQuad, easeOutQuad, easeInOutQuad, easeInCubic, easeOutCubic, easeInOutCubic, easeInQuart, easeOutQuart, easeInOutQuart, easeInQuint, easeOutQuint, easeInSine, easeOutSine, easeInOutSine, easeInExpo, easeOutExpo, easeInOutExpo, easeInCirc, easeOutCirc, easeInOutCirc, easeOutBounce, easeInBack, easeOutBack, easeInOutBack, bounce, bouncePast, elastic. |
Overlay
The Overlay settings define crosshair and overlay behaviors.
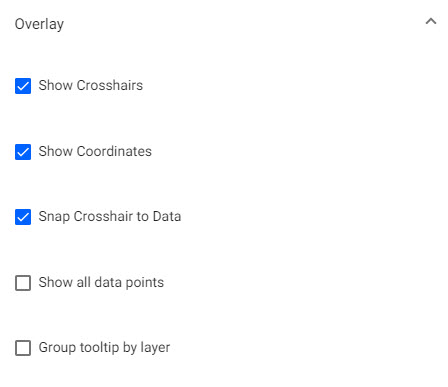
These settings are described in the following table.
| Setting | Description |
|---|---|
| Show Crosshairs | When enabled, this adds a crosshair to the chart. |
| Show Coordinates | When enabled, this displays axis values for cursor position in chart. |
| Snap Crosshair to Data | When enabled, the Crosshair position locks to the y-axis value relative to x-axis position. |
| Show all data points | When enabled, the Crosshair displays all values in a tooltip at the x-axis position. |
| Group tooltip by layer | When enabled, the display of chart values is grouped in the tooltip by data layers. |
X- and Y-Axis
The X Axis and Y Axis settings define the data variables to chart. Click the area above and below the y-axis dropdown, or left and right of x-axis dropdown, to open the property menus.
These following settings are configurable:
- Number of Ticks - This defines the number of tick labels to display in the x- or y-axis.
- Range
- Gridlines
- Format
Range
| Setting | Description |
|---|---|
| Use min max | Enable to use min/max axis range |
| Min | Set minimum value for the axis |
| Max | Set maximum value for the axis. |
Gridlines
| Setting | Description |
|---|---|
| Offset Gridlines | When enabled, sets gridlines between tick values. |
| Gridlines Color | Set the color of the gridlines used in the chart. |
| Gridlines Opacity | Defines the opacity of gridlines from 0 (transparent) to 100 (opaque). |
Format
| Setting | Description |
|---|---|
| Display | When enabled, displays tick values. |
| Begin at Zero | When enabled, plotted values start at 0 for the y-axis. |
| Numeric Format | Select between Number, Smart Number and Formatted Number. |
| Decimal Places | Define precision of y-axis labels. |
| Font size | Define font-size of tick labels. |
| Prefix | Add a text element before the y-axis label. |
| Suffix | Add a text element after y-axis tick label. |
| Hide Trailing Zeroes | When enabled, hides trailing zeroes from axis label. |
VSCode Integration
To work with existing code bases, versioned code, and to easily organize your code, the KX extension for VS Code extension offers an alternative to the Insights Scratchpad UI. This allows you to connect to the same q Scratchpad process accessible from the UI, so all variables are shared between the two interfaces. It supports evaluating q (from .q, or .quke files) or Python (from .py files). The same options for querying the database are available from the extension.
Next Steps
- Perform further analysis and development in the Scratchpad using q
- Perform further analysis and development in the Scratchpad using python
- Create advanced Visualisations