KX Dashboards
KX Dashboards is an interactive data visualization tool that enables non-technical and power users to query, transform, share and present live data insights.
Rich visualizations of both static and real-time streaming data can be built using drag-and-drop and point-and-click operations in an easy to use editor.
Powered by modern web technologies, Dashboards can be used in all major browsers across mobile and desktop environments.
Workspace
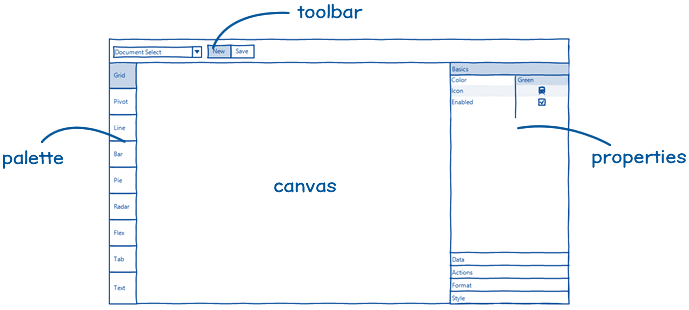
- KX Dashboards has an intuitive layout familiar to any user of office software. Components can be dragged from a palette on the left, arranged on a central canvas and modified via a property inspector on the right.
-

Components
Over 35 preinstalled components provide out-of-the-box functionality while custom components allow for complete extensibility.
| component | description |
|---|---|
| Data Grid | Tabular data display and handling. |
| ChartGL | Hardware accelerated charts using WebGL; supports line, bar, bubble, waterfall, bounds, candlestick, heatmap and baseline charts. |
| Pie Chart | Circular statistical graphic. |
| Radar Chart | 2D multivariate data graphic. |
| Pivot Grid | OLAP drilldown data display. |
| Canvas Chart | Basic line, bar, bubble, candlestick, violin, boxplot and waterfall charts. |
| Breadcrumbs | Navigation element for OLAP data. |
| Data Form | Input display for query parameters; text, dropdown and date picker selectors. |
| Layout Panel | Container for components. |
| Flex Panel | Flexible, two-component container. |
| Overlay Panel | Container to overlay components. |
| Tab Control | Tabbed component container. |
| Accordion | Collapsible component container. |
| Drop Down List | Single or multi-select dropdown component. |
| Text Input | A text input component. |
| Selection Controls | Radio or check-box selection control. |
| Date Picker | Date or date-time input. |
| Tree View | A tree-view navigation selection component. |
| Editable List | A custom dropdown menu. |
| Button | Single button supporting multi-action select |
| Text | WYSIWYG text editor with HTML support. |
| Navigation Menu | Navigation bar |
| Data Filter | User generated queries; text and dropdown filters (no coding required). |
| Visual Query Builder | Graph-based visual query builder; support for multi-data sources with update, group-by, join, filter and custom functions. |
| 3D Chart | 3D charting (with highlight rule support for 4D); dot, surface, bar, grid and line charts. |
| Sunburst | Sunburst (ring/doughnut) chart for hierarchical data. |
| Bitmap | Bitmap generated chart. |
| Gauge | Gauge chart. |
| Treemap | Treemap or heatmap data graphic. |
| Graph | Network/Flow relationship map |
| Map | Map component featuring Google maps. |
| Mapbox | Map component with 3D overlay driven by Mapbox. |
| Financial Chart | International financial charting component; OHLC, Line, Candlestick, Mountain, Heikin Ashi, Kagi, and over 20 technical indicators and user annotation support. |
| ChartIQ | Integration of chartIQ financial charts; separate license requried. |
| Code Editor | Embeddable code editor with support for json, plaintext, handlebars, html, java, javascript, markdown, python, r, sql, typescript, xml, and q. |
| Bipartite Chart | A chart of two independent data sets, with relationship connections between the data sets. |
| Range Slider | A data range selector; interval or time. |
| Playback | A multi-control stream player suitable for video content, interval or time sequence data playback. |
| External Content | Embed web page content |
| Video | Add video content to a dashboard |
| Vega Chart | Support for Visualization Grammar charts. |
| Analyst Visual | Embed a KX Developer graphic into a chart. |
| Scatter | Add a quartet or matrix graphic. |
| Contour | Add a contour graphic; plotting 3D data in 2D. |
| Sankey | A flow diagram. |
| Blob Download | Download files from byte array in database. |
| Luna | A high-performance temporal geospatial visualization graphic. |
| Trade | Add a Forex trade panel with TWAP and VWAP support and tick updates. |
| Form Builder | Create a custom form for users. |
| Custom | Create a custom component with app.js. |