Views Overview
This page provides an overview of kdb Insights Enterprise Views.
kdb Insights Enterprise Views is an embedded version of KX Dashboards which enables you to create visualizations of your data. Using the drag and drop interface you can build Views containing feature rich components such as charts, maps, data grids and many other components. These visualization help you to analyze and gain insights from your data.
kdb Insights Enterprise supports over 40 components, which can be added to your Views.
Demo views
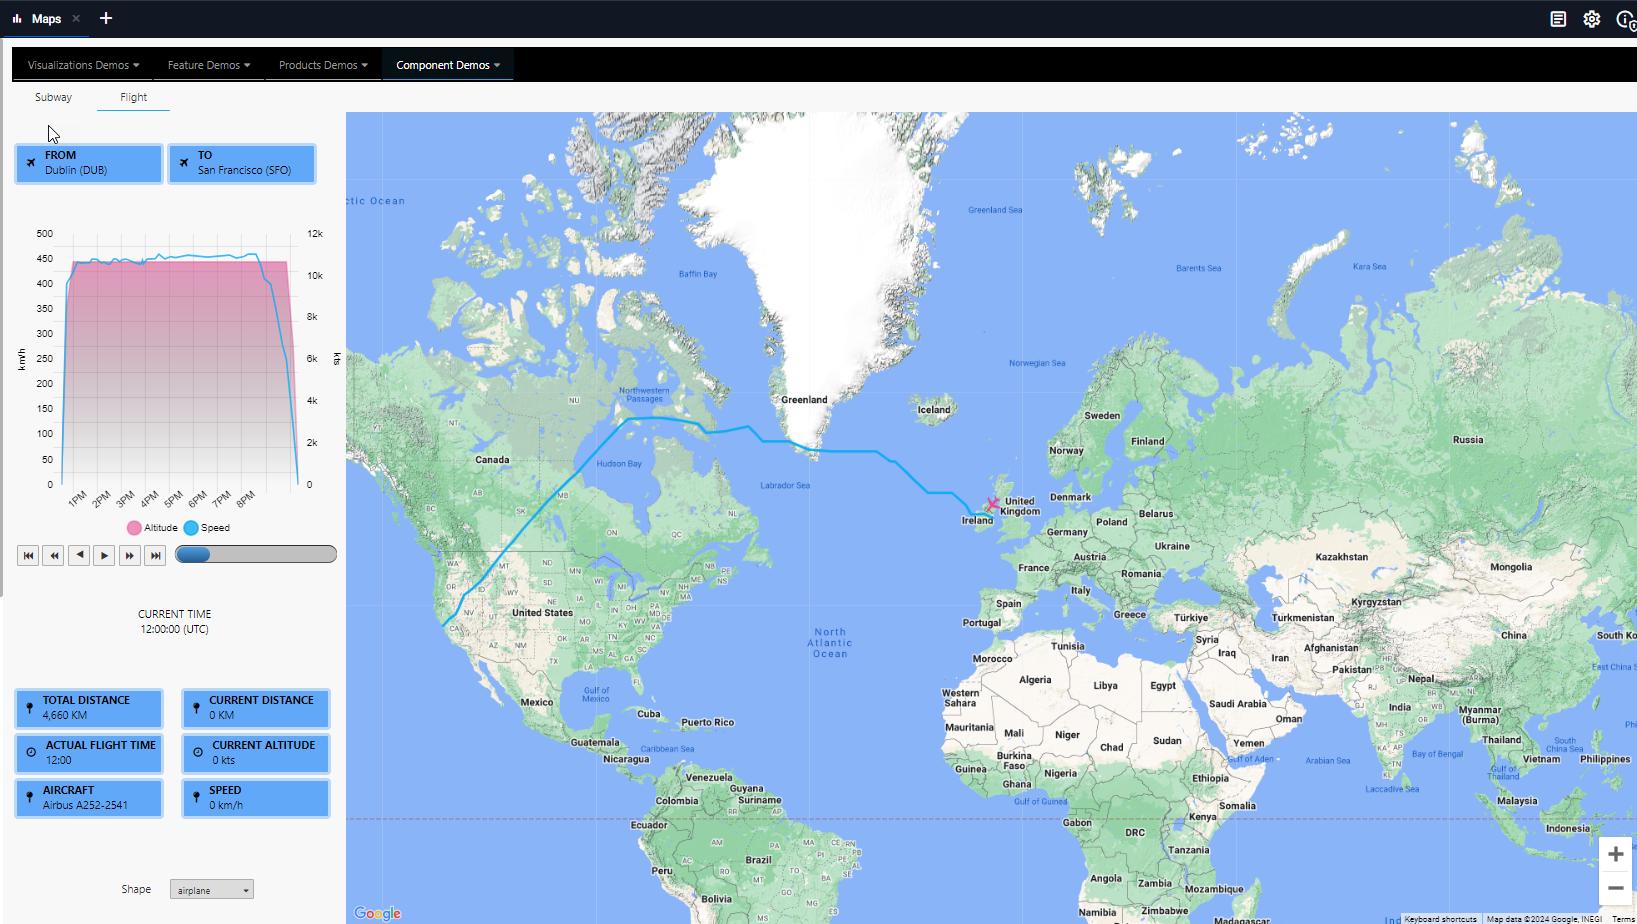
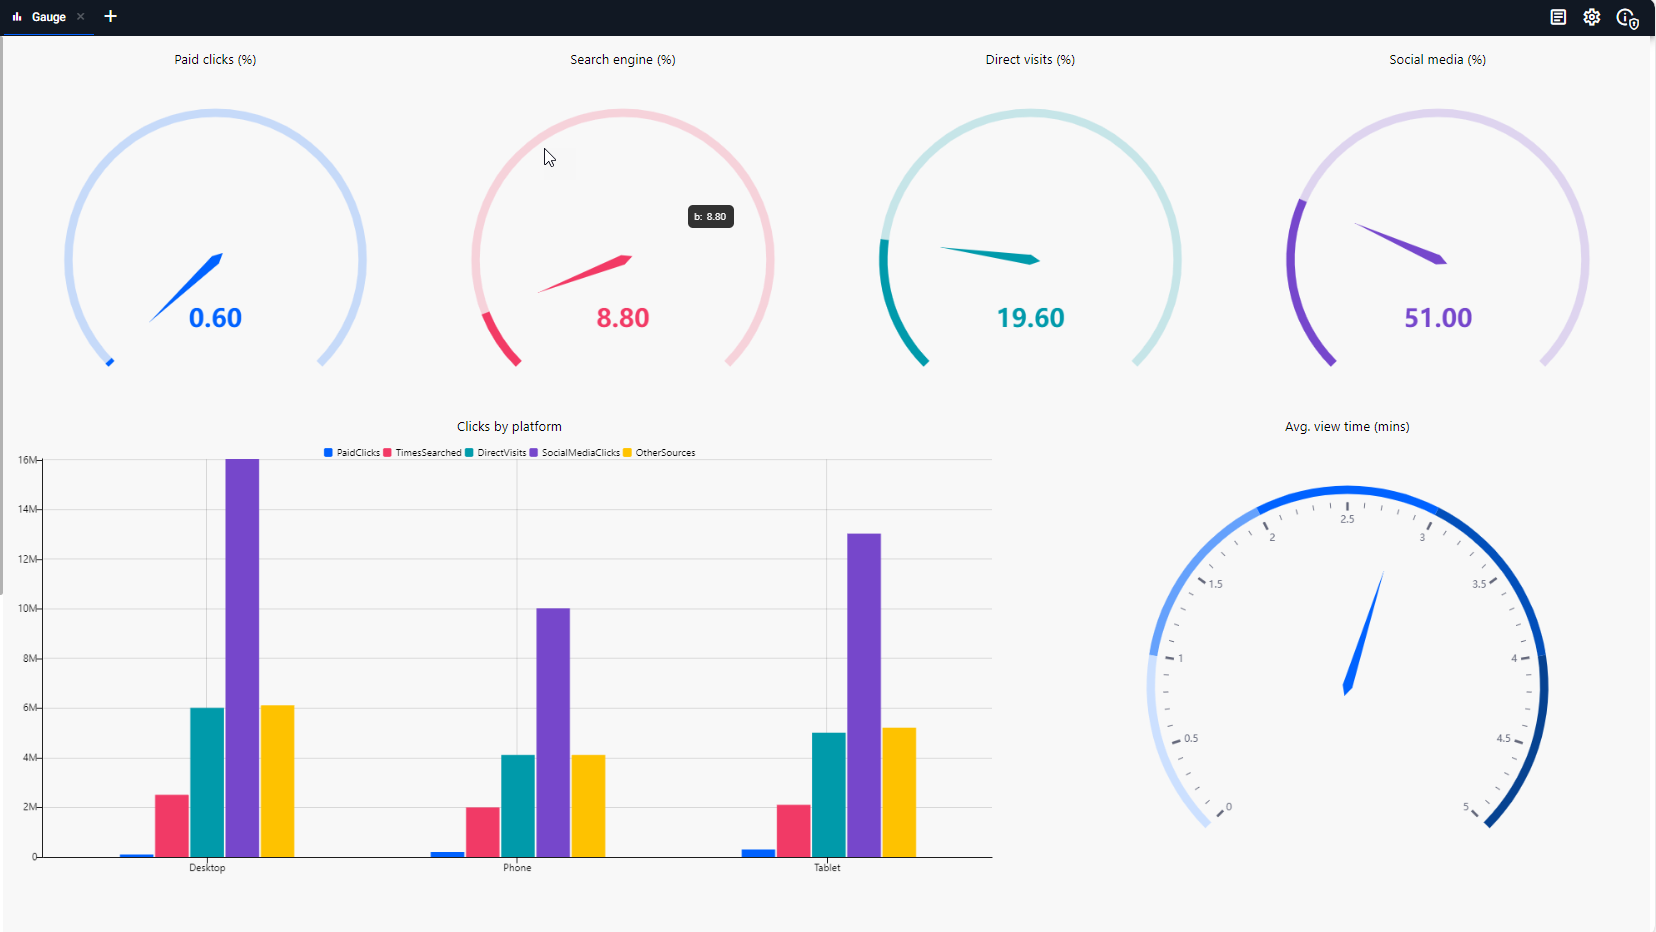
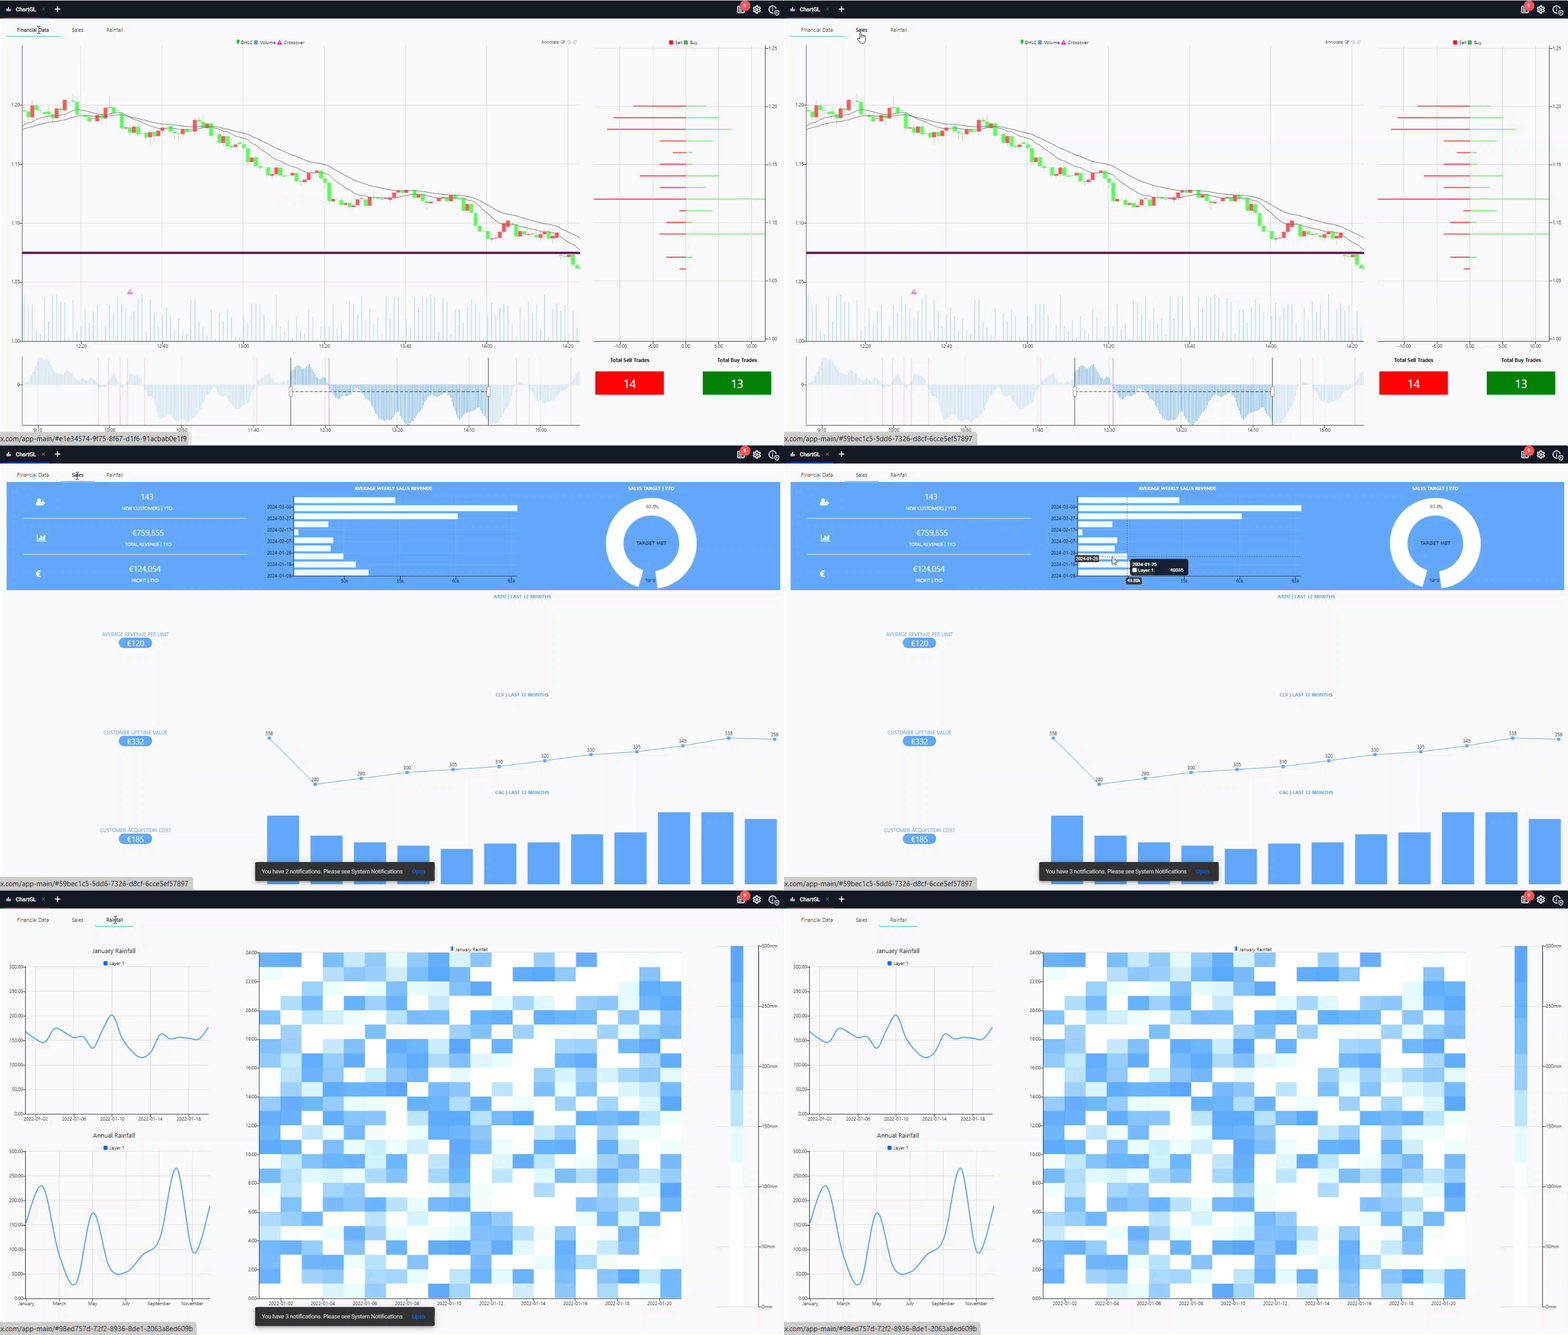
The following tabs show examples of the type of views you can create. These demos come built into kdb Insights Enterprise. Click Views/Demos on the left-hand menu to access them.
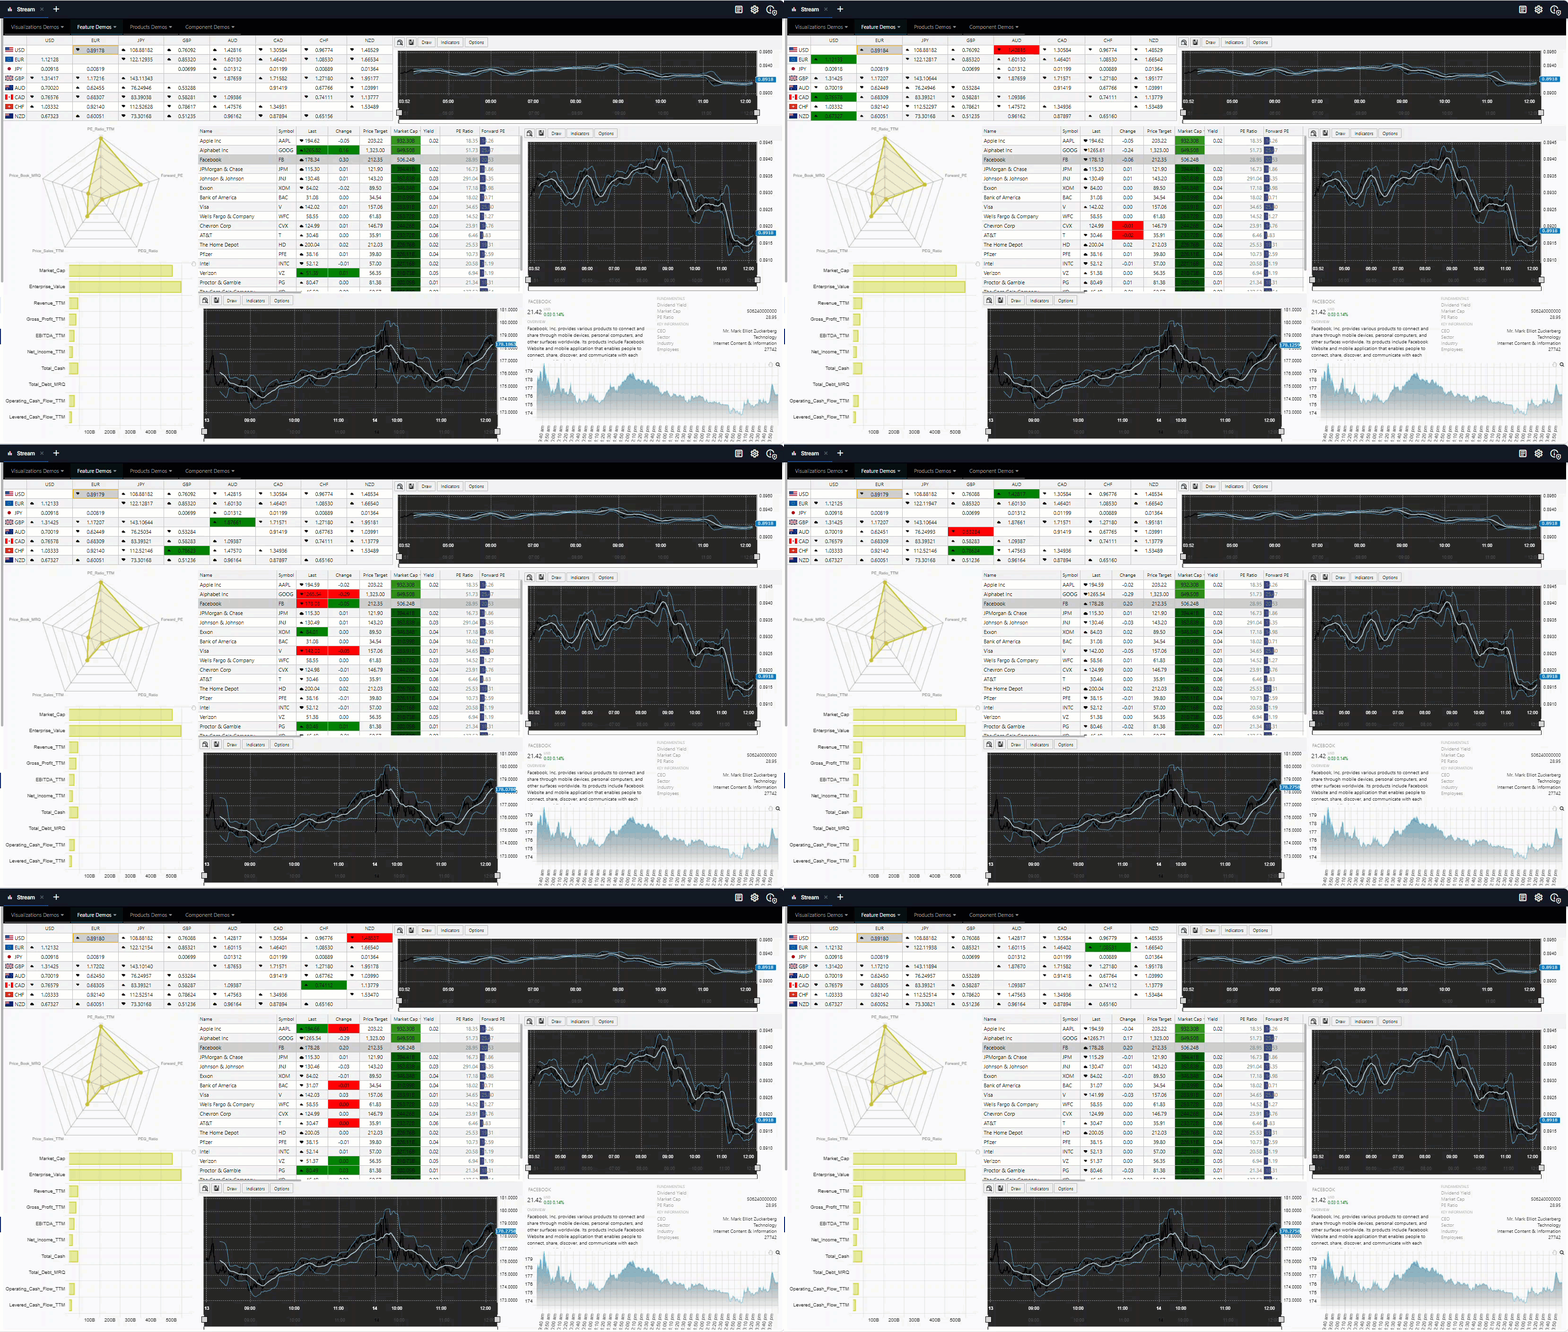
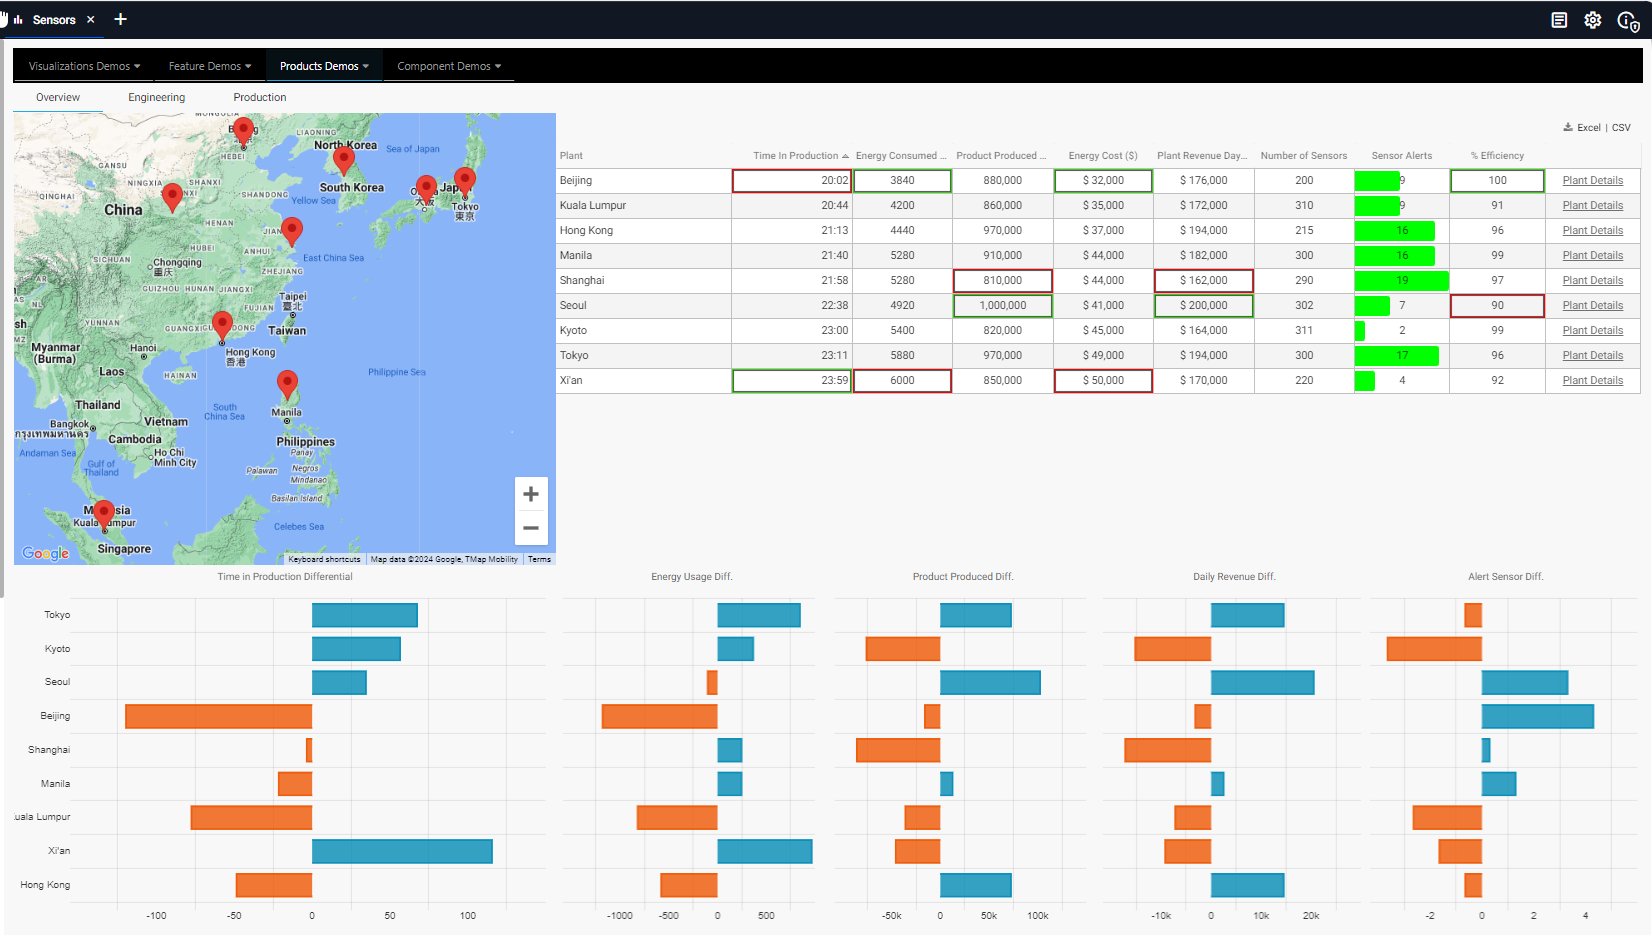
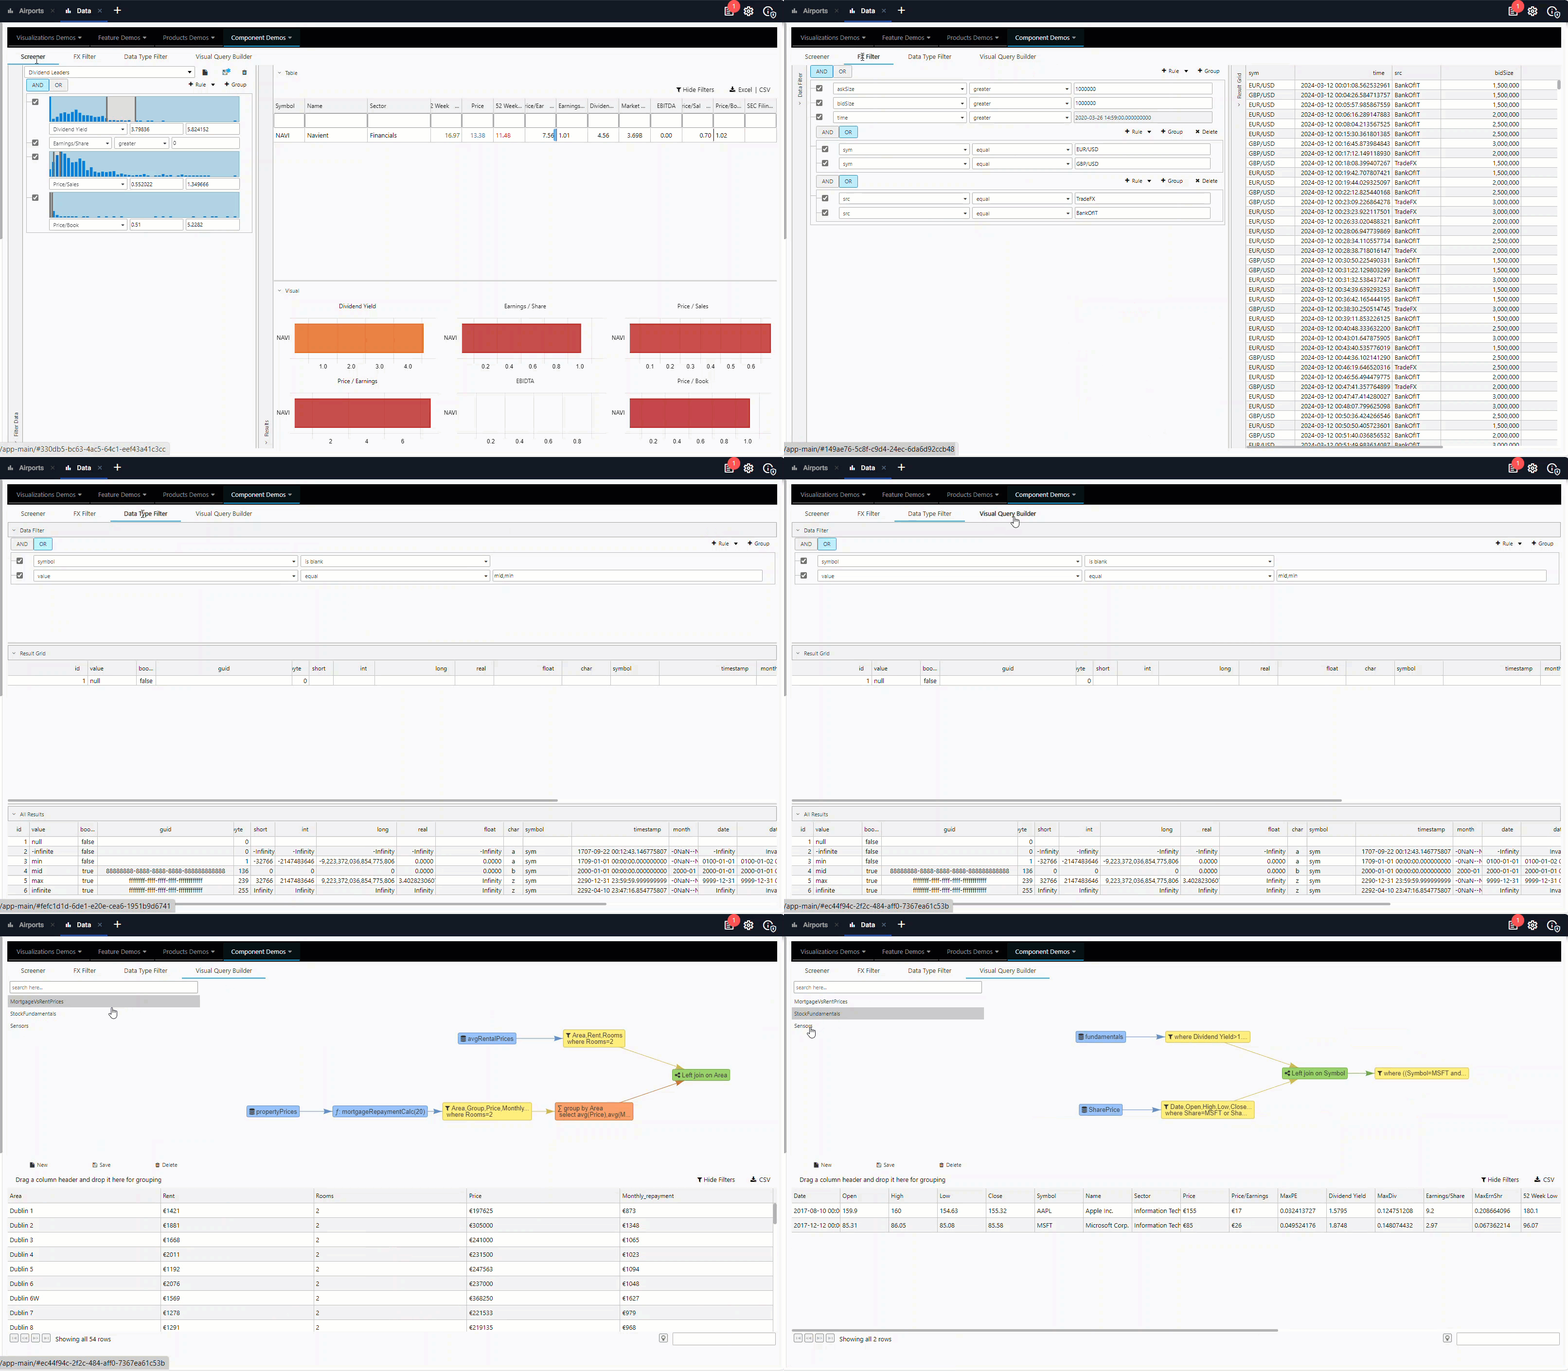
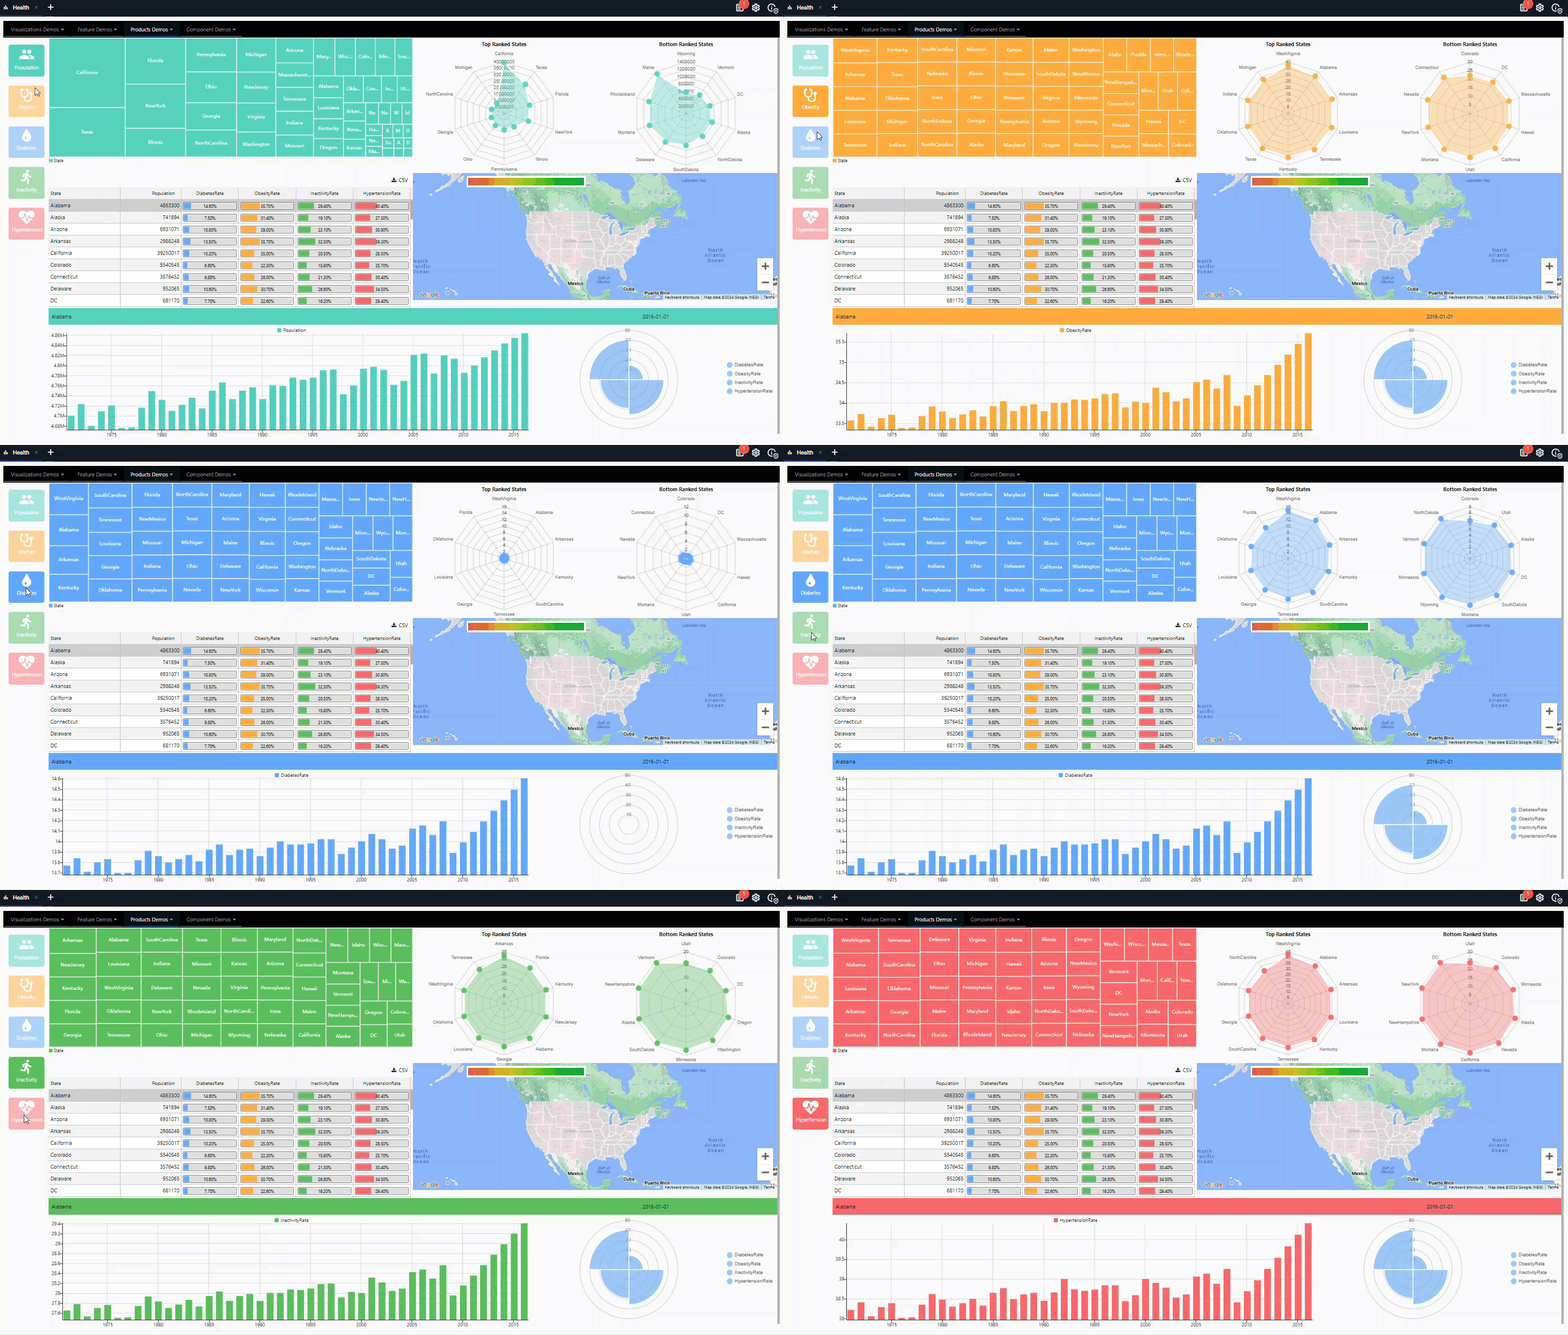
The following pages provide details on how to create and configure Views:
On this page you can see how to access an index of views.
Index of views
Click on Views in the left-hand menu to view a list of all your views.
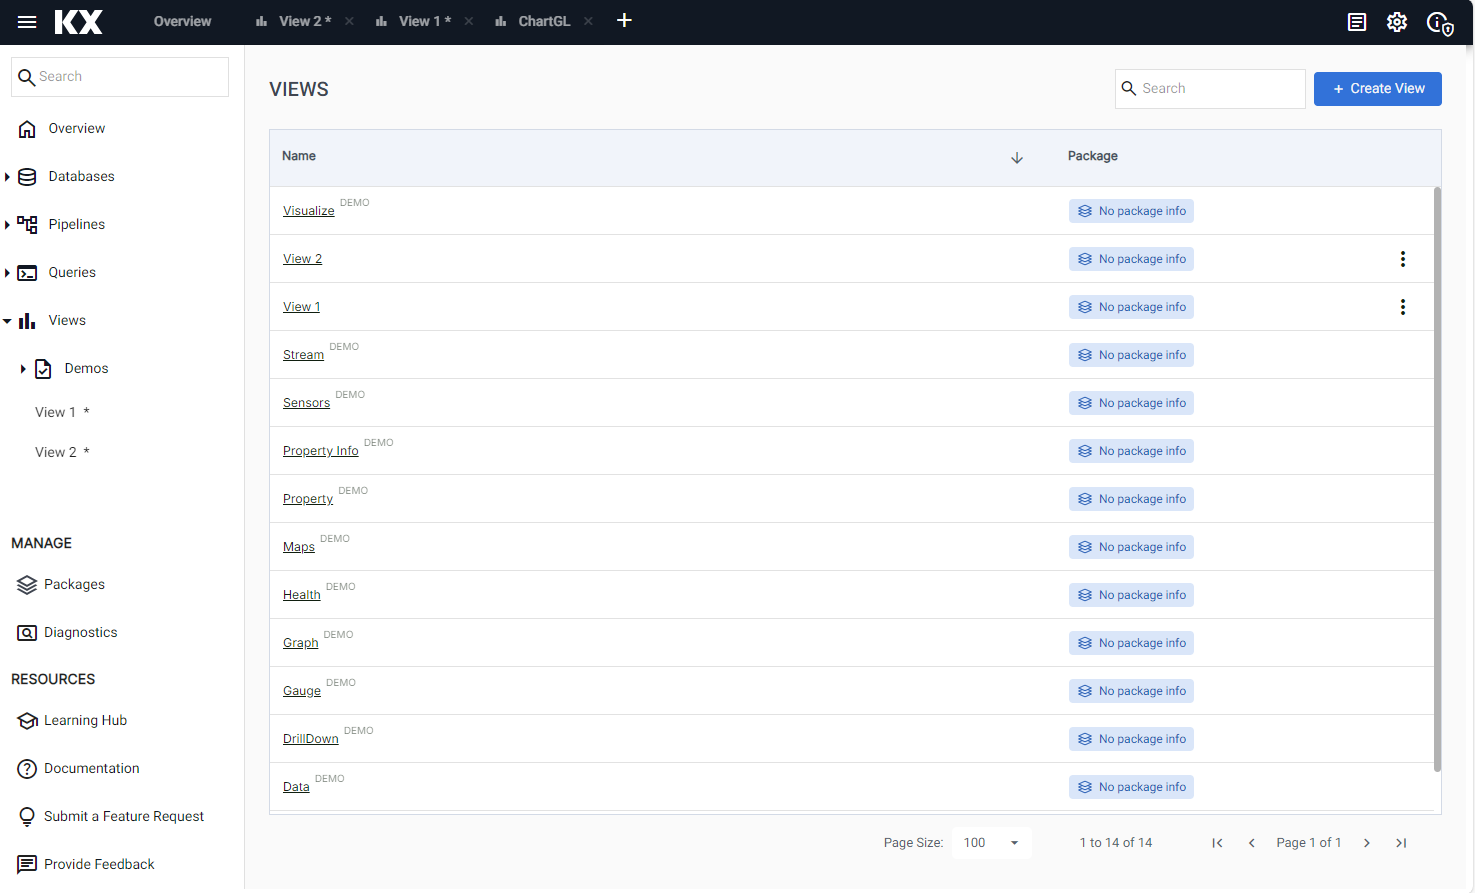
The following details are displayed:
| Column | Description |
|---|---|
| Name | The view name. Click on the name to go the view screen. Views are listed alphabetically and can be reordered by clicking the column name. This listing includes the names of demo views. |
| Package | The name and version of the package that contains this view. |
| Actions | Click the three dots, to the right of the query, to view the options available. |
Click Create View to create a new view.
Next Steps
- Read the quickstart guide to setting up a view.
- Read the detailed guide to setting up views.
Further reading
The following pages provide guided walkthroughs on creating Views: