kdb Insights Enterprise Web Interface
kdb Insights Enterprise has both a web interface and a command line interface. This page introduces you to the web interface and its features and functionality.
The web interface described in this section, enables you to create and build databases and to query and visualize data in those databases.
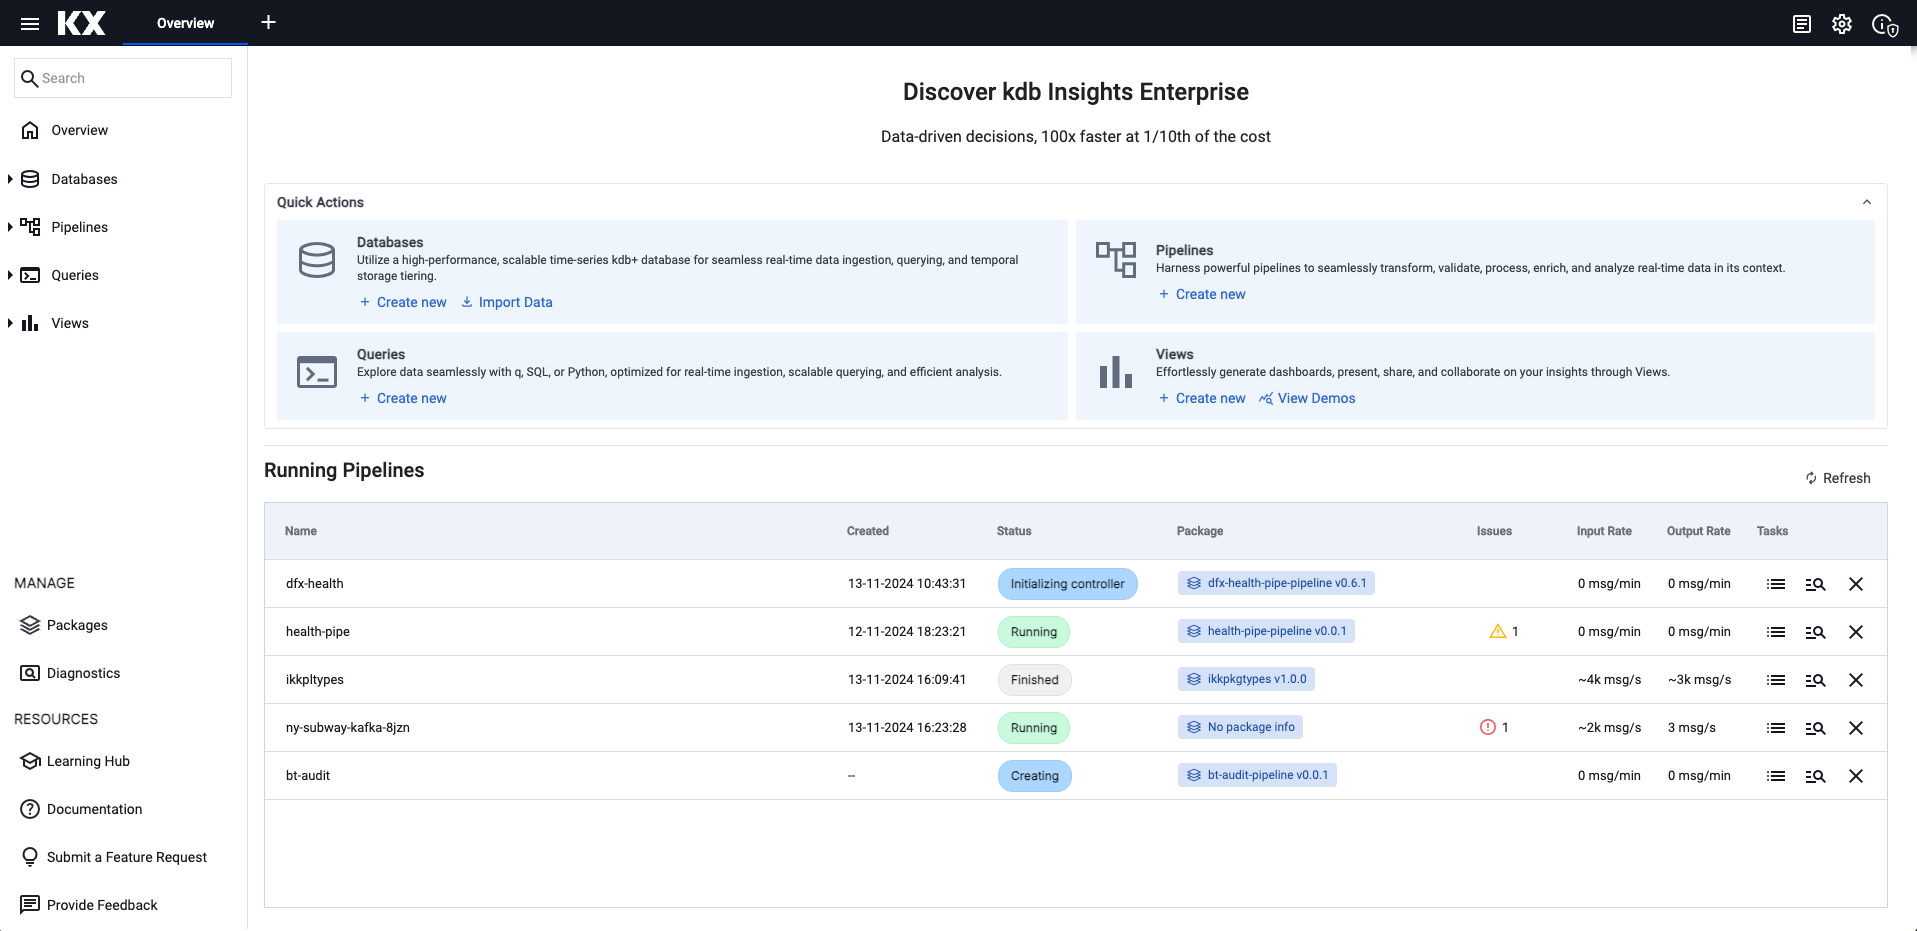
After you login to the kdb Insights Enterprise web interface you are presented with the Overview page.
The web interface is made up of the following elements:
- Left-hand menu
- Ribbon menu.
- Main display area. For example, on the Overview page this displays the Quick Actions and Running Pipelines
Menu items are navigable by Tab, Enter to select, and Esc to close.
Roles
Access to features of kdb Insights Enterprise web interface is managed through roles. You can only use the features assigned to your specific role. If you don't see certain functionality mentioned in this documentation, please contact your system administrator.
Supported Browsers
kdb Insights Enterprise web interface runs on the latest version of Chrome, Safari, Edge and Firefox. We recommend that you use Chrome.
Left hand menu
The left-hand menu contains dropdown menus for databases, pipelines, queries and views. You also have options to view diagnostics and perform upgrades to streams and schemas. You can refine the elements displayed on this menu using the search option. The following table illustrates each of these options and provides links to the functionality they support.
| Icon | Description |
|---|---|
Search |
Perform a search to quickly locate entities in the left hand panel. |
Overview |
Return to the Overview page. |
Databases |
Displays a list of available databases. From here you can create, deploy, export or delete a database. |
Pipelines |
Create, export, rename or delete a pipeline. |
Queries |
Create, rename or delete a query. |
Views |
Create, share, rename or delete a view. |
| MANAGE | |
Packages |
Manage packages. |
Diagnostics |
Troubleshoot pipeline and database errors with diagnostics. |
| RESOURCES | |
Learning Hub |
Access the KX learning hub. |
Documentation |
Read the KX product documentation. |
Submit a Feature Request |
Access the KX Feature Request Portal. |
Provide Feedback |
Submit your feedback on your experience with this product. |
Ribbon Menu
The ribbon menu runs across the top of all web interface screens.
Click + to open a menu of items for databases, pipelines, queries, and views.
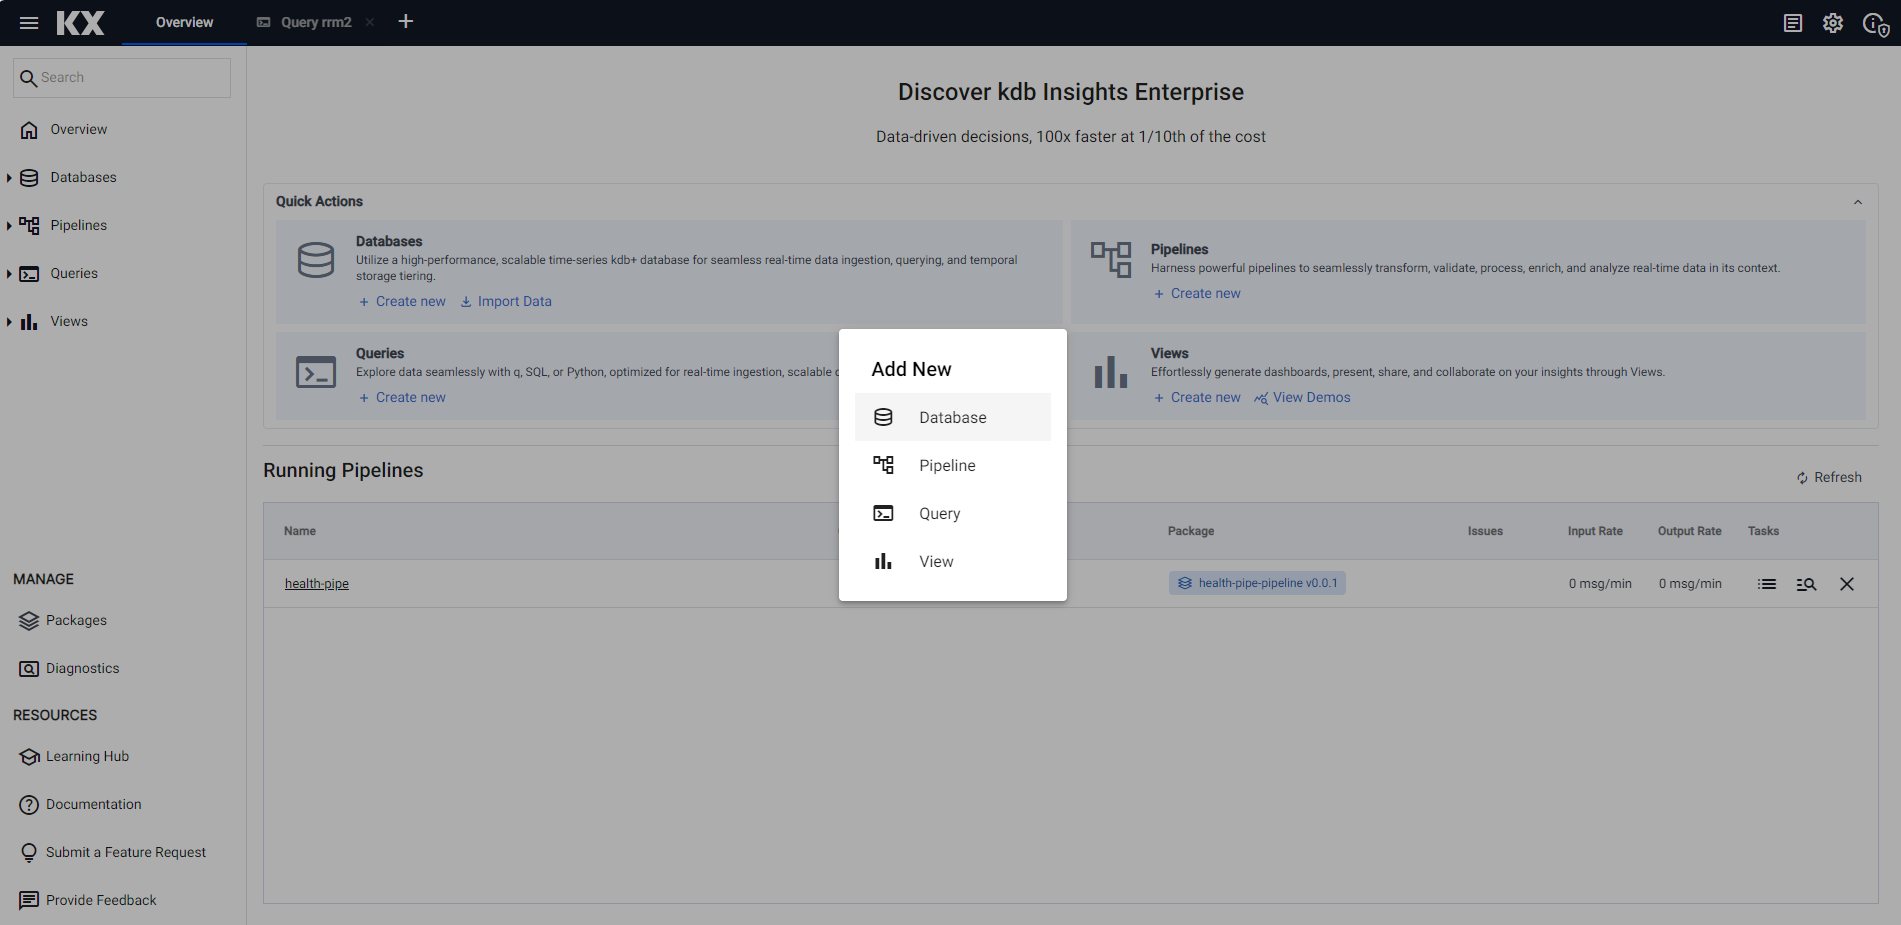
Use Tab to navigate between selections and Esc to close the dialog. Use Enter to execute an action.
The right hand side of the ribbon menu contains a number of icons described in the next section.
Ribbon menu icons
The ribbon menu contains the following icons:
| Item | Description |
|---|---|
 System Notifications |
Click the System Notifications icon to display a log of system errors and information messages. Click  for a full page view. for a full page view. |
 System Settings |
Click the System Settings icon to download system diagnostics. Note: This is a resource heavy process to run. |
 System Information |
Click the System Information icon to display: the kdb Insights Enterprise version and license information, the status of encryption of data in transit and a link to documentation. |
User Profile |
Click the user profile button to display the name of the currently logged in user and gives the option to logout. |
Overview
The Overview page is the home page for kdb Insights Enterprise web interface.
On the Overview page you see two main sections:
Quick Actions
The Overview page contains actions that allow you to build, import, query and visualize data.
- Databases
- Create New databases and schemas.
- Import Data using the import wizard to bring data into the system.
- Queries
- Create new queries to explore your data using q, SQL or python.
- Pipelines
- Create new pipelines to ingest data into your databases.
- Views
- Create new views to present and share your insights using views.
- View Demos which illustrate the power and versatility of the Views in kdb Insights Enterprise.
Running Pipelines
The lower section of the Overview page displays a table which lists the status of active or finished running pipelines that encountered errors during the activation process.
See here for information on pipeline status.
Additional Actions
When you expand the menu on any of the left hand menu items and hover over the entities listed you can see three dots to the right of the entity name indicating there are more actions available.
Click on the more actions button to see the options available:
- Deploy - you can deploy a database using the web interface.
- Rename - click Rename to change the name of any of the entities in the web interface
- Delete - click Delete to delete any of the entities in the web interface. You are asked to confirm the request.
- Share - you can share views of your data with others.