KX Equity Analytics for Bloomberg Data License Accelerator Overview
This page provides an overview of the KX Equities Analytics accelerator, use cases, and architecture and features.
Introduction
The KX Equities Analytics accelerator combines your own order data with Bloomberg Data License's historical equities data to produce a suite of accurate analytics for evaluating your equities order executions. All ingested tick-level data is fully accessible and can be further queried using SQL, analyzed with enhanced Accelerator APIs using Python, or accessed from any downstream application through REST.
The entire Accelerator can be configured and launched on an existing kdb IE installation in minutes. Quants, business users, and developers can get instant access to high quality Bloomberg data, paired with the power and performance of kdb Insights Enterprise, all without a lengthy implementation project.
Use cases
The Equities Analytics Accelerator provides post-trade analytics with nearly 200 metrics, including:
- Arrival pricing and valuation
- Interval and sub-interval pricing, volume, and volatility metrics
- Post-trade reversion pricing and returns
- Execution shortfall
- Metric summarization and aggregation
All measures are fully customizable and extendable with user-defined analytics, and can be reported on from within kdb Insights Enterprise itself or externally using Python or any other REST-capable language.
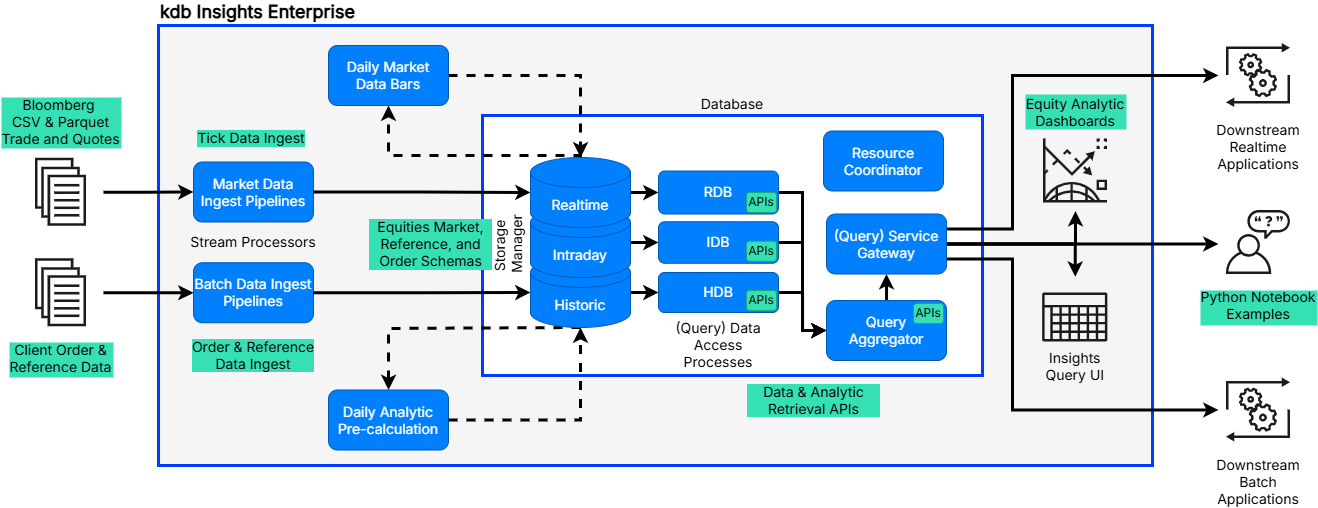
Architecture and features
The KX Accelerator delivers a scalable, performant architecture including:
- A pipeline to ingest Bloomberg Data License format L1 equities quote & trade data in CSV or Parquet format:
bbgquoteingest-pipeline,bbgtradeingest-pipelineandbbgquotepq-pipeline,bbgtradepq-pipeline - A pipeline for ingesting EOD OMS order data for analysis:
eqeaorderingest-pipeline - Pipelines for ingesting exchange times and EOD FX reference rates:
eqeaexchange-refdata-pipelineandeqeafxrates-pipeline - Schemas for
QuoteandInstrumentdata for the above - Nearly 200 customizable and extendable analytic metrics
- Standard FSI Accelerator analytic and query APIs available through the FSI Library
- An Insights performance report View that demonstrates summarization and visualization, including:
- Markout curves
- Slippage distribution charts
- Boxplot summarizations
- An example Jupyter notebook, demonstrating Python and REST API access
Further details
For more information, refer to the following documentation:
- Quickstart for details and setup guidelines for the Accelerator
- Market Data Ingest for details and setup guidelines for market data ingest
- Order Data Ingest for order pipeline information and documentation
- Custom Analytics Developer Guide, which is a developer guide for adding your own custom analytics